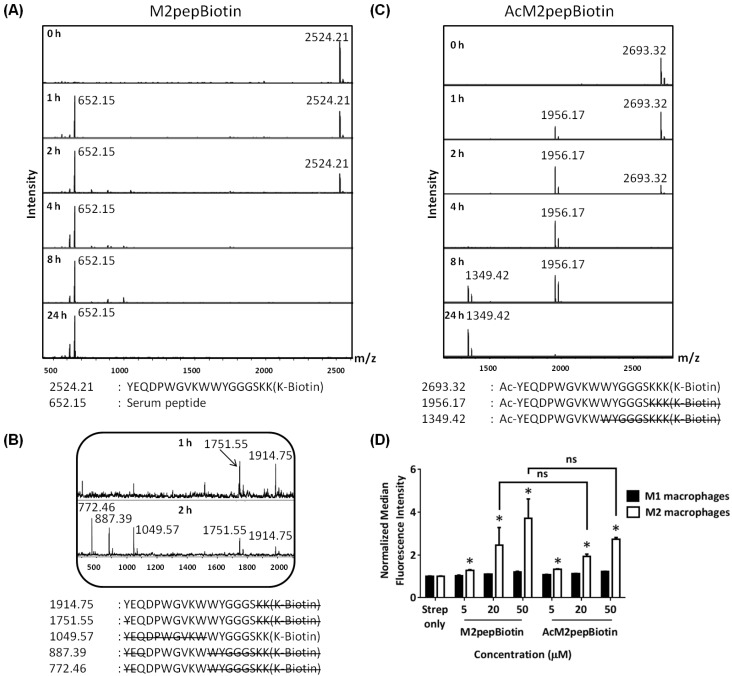
Figure 1.
(A) MALDI-TOF MS spectra of M2pepBiotin at different serum incubation times. (B) Zoomed-in MALDI-TOF MS spectra of M2pepBiotin at 1 and 2 h. (C) MALDI-TOF MS spectra of AcM2pepBiotin at different serum incubation times. Adjacent to the primary peaks are their respective Na+ adducts. (D) Binding of AcM2pepBiotin versus M2pepBiotin to M1 and M2 macrophages. Stars denote statistical significance between M1 and M2 macrophages in the same treatment group. * P < 0.05, ns = not statistically significant.

