Abstract
Mono-disperse spherical mesoporous nano- and micro- bioactive glass particles (NMBGs) can find potential use in bone tissue engineering. However, their size-dependent interaction with osteoblasts has never been studied. Herein, the proliferation, morphology, cytoskeleton organization and apoptosis of MC3T3-E1 osteoblasts are studied in response to the NMBGs with varying sizes (from 61 to 1085 nm) at different concentrations. Generally, smaller NMBGs at a lower dose show weaker cytotoxicity compared to the larger particles and higher doses, arising from a novel size-dependent mechanism of intracellular localization of NMBGs observed by electron and confocal microscopy. Specifically, NMBGs pass through perinuclear membrane of the cells to initiate endocytosis. Once internalized, the sizes of NMBGs are found to play a significant role in determining their intracellular localization. When the NMBGs are smaller than 174 nm, they are transported via the lysosomal pathway and phagocytized in lysosomes, resulting in little cytotoxicity at later time points. On the contrary, larger NMBGs (over 174 nm) escape from the lysosomes after endocytosis, and are localized inside the intra-cytoplasmic vacuoles or randomly in the cytoplasm of cells. Their lysosomal escape may damage the lysosomes, inducing cell apoptosis and thus the greater cytotoxicity.
Keywords: Size-Dependent Mechanism, Nano-/Micro-Bioactive Glasses, Cytotoxicity, Intracellular Localization, Osteoblasts
INTRODUCTION
Since the idea of the third-generation biomedical materials was proposed, the emphasis in the preparation of bioactive glasses (BGs) has been shifted from traditional bulk to nanometer materials.1–4 To date, nano- and micro-BGs (NMBGs) have been considered as promising candidates for various biomedical applications, including gene and drug delivery, dental re-mineralization and bone tissue engineering owing to their mesoporous structures as well as biomineralization, hemostatic and antibacterial capabilities.2, 5–11 NMBGs may outperform silica particles in these applications due to the formation of useful ionic products such as calcium ions from BGs dissolution. For example, elevated intracellular calcium ions was reported as an important factor allowing transfection agents to escape the phagocytic pathway,12, 13 suggesting the benefit of using NMBGs as a gene transfection agent. Many studies suggested that controlled release of biologically active Ca and Si ions from BGs led to the bone-bonding ability of BGs as well as the up-regulation and activation of genes in osteoprogenitor cells giving rise to rapid bone regeneration.14–16 In addition, NMBGs could be released from worn BG products used in vivo. The safety of nanomaterials is different from the traditional material. For instance, recent studies have shown that exposure of endothelial cells to titanium oxide nanomaterials causes endothelial cell leakiness.17 Thus the long term potential toxicology and intracellular trafficking of NMBGs should be studied in order to understand their fundamental interactions with living tissues.
Some recent in vitro toxicity studies have suggested that the toxicity of nanoparticles were dependent on their sizes, concentrations and shapes.18–20 Microscopic spherical BGs exhibited higher biological responses than irregular BGs.21 Especially, they could induce osteogenesis without adding any osteogenic supplements. Therefore, spherical mesoporous BGs may be more suitable for biomedical applications. Labbaf et al. investigated the effect of sub-micron spherical BGs with a size of 250±75 nm on the cellular functions of human mesenchymal stem cells (hMSCs).3 Their results showed that BGs with a dose of 50 μg/mL did not produce any obvious cytotoxicity. Recently, Tsigkou et al. studied the interaction between cells and spherical mono-dispersed BGs with a similar size (215±20 nm).12 They demonstrated that 50 μg/mL of mono-BGs did not significantly inhibit the metabolic activities of human bone marrow and adipose-derived stem cells. Additionally, they found that a large number of particles were internalized by the cells but had little effect on the cell behavior.
The aforementioned studies on NMBGs were focused only on one particle size, preventing us from understanding the effect of sizes on the cellular behaviors of NMBGs. NMBGs were similar to nano- and micro- silica particles (NMSPs) in terms of compositions. The safety of silica-based nanomaterials such as NMSPs has been a concern, which sparked many studies in vitro and in vivo.5, 22–26 Thus it triggered our desire to understand the cytotoxicity of NMBGs. However, in vitro studies have reported variable and conflicting results about the in vitro safety profile of different sizes of NMSPs.20, 27–29 This fact encouraged us to clarify the potential confusion about the size effect in the cytotoxicity of NMBGs.
Hence, this work studied the interactions between MC3T3-E1osteoblast cells and mono-disperse spherical NMBGs with varying diameters to understand the intracellular trafficking and cellular toxicity of NMBGs. A modified sol–gel method, using dodecylamine (DDA) as both a catalyst and a templating agent, was first employed to prepare NMBGs with different sizes (61 nm, 174 nm, 327 nm, 484 nm, 647 nm, 743 nm, 990 nm and 1085 nm). Then the effects of size and dose of NMBGs on the behaviors of MC3T3-E1 were systematically investigated. The knowledge on the particle-induced cytotoxicity will allow the investigators to have a more comprehensive understanding of the interactions between NMBGs and cells. Such understanding could guide us to design bioactive glass for specific biomedical applications.
MATERIALS AND METHODS
Preparation of NMBGs
Sol–gel glasses containing 80 mol% SiO2 were reported to be bioactive.12, 30–32 Thus NMBGs with a molar composition of 80% SiO2, 16% CaO and 4% P2O5 were synthesized by a modified sol–gel technique, where DDA (Aladdin) served as both a catalyst and a template, following our previous publications.31, 33 The particle size distribution and mean average size could be tuned by controlling the solution composition and the concentration of DDA. Spherical NMBGs with a mean size of 61 nm, 174 nm, 327 nm, 484 nm, 647 nm, 743 nm, 990 nm and 1085 nm were synthesized by using the DDA concentrations of 0.02 mol/L, 0.06 mol/L, 0.12 mol/L, 0.15 mol/L, 0.20 mol/L, 0.24 mol/L, 0.28 mol/L and 0.30 mol/L, respectively. The resultant spherical NMBGs with different sizes were denoted as Group-61 nm, Group-174 nm, Group-327 nm, Group-484 nm, Group-647 nm, Group-743 nm, Group-990 nm and Group-1085 nm, respectively. 77 S BGs, a well-known sol–gel BGs with the same composition,34, 35 was used as a control. The resultant bulk materials of 77 S were ground and sieved to 270 meshes for testing (below 53 μm). Therefore, 9 experimental groups of BGs (suspended in Alpha Minimum Essential Medium (α-MEM)) were prepared for testing their physical properties (Table I).
Table I.
Characterization of NMBGs with the concentration of 150 μg/mL.
| Group (150 μg/mL) | Zeta potential (mV) (a) | Ca concentrations (μg/mL)(b) | Si concentrations (μg/mL)(b) | P concentrations (μg/mL)(b) | Osmolality measured *(mOsm/kg)(c) |
|---|---|---|---|---|---|
| Blank (α-MEM) | – | 71.4 | 0.3 | 32.4 | 320.0±12.3 |
| Group-61 nm | −23.8 | 75.7 | 10.9 | 30.5 | 320.3±12.5 |
| Group-174 nm | −22.6 | 77.8 | 11.5 | 30.3 | 321.0±9.6 |
| Group-327 nm | −21.6 | 75.1 | 10.1 | 31.3 | 326.6±8.6 |
| Group-484 nm | −15.6 | 77.9 | 8.7 | 30.8 | 327.0±11.5 |
| Group-647 nm | −14.8 | 77.2 | 6.9 | 31.1 | 331.3±13.0 |
| Group-743 nm | −13.8 | 77.3 | 6.9 | 31.0 | 333.0±5.2 |
| Group-990 nm | −12.8 | 77.3 | 4.6 | 30.9 | 337.0±9.0 |
| Group-1085 nm | −12.3 | 76.4 | 6.4 | 30.8 | 328.0±0.0 |
| Group-77 S | −5.04 | 76.9 | 8.3 | 30.9 | 328.6±4.0 |
Notes:
Zeta Potential measured by Zetasizer nano ZS.
Ion concentrations analyzed using ICP-AES.
Osmolality measured by Osmometer, model 3D3 (Advanced Instruments).
Characterization of NMBGs
Morphologies of the samples were observed with a JEM-2100HR transmission electron microscope (TEM). The size distribution and zeta potentials of NMBG particles were measured in double-distilled water by a Zetasizer nano ZS (Malvern Instrument Corp., UK). NMBGs were added to culture media to reach a concentration of 150 μg/mL. After 24 h, the culture media was then centrifuged. The concentrations of Si, Ca, and P in the resultant supernatant were analyzed using an inductively coupled plasma atomic emission spectrometer (ICP-AES, PS1000-AT, Leeman, USA). The precise osmolality of the supernatant was determined directly on 1 mL samples using an advanced micro-osmometer (Model BS-88; Huanghai Drug Testing Instrument Co., Ltd., Shanghai, China). Experiments were repeated in triplicates and the results were represented as the mean±standard deviation (SD).
Rhodamine B fluorescent Labeling of NMBGs
The study of Asati et al.36 showed that nanoparticles with a positive, neutral or negative charge brought about different localization in cells. When Rhodamine B (RhB) was chemically conjugated with NMBG particles, the charge of the particles would be changed. To prevent this, we adopted a simple adsorption method. Briefly, 0.5 g of NMBGs was immersed in 10 mL of 0.01 g Rh-B solution for 24 h while magnetically stirred at room temperature. The Rh-B-loaded materials were collected by centrifugation, washed several times with deionized water until the supernatant became clear, and then dried at 60 °C in air and stored as dry powders.
Cell Proliferation Assay of NMBGs
The proliferation of NMBGs was tested on pro-osteoblast line MC3T3-E1 Subclone 4 (CRL-2593; ATCC, Manassas, VA). MC3T3-E1 cells were cultured in α-MEM (Gibco, Invitrogen, Catalog No. A1049001) supplemented with 10% fetal bovine serum (FBS, Gibco, Invitrogen, Catalog No. 12657029). Stock solutions of NMBGs and 77 S were suspended in α-MEM without FBS at a concentration of 1.5 mg/mL. Immediately prior to their use, the samples were thoroughly homogenized by ultrasonic dispersion and then diluted. Final concentrations of the NMBGs were 50, 100 and 150 μg/mL. The cells were seeded into a 96 well plate with 3,000 cells per well and incubated at 37 °C in 5% carbon dioxide for different times (1, 3, 5 and 7 days). The cells were exposed to one of the NMBGs solutions by adding 200 μL of NMBGs solution to the monolayer of cells in each well. On day 3 and 5, the medium was replaced with 200 μL of freshly prepared medium containing NMBGs or control substances.
Cell proliferation was evaluated using the Alamar Blue assay (Invitrogen, Grand Island, NY), which is based on the detection of mitochondrial activity.12, 37 Ten microliters of Alamar Blue solution and 100 μL of α-MEM culture medium were added to each well at different time points followed by incubation for 5 h. After incubation, the plates were measured in a fluorescence reader (Thermo Scientific Varioskan Flash) with a 530 nm excitation filter and a 590 nm emission filter. The study was repeated three times and five replicates were used within each study. In situ and real time cell morphologies were acquired immediately before proliferation assay on day 1, 3, 5 and 7 using optical microscopy (Eclipsc, Nikon, Japan).
Cell Cytoskeleton Formation of NMBGs
F-actin was stained with FITC-phalloidin (AAT Bioquest, Inc.). Briefly, MC3T3-E1 cells were plated on the confocal dish and incubated with NMBGs at concentrations of 50 μg/mL and 150 μg/mL for 24 h. After incubation, cells were fixed with 4% formaldehyde and permeabilized with 0.1% Triton X-100. The dishes were then incubated at room temperature with FITC-phalloidin for 1 h. The cells were washed three times with PBS, stained for 5 min in DAPI (Beyotime) at room temperature, and washed five times with PBS again. Cells were directly visualized by confocal microscopy (LSM710, Zeiss, Germany) and representative photographs were taken.
Cell Apoptosis Assay of NMBGs
To measure apoptosis, MC3T3-E1 cells were seeded into 12-well plates at a density of 4.2×10⁴ cells/well, which is same as the cell seeding density used in proliferation study. Cells were allowed to attach for 24 h. Then the cells were exposed to 150 μg/mL NMBGs with 10% FBS for 24 h. The cells were then trypsinized, washed twice with cold phosphate buffered saline (PBS), and stained with Annexin V-PE (AN) and 7-AAD (Guava Nexin Reagent, Merck) according to the manufacturer’s protocols. 5000 cells were analyzed by flow cytometry (Merck Millipore guava). For each experiment, three replicates were performed within each study, and untreated cells served as a negative control.
Intracellular Localization of NMBGs
Cell morphology was observed by a Nova NanoSEM430 field emission scanning electron microscope (FE-SEM) (30XLFEG, Philips, The Netherlands). The cells were treated with 50 μg/mL of NMBGs for 24 h. Then the cell monolayers were washed with PBS and fixed with 2.5% glutaraldehyde (pH 7.4) for 4 h. The cells were dehydrated in a graded series of ethanol for 10 min, then critically point dried and finally gold-sputtered before FE-SEM observation.
Lysosomal Staining
After incubation with RhB-labeled particles in confocal dishes at 50 μg/mL for 24 h, the cells were incubated for 1 h with Cell Navigator™ Lysosomal Staining Kit-Blue Fluorescence (AAT Bioquest, Inc.) for labeling lysosome in a 37 °C, 5% CO2 incubator. The cells were gently washed three times using PBS to remove the extra dye molecules, and incubated in PBS for confocal imaging. Then the cells were directly observed under a Zeiss LSM710 confocal microscope with an excitation wavelength of 488 nm and a 410-nm long-pass emission filter.
For TEM analysis, the cells were treated with 50 μg/mL of NMBGs for 24 h. The cell monolayers were then dissociated using 0.25% trypsin-EDTA solution. After digestion, the cells were centrifuged into pellets and washed with PBS, then fixed in 0.1 M phosphate buffer containing 2.5% glutaraldehyde and 2% paraformaldehyde for 24 h. The samples were then fixed again with 1% osmium tetroxide for 2 h, routinely dehydrated through gradient ethanol, and embedded in epoxy resin. Resin-embedded blocks were cut into 60–80 nm ultrathin sections with an ultra-microtome. The ultrathin sections were placed on the carbon-coated nickel grids and examined with TEM (JEM-2100HR).
Statistical Analysis
Data were presented as means± SD. Analysis of variance and Tukey’s multiple comparison tests were used to determine statistical significance (p < 0.05 and p < 0.001) between groups and control (no NMBGs) using SPSS 17.0 software.
RESULTS
Characterization of NMBGs
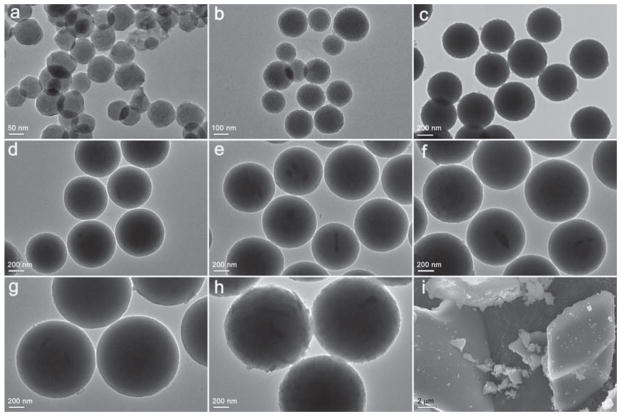
NMBGs were successfully synthesized by the modified sol–gel method using DDA as a hydrolysis catalyst.31 By changing the concentration of DDA, NMBGs with different diameters (61 nm, 174 nm, 327 nm, 484 nm, 647 nm, 743 nm, 990 nm and 1085 nm) were successfully synthesized (Figs. 1 and 2). NMBGs were nearly mono-disperse, spherical, and free of defects and macropores (Fig. 1) with a relatively narrow particle size distribution (Fig. 2). Our synthetic method solves the agglomeration problem of the conventional sol–gel BG. 77 S, the traditional BG, which was an irregular bulk material prepared by mechanical milling, was used as a control.
Figure 1.
Electron microscopic images of NMBGs. (a) Group-61 nm, (b) Group-174 nm, (c) Group-327 nm, (d) Group-484 nm, (e) Group-647 nm, (f) Group-743 nm, (g) Group-990 nm, (h) Group-1085 nm and (i) Group-77 S. (a–h) are TEM images and (i) is an SEM image. SEM was used to image Group-77 S due to its large particle size.
Figure 2.
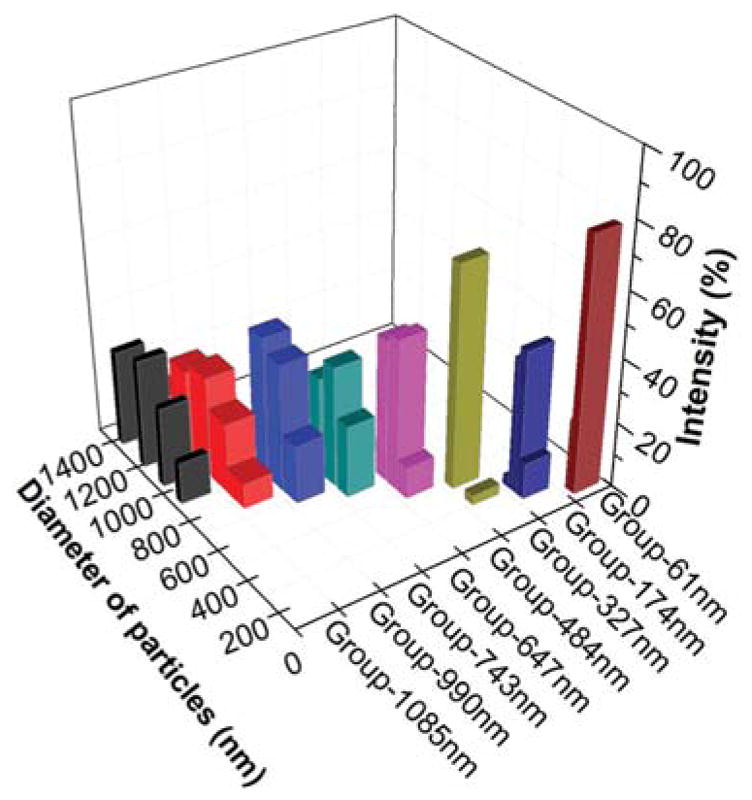
The particle size distribution of NMBGs.
ICP analysis showed that there was little difference in the concentration of Ca and P among different particles, and the detected Si concentration was inversely proportional to particle sizes (Table I). Increasing evidence in the literature indicates that ionic dissolution products from inorganic materials are important for understanding the behavior of these materials in vitro and in vivo.14, 38–40 The current in vitro studies demonstrated that ionic dissolution product from Group-484 nm had a concentration of calcium and silicon of 98.26 and 13.65 μg/mL, respectively, and was not cytotoxic (data not shown). The maximum concentrations of calcium and silicon in NMBGs were lower than these values (Table I). Therefore, the cytotoxicity of NMBGs was not caused by the ionic dissolution.
It was also observed that the zeta potential was dependent on the particle sizes. The smaller particles were more negatively charged (Table I). Zeta potentials affected the dispersion of nanoparticles, and there was no direct correlation between the negative zeta potential (ranging from −49.1 to −10.6 mV) and cytotoxicity.41 Hence, we speculate that the cell toxicity did not result from the zeta potentials of dispersive NMBGs ranging from −12.3 to −23.8 mV (Table I). The osmolality of the control medium (normal α-MEM) was 320.0±12.3 mOsm/kg. However, the osmolality results of all NMBGs showed no significant difference when compared to the negative control of the medium only (Table I). Thus it is highly possible that cell cytotoxicity is mainly regulated by the sizes and concentrations of NMBGs in this study.
Cell Proliferation
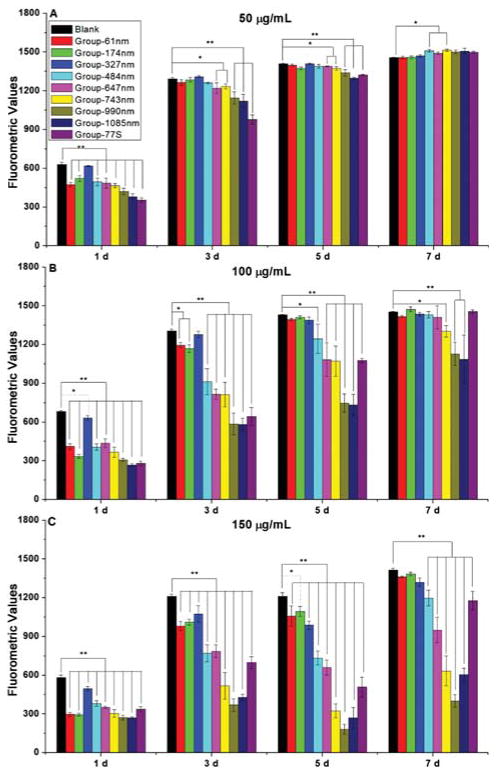
The NMBGs were administered to cells each time the media was changed. In this case, a pulse-chase experiment was performed, allowing us to study the cumulative toxicity of cells. This design mimics the long-term cumulative toxicity of NMBGs expected under in vivo situation. We used Alamar blue assay on MC3T3-E1 cells to test the cell proliferation under different sizes and doses of the NMBGs. The groups of smaller sizes (Group-61 nm and Group-174 nm) showed more cytotoxicity than Group-327 nm at earlier time points at three concentrations (50, 100 and 150 μg/mL) studied (Fig. 3). However, they were nontoxic after day 3 at 50 μg/mL, day 5 at 100 μg/mL and day 7 at 150 μg/mL.
Figure 3.
Alamar blue cell proliferation assay of NMBGs at different concentrations. (A) 50 μg/mL. (B) 100 μg/mL. (C) 150 μg/mL. *:p < 0.05, **:p < 0.001.
As for the groups with a size over 327 nm, the Alamar blue assay on MC3T3-E1 cells (Fig. 3) showed a trend that cytotoxicity was positively correlated with the particle size and concentration; the larger particles at the higher concentrations resulted in higher cytotoxicity (Fig. 3). At 50 μg/mL, the proliferation of MC3T3-E1 cells decreased significantly (p < 0.001) except for Group-327 nm on day 1. The cytotoxicity was gradually decreased at the subsequent time points. On day 3 and day 5, groups with a size over 647 nm inhibited cell proliferation with a statistical significance (p < 0.05 and p < 0.001). On day 7, cell activity of all groups was recovered on day 7. The proliferation at both 100 and 150 μg/mL of NMBGs was similar to that at 50 μg/mL but with more cytotoxicity, showing a dose-dependent pattern.42 There was statistically significant difference (p < 0.001) at the concentration of 100 μg/mL on days 1, 3 and 5 for the diameter over 484 nm. On day 7, only Group-743 nm, Group-990 nm and Group-1085 nm still inhibited cell proliferation. However, at 150 μg/mL, the groups with a size over 327 nm inhibited cell proliferation (p < 0.001) at 150 μg/mL at all time points except for Group-327 nm on day 7.
On the whole, we found that cell proliferation showed a general tendency of size- and concentration-dependency in all groups, especially at a higher concentration and later time points (100 and 150 μg/mL on day 5 and 7). Surprisingly, we also forund that the cell viability recovered over time.
Cell Morphology
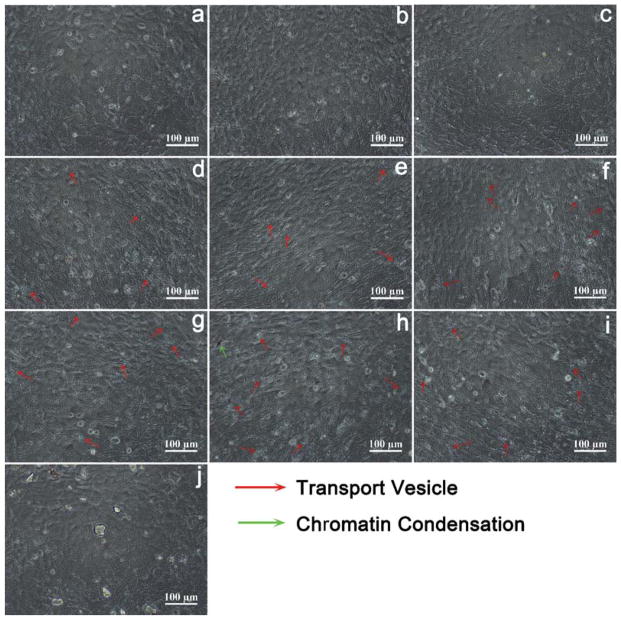
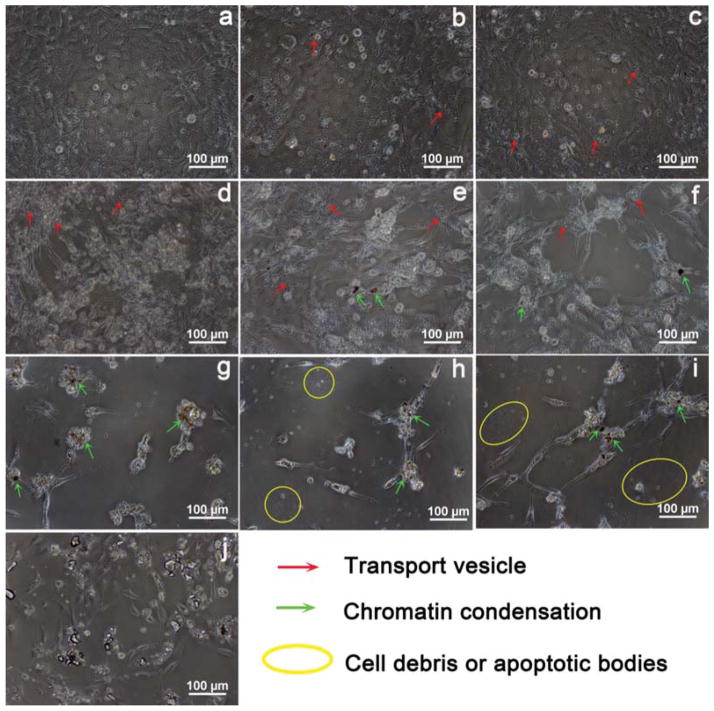
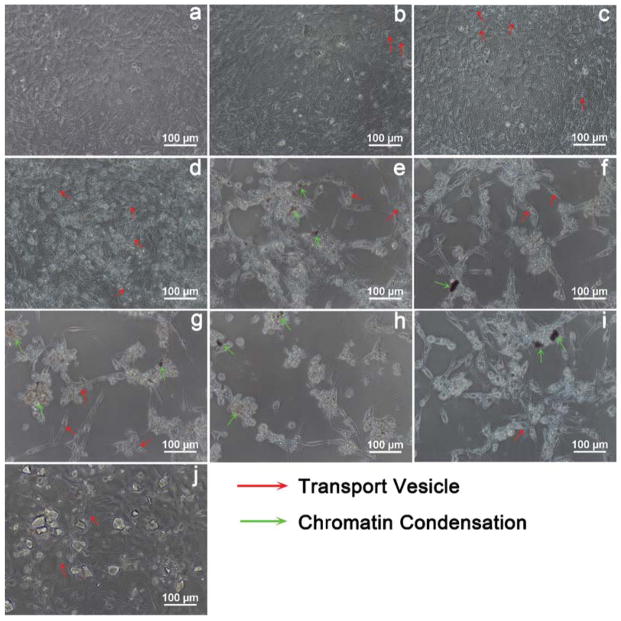
Morphological changes of MC3T3-E1 cells exposed to 50 μg/mL NMBGs for 7 days were observed (Fig. 4). At 50 μg/mL, the cell morphology changed little, and only a small amount of endocytosis vesicles was observed (Fig. 4). At 150 μg/mL, in contrast to the smaller particles (Groups-61 nm, 174 nm, 327 nm), the larger particles tended to result in more apoptosis, reflected by more cell volume reduction, nuclear condensation, cytoplasmic vacuoles, cell shrinkage, and formation of apoptotic bodies or cellular debris (Fig. 6). The extent of morphological changes at 100 μg/mL (Fig. 5) was similar but smaller than that at 150 μg/mL (Fig. 6). These results show that the morphological changes of MC3T3-E1 cells were also size- and dose-dependent (Figs. 4, 5 and 6). We believe that morphological changes of the cells in response to the change of the particle size and concentration arise from the uptake of the particles.22 This can be confirmed by a comparison between NMBGs and Group-77 S. The particles of Group-77 S were found to adhere to the surface of the cells, because they were too large to be internalized. Consequently, the cell morphology of Group-77 S changed little.
Figure 4.
Particles with the concentration of 50 μg/mL induced the apoptotic morphology of MC3T3-E1 cells as revealed by light microscopy, (a) blank, (b) Group-61 nm, (c) Group-174 nm, (d) Group-327 nm, (e) Group-484 nm, (f) Group-647 nm, (g) Group-743 nm, (h) Group-990 nm, (i) Group-1085 nm and (j) Group-77 S. The groups shown in (e–i) induced the formation of transport vesicles.
Figure 6.
Light microscopy morphology of apoptotic MC3T3-E1 cells induced by particles at the concentration of 150 μg/mL. (a) Blank, (b) Group-61 nm, (c) Group-174 nm, (d) Group-327 nm, (e) Group-484 nm, (f) Group-647 nm, (g) Group-743 nm, (h) Group-990 nm, (i) Group-1085 nm and (j) Group-77 S. The groups shown in (e–i) induced apoptotic morphology with features such as filopodia formation, chromatin condensation and formation of apoptotic bodies.
Figure 5.
The concentration of 100 μg/mL particles induced apoptotic morphology in MC3T3-E1 cells as revealed by light microscopy, (a) blank, (b) Group-61 nm, (c) Group-174 nm, (d) Group-327 nm, (e) Group-484 nm, (f) Group-647 nm, (g) Group-743 nm, (h) Group-990 nm, (i) Group-1085 nm and (j) Group-77 S. The groups shown in (e–i) induced apoptotic morphology with features such as filopodia formation and chromatin condensation.
Cell Cytoskeleton
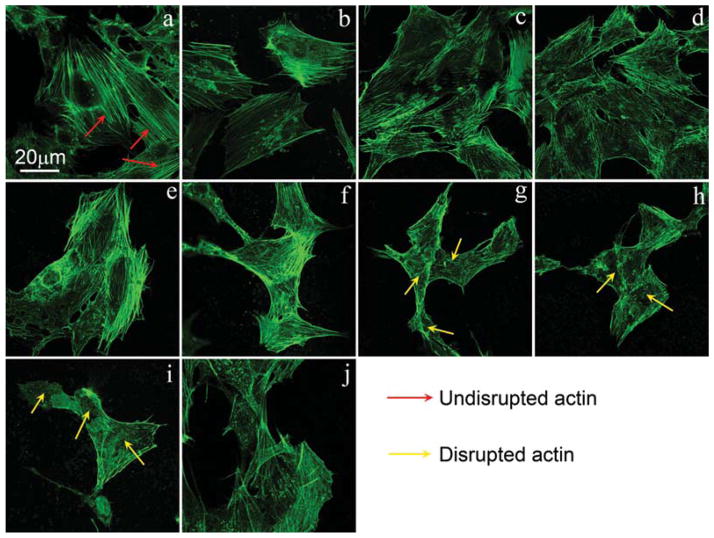
The F-actin cytoskeleton has an important effect on cell morphology. Hence, to understand the above morphological change better, the cytoskeleton organization was monitored for different groups. After MC3T3-E1 cells were incubated with 50 μg/mL NMBGs for 24 h, the ability of the cell microfilament movement was determined (Fig. 7). The result showed that the uptake of NMBGs affected the actin cytoskeleton. In the control experiment (Blank), F-actin cytoskeleton appeared to be well organized with defined microfilaments organized into thick bundles around the cell periphery. The groups with smaller particles (Figs. 7(b–f)) are mostly similar to control experiment. MC3T3-E1 cells with internalized larger particles (743 nm, 990 nm and 1085 nm) displayed diffused staining of the F-actin microfilaments and shrinking of the cell membrane (Figs. 7(g–i)). In above three groups, the size of the particles and the transport vesicles and the total volume they occupy would increase accordingly, which would affect the F-actin microfilaments, as the large particles and the transport vesicles might sterically hinder the normal localization of the actin fibers and lead to the disruption and remodeling of the actin cytoskeleton.12, 43–46 Figure 8 showed the effect of the concentrations of Group-647 nm on the cell microfilaments. Compared with 50 μg/mL, the F-actin cytoskeleton was subjected to greater damage or poorer formation at 150 μg/mL, showing a dose-dependent pattern. These results show that the larger particle sizes and higher concentrations resulted in greater damage or poorer formation of the microfilaments.
Figure 7.
Confocal microscopy image showing that cellular uptake of NMBGs disrupted F-actin cytoskeleton. Cells were fluorescently stained for cytoskeletal F-actin fibers (green) after treatment without (a) or with particles of different sizes including (b) 61 nm, (c) 174 nm, (d) 327 nm, (e) 484 nm, (f) 647 nm, (g) 743 nm, (h) 990 nm, (i) 1085 nm and (j) Group 77 S. All particles were at the concentration of 50 μg/mL and treatment time was 24 h.
Figure 8.
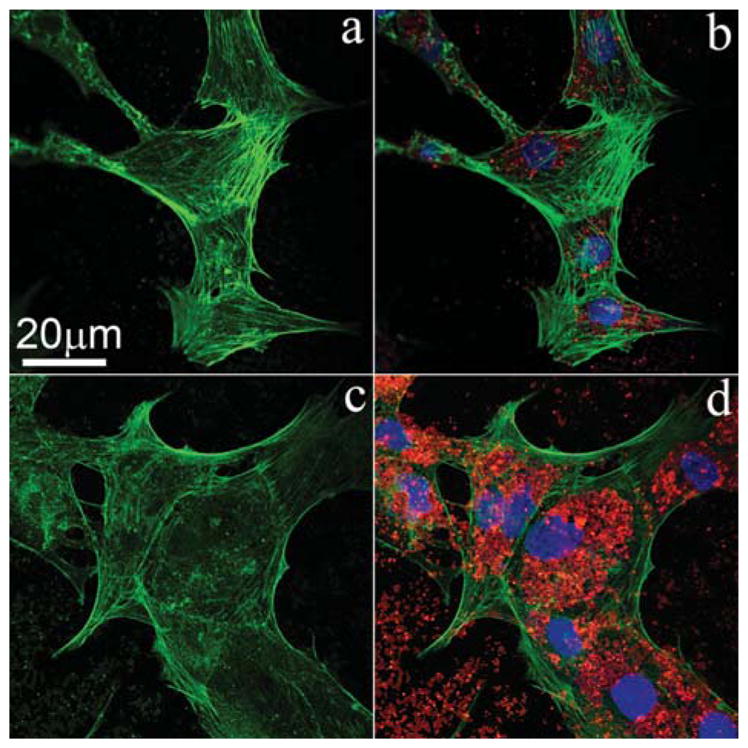
Confocal image showing that the cellular uptake of NMBGs resulted in disrupted and less organized F-actin cytoskeleton. Cells were fluorescently stained for cytoskeletal F-actin fibers (green) after treatment with 647 nm-group (red) at the concentration of 50 μg/mL (a, b) and 150 μg/mL (c, d) for 24 h.
Cell Apoptosis
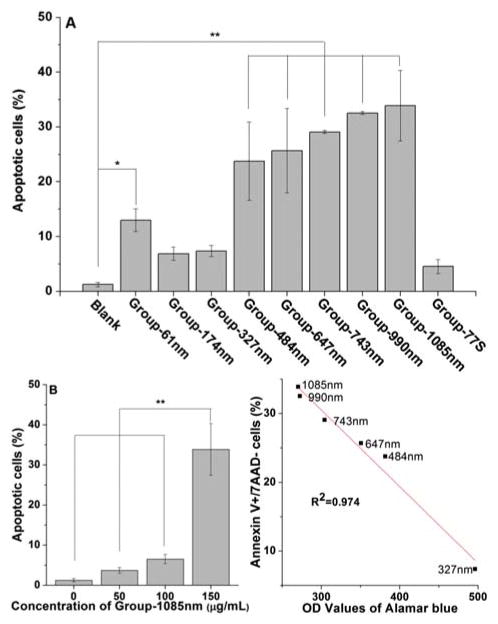
Apoptosis of MC3T3-E1 cells exposed to NMBGs for 24 h was quantified by flow-cytometry (Fig. 9). Apoptotic cells were stained with Annexin V and non-viable cells with 7AAD. Three populations of AN−/ 7AAD−, AN+/7AAD−, and AN+/7AAD+ are considered corresponding to live cells, early apoptotic cells, and late apoptotic/ necrotic cells, respectively,47 enabling us to quantify these cells. There was a small fraction of late apoptotic or necrotic cells, so the early and late apoptosis data were combined in the analysis. Apoptosis data for different sizes at 150 μg/mL was shown in Figure 9(A). Among the groups with smaller sizes (Groups-61 nm, 174 nm and 327 nm), the number of apoptotic cells decreased as the diameters increased. However, the apoptotic cells among the groups with a size over 327 nm increased with the increase in the size. The linear correlation between apoptosis and Alamar blue assay showed an inverse correlation (R2 = 0.974, Fig. 9(C)) for NMBGs over 327 nm, suggesting that early apoptosis induced by sizes over 327 nm was related to the cell mitochondrial activity. Because the extent of the apoptosis induced by Group-1085 nm was the largest (Fig. 9(A)), we chose this group to examine the effect of NMBGs concentrations on the apoptosis (Fig. 9(B)). As the concentration increased, the percentage of apoptotic and necrotic cells increased gradually. The concentration of 150 μg/mL caused an average of 27-, 9- and 5- fold increase in the number of apoptotic and necrotic cells compared to that of 0, 50 and 100 μg/mL, respectively. However, the number of apoptotic and non-viable cells at 50 and 100 μg/mL were not significantly different from that at 0 μg/mL.
Figure 9.
Apoptosis ratio in MC3T3-E1 cells induced by NMBGs. (A) Cells were cultured with NMBGs at the concentration of 150 μg/mL for 24 h and detected by flow cytometry. Bar graphs represent the percentage of AnnexinV+/7AAD-cells. All data in bar graph A are depicted as mean±SD, with *p < 0.05 and **p < 0.001 versus controls. (B) cells were incubated with Group-1085 nm at the concentrations of 50, 100, and 150 μg/mL for 24 h. **p < 0.001, 150 μg/mL compared to the control, 50 μg/mL and 100 μg/mL of 1085 nm-NMBG (n = 3). (C) Correlation between the apoptosis and Alamar blue in Groups of 327 nm to 1085 nm at 150 μg/mL, which was generated from data shown in Figures 3(C) and 9(A).
NMBGs Uptake Observed by SEM
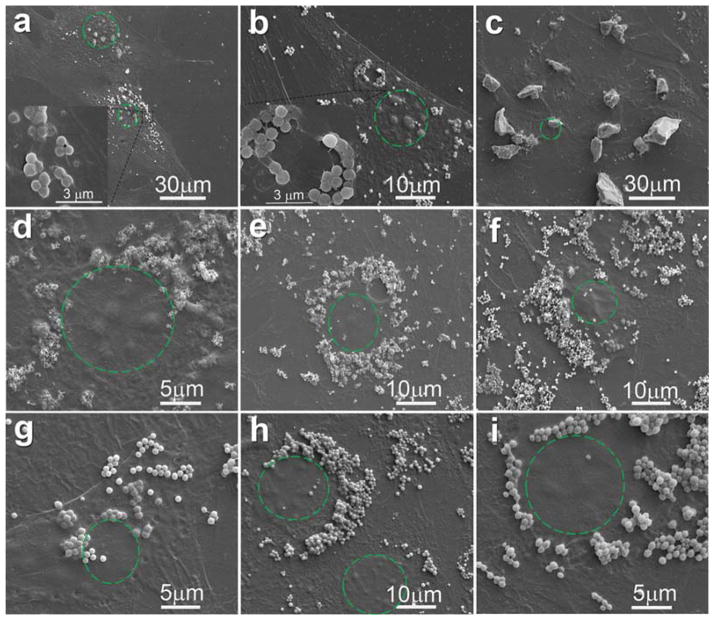
MC3T3-E1 cells were cultured with 50 μg/mL NMBGs for one day and the cell-particle interaction was subjected to SEM investigation (Fig. 10). The SEM images revealed a similar appearance of cells in all groups; no obvious difference in cell morphology and membranes were found. A large number of particles, which were attached to the cell membranes, either alone or in clusters, were initially seen at the perinuclear cell surface.42 Some of the particles were internalized by the cell membrane (Figs. 10(a, b)), whereas the dorsal membrane above the cell nucleus was smooth. Additionally, as the concentrations of NMBGs were increased, the amount of particles attached to the cell surface was also increased. However, the particles would not adhere to the top membrane above the cell nucleus, which was also observed by the confocal 3D image (Fig. 11). 3D imaging showed that even for Group-174 nm (Fig. 11), although there were particles adhered to the cell membrane above the nucleus, they could not be completely phagocytized into the cells. Because the size of Group-77 S was too large to be internalized, the particles were found almost only on the surface of the cell membranes (Fig. 10(c)). In addition, the larger particles (over 61 nm and 174 nm) in the position above the nucleus (Fig. 14, Step 1, A region) were only adhered to the cell surface instead of being phagocytized (Fig. 10(g–i)).
Figure 10.
SEM images showing the uptake of NMBGs at the concentration of 50 μg/mL ((a) Group-327 nm, (b) Group-743 nm, (c) Group-77 S) and at the concentration of 150 μg/mL ((d) Group-174 nm, (e) Group-484 nm, (f) Group-647 nm, (g) Group-743 nm, (h) Group-990 nm, (i) Group-1085 nm) after in vitro culture for 24 h. The green dotted circles indicate the position of cell nucleus.
Figure 11.
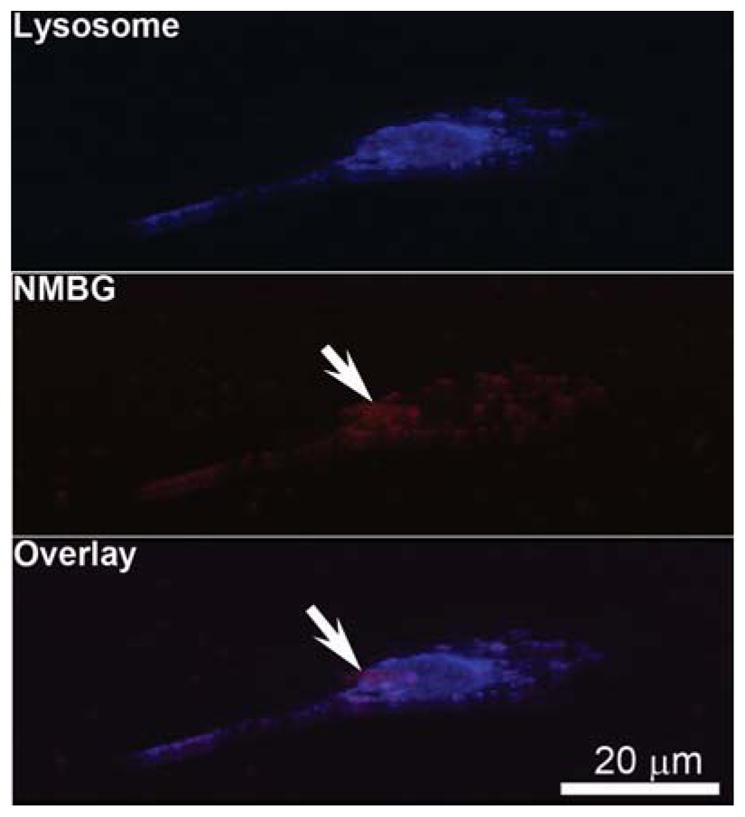
3D confocal images of the cells after uptaking Group-174 nm with the concentration of 50 μg/mL.
Figure 14.
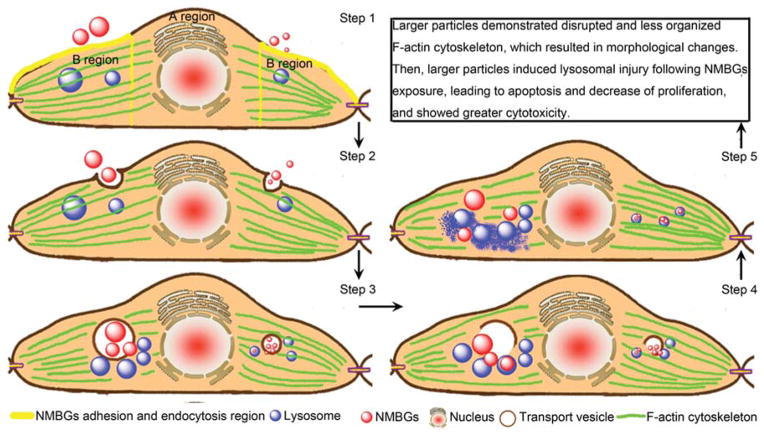
Schematic illustration of the possible mechanism of NMBGs internalization in cells and the resultant cytotoxicity. The larger and smaller particles are shown on the left and right of the cell, respectively. In the first step, NMBGs are adsorbed on the perinuclear membrane of the cells. In the second step, transport vesicles serve as the major carrier of the internalized NMBGs for phagocytosis. In the third step, the internalized NMBGs carried by the transport vesicles induce the disruption and disorganization of F-actin cytoskeleton, which leads to the morphological changes. In the fourth step, the transport vesicles are broken and the particles come out of the broken vacuoles. Lastly, the smaller particles are encapsulated into the lysosomes and retained in the lysosomes; the larger particles may escape from the lysosomes and cause lysosomal damage, which will induce cell apoptosis.
NMBGs Uptake Observed by Confocal Microscopy
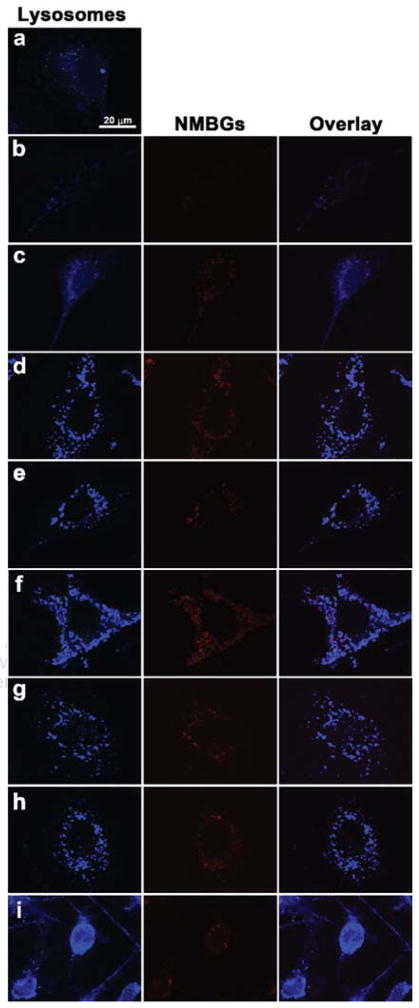
We probed the intracellular fate of NMBGs labeled by a red dye (Rhodamine) using confocal microscopy. Herein, to confirm whether the labeled-NMBGs were localized in the endosomal compartments after internalization, we treated the cells with Lysotracker, a lysosome-specific blue dye.48, 49 The internalized red dye-labeled NMBGs were visible due to their red fluorescence in the cells. Hence, the potential colocalization between the NMBGs and lysosomes, which are labeled with red and blue dye, respectively, should yield a fuchsia/purple overlap when the images are merged. The results showed that NMBGs were colocalized with Lysosomes in the MC3T3-E1 cells, indicating lysosomal localization of NMBGs (Fig. 12). Interestingly, in the case of MC3T3-E1 cells, as the NMBG sizes were increased, intracellular lysosomes tended to increase, especially for the case of Group-1085 nm (Fig. 12). Even though only seven particles were uptaken into the cell, the lysosomes were already full.
Figure 12.
Confocal microscopy images of MC3T3-E1 cells uptaking NMBGs for 24 h. (a) Blank, (b) Group-61 nm, (c) Group-174 nm, (d) Group-327 nm, (e) Group-484 nm, (f) Group-647 nm, (g) Group-743 nm, (h) Group-990 nm, (i) Group-1085 nm and (j) Group-77 S. Upon internalization, NMBGs colocalized with the lysosomes.
NMBGs Uptake Observed by TEM
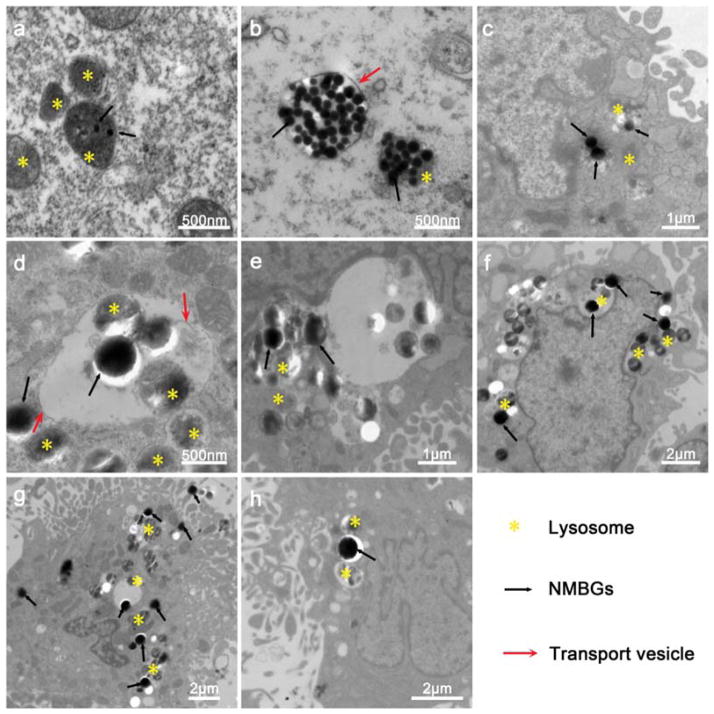
In MC3T3-E1 cells, numerous lysosomes are clustered around the phagosomes, which contain the NMBGs particles in three-dimensional (3D) space, so confocal microscopy shows the 3D information. TEM images from a cross-sectioned cell layer will reveal more accurate information and represent 2D information. Thus, for further confirmation, the cellular trafficking information was obtained using TEM. The cells were incubated with 50 μg/mL of mono-NMBGs for 24 h (Fig. 13). NMBGs with all different sizes were taken up by the MC3T3-E1 cells (Fig. 13). Rejman et al.50 reported that the murine melanoma cell line B16-F10 took up particles up to a size of 500 nm, and no uptake was seen with particles of 1 μm in size. However, in this work, particles with a diameter of 1085 nm could be uptaken by non-professional endocytosing cells easily, which challenged the conventional views that large-sized particles could not be uptaken by non-phagocytic cells.51 There was no evidence of NMBGs in the nucleus after incubation for 24 h, but they were found to be encapsulated into the lysosomes or intracytoplasmic vacuoles or cytosolic compartments. In all groups, only groups with smaller sizes, Group-61 nm and Group-174 nm, were found retained in the lysosomes (Figs. 13(a and b)), whereas in the other groups with larger sizes, the lysosomes were found around the particles (Figs. 13(c–h)).
Figure 13.
TEM images depicting the intracellular trafficking of different NMBGs at the concentration of 50 μg/mL in MC3T3-E1 cells after 24 h incubation. (a) Group-61 nm, (b) Group-174 nm, (c) Group-327 nm, (d) Group-484 nm, (e) Group-647 nm, (f) Group-743 nm, (g) Group-990 nm, (h) Group-1085 nm.
DISCUSSION
According to the SEM (Fig. 10), confocal (Figs. 7, 11 and 12) and TEM (Fig. 13) imaging results, we propose a five-step mechanism to understand the process of the endocytosis and cellular localization of NMBGs as well as their eventual cytotoxicity (Fig. 14). As the first step, NMBGs are adsorbed on the special cellular membrane area, the perinuclear membrane of the cells (Fig. 14, Step 1, B region), followed by endocytosis and internalization of NMBGs (Fig. 14, Step 2). Even though the concentrations of NMBGs are increased, the adhered position of NMBGs are not changed. Second, transport vesicles serve as the major carrier of internalized NMBGs for phagocytosis. The size of the transport vesicles is generally several times larger than that of the nanoparticles. However, there is no enough space for larger particles to transport above the nuclear region (Fig. 14, Step 1, A region).50, 52 Thus it is possible that the size of particles that could be transported is restricted by the cell size and the intracellular space.
In the third step, the internalized NMBGs carried by the transport vesicles induce the disruption and disorganization of F-actin cytoskeleton, which leads to the morphological changes. The larger particles and higher concentrations affected the cell morphology and cytoskeleton changes to a larger degree compared to the smaller particles and lower concentrations. Recent studies have manifested that the endocytic machinery is directly connected and functionally integrated with the actin cytoskeleton.50, 53–55
In the fourth step (Fig. 14, Step 4), the transport vesicles are broken and the particles come out of the broken vacuoles. Previous studies on the endocytosis of the silica and conventional BGs in various cells12, 20, 27, 41, 55, 56 show that the particles are localized inside the intracytoplasmic vacuoles or endosomes, or randomly in the cytoplasm. However, our work revealed a new uptake route for NMBGs with smaller sizes. The groups with smaller sizes (Group-61 nm and Group-174 nm) were found to be phagocytized by lysosomes (Figs. 13(a, b)), indicating that smaller particles (61 nm and 174 nm) could be largely sequestered in degradative vesicles of the endo-lysosomal pathway. That is one of the possible reasons why they became nontoxic at the later time points and the cell viability recovered over time (Fig. 3).
In contrast, other NMBG groups with larger particles were mostly localized to membranous bodies within intracytoplasmic vacuoles or randomly in the cytoplasm (Figs. 13(c–h)), but were closely associated with lysosomes. Calcium ions could influence cellular processes after cell entry such as improving transfection complexes to escape from the lysosomes and release into the cytosol.57, 58 Thus we suggest that the larger particles will escape from the endosome into the cytoplasm. Therefore, as the fifth step (Fig. 14, Step 5), we believe that the larger particles (over 174 nm) may escape from the lysosomes and cause lysosomal damage, which will induce cell apoptosis.22 It can be seen from the confocal lysosomal staining that phagocytized larger particles strikingly increased the numbers of lysosomes inside the cells (Fig. 12). Previous studies have shown that after the endocytosis of polyethyleneimine (PEI)/DNA particles, lysosomes swelled and ruptured, representing an escape mechanism for the PEI/DNA particles.59 It is widely accepted that silica-induced cytotoxicity is due, in part, to the disruption of phagolysosomal membrane integrity. After phagocytosis of silica, reactive particle surfaces may interact with phagolysosomal membranes, leading to the release of lysosomal enzymes into the cytosol and the subsequent cell death.22 Therefore, according to the confocal and TEM imaging results, we speculate that larger NMBG-particles may induce lysosomal swelling and rupture, and then escape from the lysosomes. The escape process damages lysosomes, triggering greater cytotoxicity.
In short, NMBGs, either smaller or larger, are adsorbed and internalized on the perinuclear cellular membrane. After internalization, larger particles will disrupt the organization of F-actin cytoskeleton, which results in morphological changes. Then, larger particles induce lysosomal injury, leading to apoptosis and decrease of proliferation. On the other hand, smaller NMBGs (61 nm and 174 nm), once internalized, are localized in lysosomes, resulting in little cytotoxicity. Hence, the smaller NMBGs could be used as the vaccine adjuvants, whereas larger particles (327 nm) are likely to be ideal carriers for proteins and peptide drugs as they can escape from lysosomes.60 The internalization mechanisms and intracellular locations of particles revealed in this study could help the future exploration of the NMBGs in new biomedical applications such as serving as vaccine adjuvants.
CONCLUSIONS
Mono-disperse, spherical NMBGs with various particle sizes (61 nm, 174 nm, 327 nm, 484 nm, 647 nm, 743 nm, 990 nm, 1085 nm) were successfully synthesized by using DDA as a catalyst and template in the sol–gel method. The present study systematically investigates the effects of particle sizes and doses of NMBGs on the cellular behavior. Size- and dose-dependent cytotoxicity was revealed. Larger particles (over 174 nm) with higher concentrations (over 100 μg/mL) resulted in greater cytotoxicity. A size-dependent mechanism of intracellular localization is proposed to explain the size-dependent cytotoxicity. Briefly, NMBGs could pass through the cell membrane above the periphery of the cells. After internalization, smaller NMBGs (61 nm and 174 nm) were phagocytized by lysosomes and thus resulted in little cytotoxicity. However, NMBGs larger than 174 nm appeared to localize inside the intracytoplasmic vacuoles or randomly in the cytoplasm. These larger particles might escape from the lysosomes, causing lysosomal damage and consequently inducing cell apoptosis. Our work shows NMBGs with a smaller size (61–327 nm) at a lower dose (below 100 μg/mL) are less cytotoxic and can find potential biomedical applications such as bone tissue engineering scaffolds and gene or drug delivery carriers.
Acknowledgments
This work was supported by the National 973 project of China (2011CB606204), National Natural Science Foundation of China (Grant nos. 51172073 and 51202069) and the Fundamental Research Funds for the Central University (2012ZP0001). YZ and CBM would like to thank the financial support from National Institutes of Health, National Science Foundation (CMMI-1234957 and CBET-1512664), Department of Defense office of the Congressionally Directed Medical Research Programs (W81XWH-15-1-0180), Oklahoma Center for Adult Stem Cell Research (434003) and Oklahoma Center for the Advancement of Science and Technology (HR14-160).
References
- 1.Hench L, Polak J. Third-generation biomedical materials. Science. 2002;295:1014. doi: 10.1126/science.1067404. [DOI] [PubMed] [Google Scholar]
- 2.Ostomel TA, Shi Q, Tsung CK, Liang H, Stucky GD. Spherical bioactive glass with enhanced rates of hydroxyapatite deposition and hemostatic activity. Small. 2006;2:1261. doi: 10.1002/smll.200600177. [DOI] [PubMed] [Google Scholar]
- 3.Labbaf S, Tsigkou O, Müller KH, Stevens MM, Porter AE, Jones JR. Spherical bioactive glass particles and their interaction with human mesenchymal stem cells in vitro. Biomaterials. 2011;32:1010. doi: 10.1016/j.biomaterials.2010.08.082. [DOI] [PubMed] [Google Scholar]
- 4.Cho JS, Kang YC. Synthesis of spherical shape borate-based bioactive glass powders prepared by ultrasonic spray pyrolysis. Ceram Int. 2009;35:2103. [Google Scholar]
- 5.Mortazavi V, Nahrkhalaji MM, Fathi M, Mousavi S, Esfahani BN. Antibacterial effects of sol–gel-derived bioactive glass nanoparticle on aerobic bacteria. J Biomed Mater Res A. 2010;94:160. doi: 10.1002/jbm.a.32678. [DOI] [PubMed] [Google Scholar]
- 6.Lei B, Shin KH, Noh DY, Koh YH, Choi WY, Kim HE. Bioactive glass microspheres as reinforcement for improving the mechanical properties and biological performance of poly(ε-caprolactone) polymer for bone tissue regeneration. J Biomed Mater Res B. 2012;100:967. doi: 10.1002/jbm.b.32659. [DOI] [PubMed] [Google Scholar]
- 7.Misra SK, Mohn D, Brunner TJ, Stark WJ, Philip SE, Roy I, Salih V, Knowles JC, Boccaccini AR. Comparison of nanoscale and microscale bioactive glass on the properties of P (3HB)/Bioglass® composites. Biomaterials. 2008;29:1750. doi: 10.1016/j.biomaterials.2007.12.040. [DOI] [PubMed] [Google Scholar]
- 8.Vollenweider M, Brunner TJ, Knecht S, Grass RN, Zehnder M, Imfeld T, Stark WJ. Remineralization of human dentin using ultrafine bioactive glass particles. Acta Biomater. 2007;3:936. doi: 10.1016/j.actbio.2007.04.003. [DOI] [PubMed] [Google Scholar]
- 9.Mota J, Yu N, Caridade SG, Luz GM, Gomes ME, Reis RL, Jansen JA, Walboomers XF, Mano JF. Chitosan/bioactive glass nanoparticle composite membranes for periodontal regeneration. Acta Biomater. 2012;8:4173. doi: 10.1016/j.actbio.2012.06.040. [DOI] [PubMed] [Google Scholar]
- 10.Slowing II, Vivero-Escoto JL, Wu CW, Lin VSY. Mesoporous silica nanoparticles as controlled release drug delivery and gene transfection carriers. Adv Drug Deliv Rev. 2008;60:1278. doi: 10.1016/j.addr.2008.03.012. [DOI] [PubMed] [Google Scholar]
- 11.Li X, Chen X, Miao G, Liu H, Mao C, Yuan G, Liang Q, Shen X, Ning C, Fu X. Synthesis of radial mesoporous bioactive glass particles to deliver osteoactivin gene. J Mater Chem B. 2014;2:7045. doi: 10.1039/c4tb00883a. [DOI] [PubMed] [Google Scholar]
- 12.Tsigkou O, Labbaf S, Stevens MM, Porter AE, Jones JR. Monodispersed bioactive glass submicron particles and their effect on bone marrow and adipose tissue-derived stem cells. Adv Healthcare Mater. 2014;3:115. doi: 10.1002/adhm.201300126. [DOI] [PubMed] [Google Scholar]
- 13.Motskin M, Wright D, Muller K, Kyle N, Gard T, Porter A, Skepper J. Hydroxyapatite nano and microparticles: Correlation of particle properties with cytotoxicity and biostability. Biomaterials. 2009;30:3307. doi: 10.1016/j.biomaterials.2009.02.044. [DOI] [PubMed] [Google Scholar]
- 14.Hench L. Genetic design of bioactive glass. J Europ Ceram Soc. 2009;29:1257. [Google Scholar]
- 15.Hench LL. Stimulation of bone repair by gene activating glasses. Key Eng Mat. 2004;254–256:3. [Google Scholar]
- 16.Jell G, Stevens M. Gene activation by bioactive glasses. J Mater Sci Mater Med. 2006;17:997. doi: 10.1007/s10856-006-0435-9. [DOI] [PubMed] [Google Scholar]
- 17.Setyawati M, Tay CY, Chia S, Goh S, Fang W, Neo M, Chong HC, Tan S, Loo SCJ, Ng K. Titanium dioxide nanomaterials cause endothelial cell leakiness by disrupting the homophilic interaction of VE–cadherin. Nat Commun. 2013;4:1673. doi: 10.1038/ncomms2655. [DOI] [PubMed] [Google Scholar]
- 18.Murdock RC, Braydich-Stolle L, Schrand AM, Schlager JJ, Hussain SM. Characterization of nanomaterial dispersion in solution prior to in vitro exposure using dynamic light scattering technique. Toxicol Sci. 2008;101:239. doi: 10.1093/toxsci/kfm240. [DOI] [PubMed] [Google Scholar]
- 19.Warheit DB. How meaningful are the results of nanotoxicity studies in the absence of adequate material characterization? Toxicol Sci. 2008;101:183. doi: 10.1093/toxsci/kfm279. [DOI] [PubMed] [Google Scholar]
- 20.Napierska D, Thomassen LCJ, Rabolli V, Lison D, Gonzalez L, Kirsch-Volders M, Martens JA, Hoet PH. Size-dependent cytotoxicity of monodisperse silica nanoparticles in human endothelial cells. Small. 2009;5:846. doi: 10.1002/smll.200800461. [DOI] [PubMed] [Google Scholar]
- 21.Lei B, Chen X, Han X, Zhou J. Versatile fabrication of nanoscale sol–gel bioactive glass particles for efficient bone tissue regeneration. J Mater Chem. 2012;22:16906. [Google Scholar]
- 22.Thibodeau MS, Giardina C, Knecht DA, Helble J, Hubbard AK. Silica-induced apoptosis in mouse alveolar macrophages is initiated by lysosomal enzyme activity. Toxicol Sci. 2004;80:34. doi: 10.1093/toxsci/kfh121. [DOI] [PubMed] [Google Scholar]
- 23.Duan J, Yu Y, Li Y, Yu Y, Sun Z. Cardiovascular toxicity evaluation of silica nanoparticles in endothelial cells and zebrafish model. Biomaterials. 2013;34:5853. doi: 10.1016/j.biomaterials.2013.04.032. [DOI] [PubMed] [Google Scholar]
- 24.Tao Z, Toms B, Goodisman J, Asefa T. Mesoporous silica microparticles enhance the cytotoxicity of anticancer platinum drugs. ACS Nano. 2010;4:789. doi: 10.1021/nn9015345. [DOI] [PubMed] [Google Scholar]
- 25.Qiu P, Mao C. Biomimetic branched hollow fibers templated by self-assembled fibrous polyvinylpyrrolidone structures in aqueous solution. ACS Nano. 2010;4:1573. doi: 10.1021/nn9009196. [DOI] [PMC free article] [PubMed] [Google Scholar]
- 26.Qiu P, Qu X, Brackett DJ, Lerner MR, Li D, Mao C. Silica-based branched hollow microfibers as a biomimetic extracellular matrix for promoting tumor cell growth in vitro and in vivo. Adv Mater. 2013;25:2492. doi: 10.1002/adma.201204472. [DOI] [PMC free article] [PubMed] [Google Scholar]
- 27.Yu KO, Grabinski CM, Schrand AM, Murdock RC, Wang W, Gu B, Schlager JJ, Hussain SM. Toxicity of amorphous silica nanoparticles in mouse keratinocytes. J Nanopart Res. 2009;11:15. [Google Scholar]
- 28.He Q, Zhang Z, Gao Y, Shi J, Li Y. Intracellular localization and cytotoxicity of spherical mesoporous silica nano- and microparticles. Small. 2009;5:2722. doi: 10.1002/smll.200900923. [DOI] [PubMed] [Google Scholar]
- 29.Vallhov H, Gabrielsson S, Strømme M, Scheynius A, Garcia-Bennett AE. Mesoporous silica particles induce size dependent effects on human dendritic cells. Nano Lett. 2007;7:3576. doi: 10.1021/nl0714785. [DOI] [PubMed] [Google Scholar]
- 30.Pereira MM, Clark AE, Hench LL. Effect of texture on the rate of hydroxyapatite formation on gel-silica surface. J Am Ceram Soc. 1995;78:2463. [Google Scholar]
- 31.Hu Q, Chen X, Zhao N, Li Y. Facile synthesis and in vitro bioactivity of monodispersed mesoporous bioactive glass sub-micron spheres. Mater Lett. 2013;106:452. [Google Scholar]
- 32.Bosetti M, Cannas M. The effect of bioactive glasses on bone marrow stromal cells differentiation. Biomaterials. 2005;26:3873. doi: 10.1016/j.biomaterials.2004.09.059. [DOI] [PubMed] [Google Scholar]
- 33.Hu Q, Li Y, Miao G, Zhao N, Chen X. Size control and biological properties of monodispersed mesoporous bioactive glass sub-micron spheres. RSC Adv. 2014;4:22678. [Google Scholar]
- 34.Li R, Clark A, Hench L. An investigation of bioactive glass powders by sol–gel processing. J Appl Biomater. 1991;2:231. doi: 10.1002/jab.770020403. [DOI] [PubMed] [Google Scholar]
- 35.Chen X, Meng Y, Li Y, Zhao N. Investigation on biomineralization of melt and sol–gel derived bioactive glasses. Appl Surf Sci. 2008;255:562. [Google Scholar]
- 36.Asati A, Santra S, Kaittanis C, Perez JM. Surface-charge-dependent cell localization and cytotoxicity of cerium oxide nanoparticles. ACS Nano. 2010;4:5321. doi: 10.1021/nn100816s. [DOI] [PMC free article] [PubMed] [Google Scholar]
- 37.Hamid R, Rotshteyn Y, Rabadi L, Parikh R, Bullock P. Comparison of alamar blue and MTT assays for high through-put screening. Toxicol In Vitro. 2004;18:703. doi: 10.1016/j.tiv.2004.03.012. [DOI] [PubMed] [Google Scholar]
- 38.Hoppe A, Guldal NS, Boccaccini AR. A review of the biological response to ionic dissolution products from bioactive glasses and glass-ceramics. Biomaterials. 2011;32:2757. doi: 10.1016/j.biomaterials.2011.01.004. [DOI] [PubMed] [Google Scholar]
- 39.Nan A, Bai X, Son SJ, Lee SB, Ghandehari H. Cellular uptake and cytotoxicity of silica nanotubes. Nano Lett. 2008;8:2150. doi: 10.1021/nl0802741. [DOI] [PubMed] [Google Scholar]
- 40.Gong W, Huang Z, Dong Y, Gan Y, Li S, Gao X, Chen X. Ionic extraction of a novel nano-sized bioactive glass enhances differentiation and mineralization of human dental pulp cells. J Endodont. 2014;40:83. doi: 10.1016/j.joen.2013.08.018. [DOI] [PubMed] [Google Scholar]
- 41.Park M, Annema W, Salvati A, Lesniak A, Elsaesser A, Barnes C, McKerr G, Howard C, Lynch I, Dawson K. In vitro developmental toxicity test detects inhibition of stem cell differentiation by silica nanoparticles. Toxicol Appl Pharmacol. 2009;240:108. doi: 10.1016/j.taap.2009.07.019. [DOI] [PubMed] [Google Scholar]
- 42.Tay CY, Fang W, Setyawati MI, Sum CP, Xie J, Ng KW, Chen X, Hong CHL, Leong DT. Reciprocal response of human oral epithelial cells to internalized silica nanoparticles. Part Part Syst Char. 2013;30:784. [Google Scholar]
- 43.Soenen SJ, Nuytten N, De Meyer SF, De Smedt SC, De Cuyper M. High intracellular iron oxide nanoparticle concentrations affect cellular cytoskeleton and focal adhesion kinase-mediated signaling. Small. 2010;6:832. doi: 10.1002/smll.200902084. [DOI] [PubMed] [Google Scholar]
- 44.Qu G, Liu S, Zhang S, Wang L, Wang X, Sun B, Yin N, Gao X, Xia T, Chen JJ, Jiang GB. Graphene oxide induces toll-like receptor 4 (TLR4)-dependent necrosis in macrophages. ACS Nano. 2013;7:5732. doi: 10.1021/nn402330b. [DOI] [PubMed] [Google Scholar]
- 45.Tay CY, Cai P, Setyawati MI, Fang W, Tan LP, Hong CHL, Chen X, Leong DT. Nanoparticles strengthen intracellular tension and retard cellular migration. Nano Lett. 2014;14:83. doi: 10.1021/nl4032549. [DOI] [PubMed] [Google Scholar]
- 46.Tay CY, Setyawati MI, Xie J, Parak WJ, Leong DT. Back to basics: Exploiting the innate physico-chemical characteristics of nanomaterials for biomedical applications. Adv Funct Mater. 2014;24:5936. [Google Scholar]
- 47.Ochiai N, Uchida R, Fuchida S, Okano A, Okamoto M, Ashihara E, Inaba T, Fujita N, Matsubara H, Shimazaki C. Effect of farnesyl transferase inhibitor R115777 on the growth of fresh and cloned myeloma cells in vitro. Blood. 2003;102:3349. doi: 10.1182/blood-2003-03-0851. [DOI] [PubMed] [Google Scholar]
- 48.Khalil IA, Kogure K, Akita H, Harashima H. Uptake pathways and subsequent intracellular trafficking in nonviral gene delivery. Pharmacol Rev. 2006;58:32. doi: 10.1124/pr.58.1.8. [DOI] [PubMed] [Google Scholar]
- 49.Yue H, Wei W, Yue Z, Lv P, Wang L, Ma G, Su Z. Particle size affects the cellular response in macrophages. Europ J Pharmaceut Sci. 2010;41:650. doi: 10.1016/j.ejps.2010.09.006. [DOI] [PubMed] [Google Scholar]
- 50.Rejman J, Oberle V, Zuhorn I, Hoekstra D. Size-dependent internalization of particles via the pathways of clathrin-and caveolae-mediated endocytosis. Biochem J. 2004;377:159. doi: 10.1042/BJ20031253. [DOI] [PMC free article] [PubMed] [Google Scholar]
- 51.Kanchan V, Panda AK. Interactions of antigen-loaded polylactide particles with macrophages and their correlation with the immune response. Biomaterials. 2007;28:5344. doi: 10.1016/j.biomaterials.2007.08.015. [DOI] [PubMed] [Google Scholar]
- 52.Peters K, Unger RE, Kirkpatrick CJ, Gatti AM, Monari E. Effects of nano-scaled particles on endothelial cell function in vitro: Studies on viability, proliferation and inflammation. J Mater Sci Mater Med. 2004;15:321. doi: 10.1023/b:jmsm.0000021095.36878.1b. [DOI] [PubMed] [Google Scholar]
- 53.Conner SD, Schmid SL. Regulated portals of entry into the cell. Nature. 2003;422:37. doi: 10.1038/nature01451. [DOI] [PubMed] [Google Scholar]
- 54.Huang D, Chung T, Hung Y, Lu F, Wu S, Mou C, Yao M, Chen Y. Internalization of mesoporous silica nanoparticles induces transient but not sufficient osteogenic signals in human mesenchymal stem cells. Toxicol Appl Pharmacol. 2008;231:208. doi: 10.1016/j.taap.2008.04.009. [DOI] [PubMed] [Google Scholar]
- 55.Huang X, Teng X, Chen D, Tang F, He J. The effect of the shape of mesoporous silica nanoparticles on cellular uptake and cell function. Biomaterials. 2010;31:438. doi: 10.1016/j.biomaterials.2009.09.060. [DOI] [PubMed] [Google Scholar]
- 56.Radu DR, Lai CY, Jeftinija K, Rowe EW, Jeftinija S, Lin VSY. A polyamidoamine dendrimer-capped mesoporous silica nanosphere-based gene transfection reagent. J Am Chem Soc. 2004;126:13216. doi: 10.1021/ja046275m. [DOI] [PubMed] [Google Scholar]
- 57.Zaitsev S, Buchwalow I, Haberland A, Tkachuk S, Zaitseva I, Haller H, Böttger M. Histone H1-mediated transfection: Role of calcium in the cellular uptake and intracellular fate of H1-DNA complexes. Acta Histochem. 2002;104:85. doi: 10.1078/0065-1281-00633. [DOI] [PubMed] [Google Scholar]
- 58.Haberland A, Knaus T, Zaitsev SV, Stahn R, Mistry AR, Coutelle C, Haller H, Böttger M. Calcium ions as efficient cofactor of polycation-mediated gene transfer. Biochim Biophys Acta. 1999;1445:21. doi: 10.1016/s0167-4781(99)00017-2. [DOI] [PubMed] [Google Scholar]
- 59.Boussif O, Lezoualc’h F, Zanta MA, Mergny MD, Scherman D, Demeneix B, Behr JP. A versatile vector for gene and oligonucleotide transfer into cells in culture and in vivo: Polyethylenimine. Proc Natl Acad Sci USA. 1995;92:7297. doi: 10.1073/pnas.92.16.7297. [DOI] [PMC free article] [PubMed] [Google Scholar]
- 60.Reddy ST, van der Vlies AJ, Simeoni E, Angeli V, Randolph GJ, O’Neil CP, Lee LK, Swartz MA, Hubbell JA. Exploiting lymphatic transport and complement activation in nanoparticle vaccines. Nat Biotechnol. 2007;25:1159. doi: 10.1038/nbt1332. [DOI] [PubMed] [Google Scholar]


