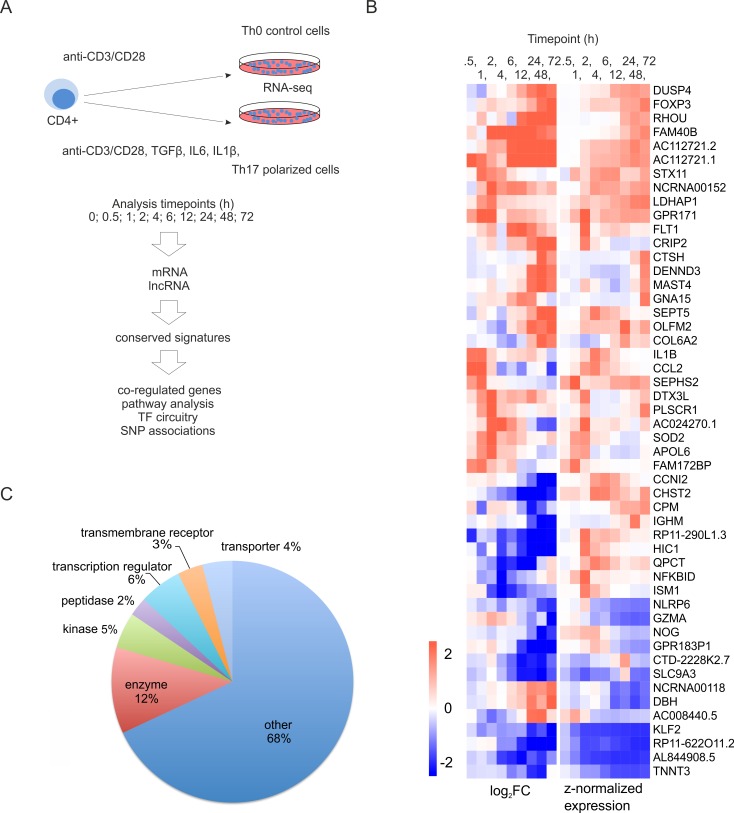
Figure 1. Transcriptional changes during the first 72 hours of Th17 cell differentiation.
A. Schematic overview of the approach used in the study. CD4+ cells were cultured under Th17 cell polarization condition. Three biological replicates of the time-series were collected for RNA-seq. B. Heatmap of the selected human genes associated with Th17 cell polarization for the first time in this study. The visualized genes were differentially regulated between Th17 and Th0 conditions at least in two timepoints, and their expression level was more than 10 RPKM in some of the sampling timepoints. The genes were ranked based on their average absolute log2 FC over the timepoints. Top 50 genes were visualized in the heatmap, where genes were clustered using hierarchical clustering. C. Functional annotation (www.ingenuity.com) of the human genes not previously reported to be differentially regulated during Th17 cell polarization. The differentially expressed genes were considered as unreported if they were not indicated to be regulated during Th17 cell polarization in the previous high-throughput studies [13, 14, 15].

