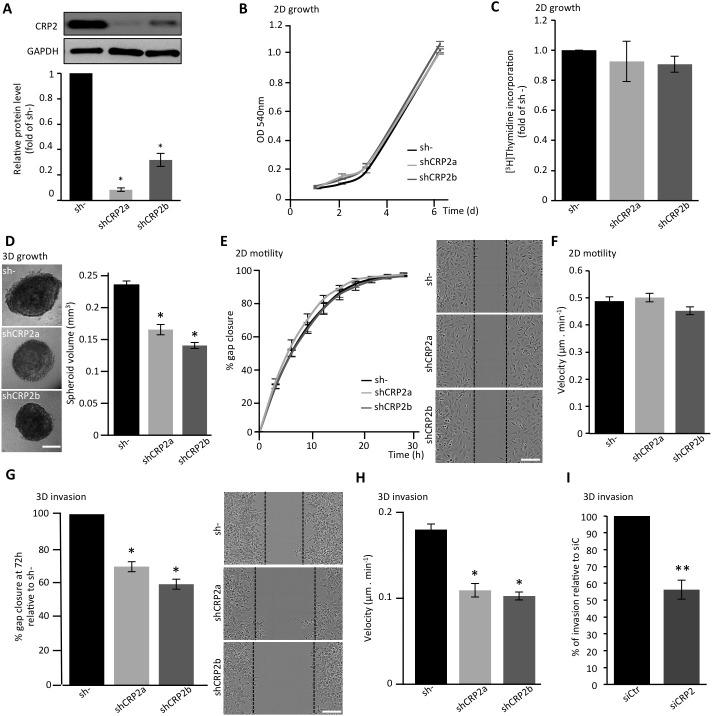
Figure 4. CRP2 contributes to breast cancer cell invasion.
A. CRP2 protein level in MDA-MB-231-luc cell lines stably expressing two independent shRNAs targeting CRP2 transcripts (shCRP2a and shCRP2b) or a control, non-targeting, shRNA (sh-). Average expression values (lower panel) in shCRP2a and b cell lines were calculated from three independent western blot analyses and expressed as fold of CRP2 protein in sh- cells. B. Proliferation rate of sh-, and shCRP2a and b cell lines as assessed by MTT assay. C. Proliferation rate as assessed by [3H]Thymidine incorporation. The data are expressed as fold of [3H]Thymidine incorporation in control sh- cells. Unpaired two-tailed, t-test revealed no statistical difference in the proliferation rate of the three cell lines. D. 3D cell spheroid proliferation assay. The right chart indicate the average spheroid volume at 6 days of culture (n = 25). E. 2D scratch wound assay (on 2D collagen matrix surface). Gap closure was analyzed using the automated image acquisition and processing system IncuCyte (Essen BioScience). The right image panel show typical gap closure at 6h for each cell line. F. Velocity of 2D migrating cells. For each cell line, at least 150 cells migrating on collagen-coated μ-Slide Chemotaxis2D chambers (Ibidi) were tracked over 2 days, and an average velocity was calculated. G. 3D scratch wound assay. After wounding, cells were embedded in a 3D collagen matrix. Results were normalized to sh- and are expressed as percentage of gap closure after 72h. The right image panel show typical gap closure at 72 h for each cell line. H. Velocity of invading cells. For each cell line, at least 150 cells embedded in a 3D collagen matrix were tracked over 2 days and an average velocity was calculated. I. Transwell assay performed with MDA-MB-231-luc cells transfected with control (siCtr) or CRP2 specific (siCRP2) siRNA. Invading cells at 24 h were quantified by MTT assay, and the results were normalized to siCtr cells (set at 100%). All the data originate from at least three independent experiments. Error bars denote standard error. Significant levels: *: p < 0.001, **: p < 0.05. Bars = 300 μm (D) and 150 μm (E and G).

