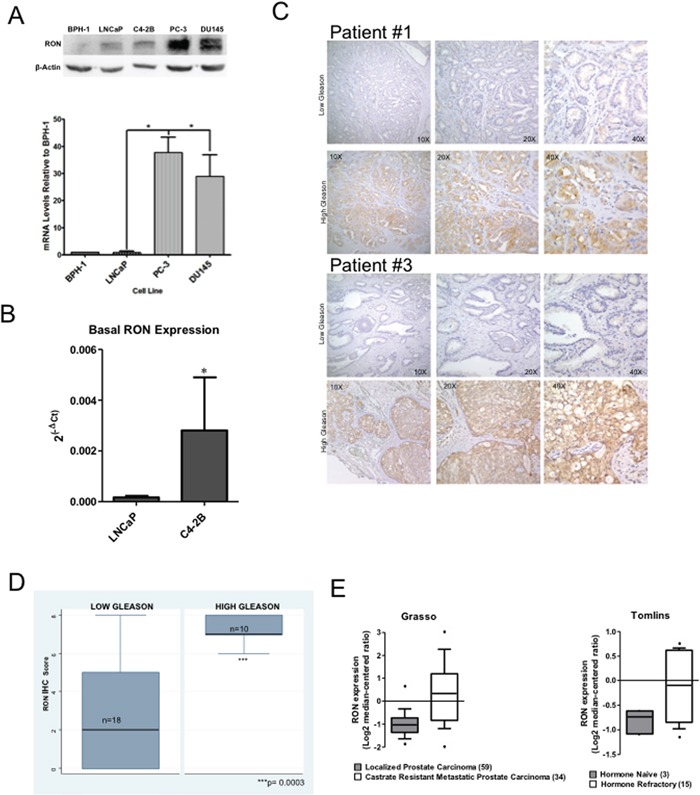
Figure 1. Elevated levels of RON in human prostate cancer cells and tumors.

Whole cell extracts and total RNA prepared from non-tumorigenic BPH-1, androgen responsive LNCaP, C4-2B, a castrate-resistant sub line of LNCaP, androgen independent PC-3 and DU145 cells was used in immunoblot analysis and real-time PCR using RON-specific primers. A. A representative immunoblot gel (top panel) and RON expression changes (average+sd) normalized to endogenous β-actin relative to BPH-1 cells (bottom panel) from three independent experiments (n=2 for western blot panel and n=4 for mRNA expression each with three technical replicates) is shown. B. RON expression changes (average+sd) normalized to endogenous β-actin in androgen-sensitive LNCaP (n=9 biological replicates each with 3 technical replicates) and castrate-resistant C4-2B (n=6 biological replicates each with 3 technical replicates) cells. Statistical significance was determined using two-sided t-test and with no adjustment for multiple comparisons. C. Tissue microarray containing low (Gleason score ≤ 6; n=18 biological replicates) and high Gleason grade (Gleason score ≥ 7; n=10 biological replicates) human prostate tumor specimens were stained using RON polyclonal antibody at a dilution of 1:50. A representative immunohistochemical staining of RON expression of low and high Gleason from two different patients (#1 and 2) is shown. D. TMAs were scored semi-quantitatively as described by us previously based on the proportion (percent) and intensity (negative, 1+ for low, 2+ for medium and 3+ for high). Final staining score was obtained as product of proportion and intensity of staining. Box plot showing differential expression of RON in low and high Gleason tumors. Wilcoxon (Mann-Whitney U) test was performed to determine if the mean ranks of RON total scores differed among tissues grouped by low Gleason of 4 or 6 (n=18) vs. High Gleason of 7 to 10 (n=10). The groups were also compared with a T test allowing for unequal variances with a Welch approximation with similar results but the non-parametrical test was considered the best fit for the data (STATA 9.2). E. Expression changes of RON in localized and castrate resistant metastatic prostate tumors. Data extracted from Oncomine.
