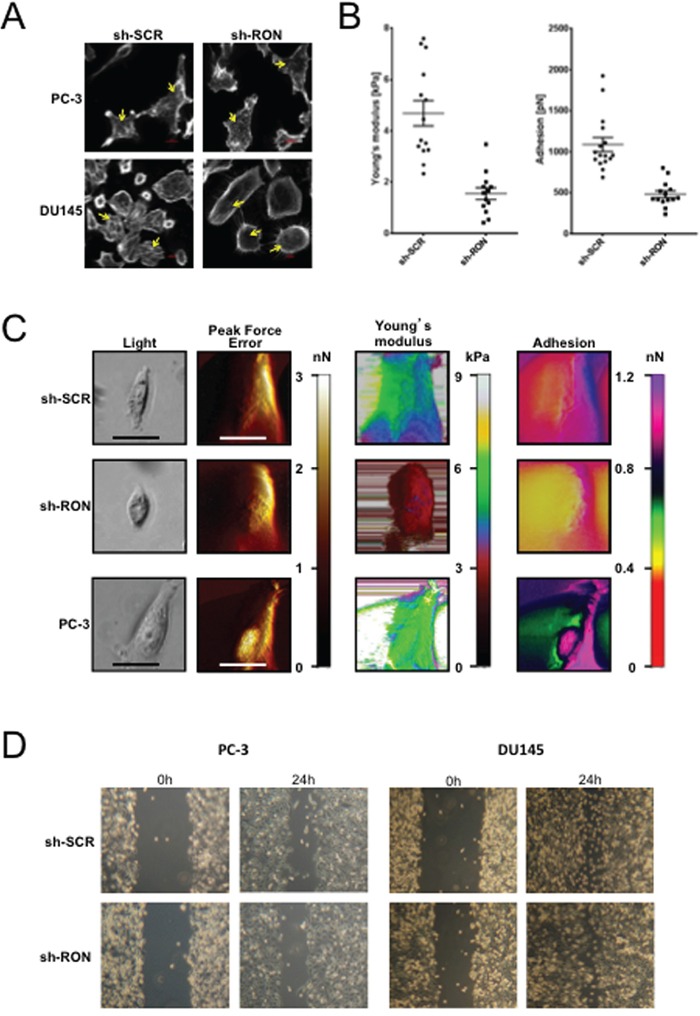
Figure 3. RON regulates mechanical properties of cells.

A. Logarithmically growing stable RON-KD or non-targeted PC-3 (n= 3 biological replicates) or DU145 (n= 3 biological replicates) cells were stained for F-actin using Rhodamine-phalloidin. Images were captured using a Sweptfield confocal system equipped with a Nikon Ti microscope at 60X magnification. An arrow indicates differences in F-actin organization. A representative image from three independent experiments is shown. B. Elasticity expressed, as the Young's modulus in kPa and adhesion expressed in Newtons was determined for at least 40 RON-KD PC-3 cells or non-targeted controls using atomic force microscopy. Data was normally distributed. Means between two groups were compared using unpaired t-test (Welch correction) and outliers detected with the ROUT or Grubbs methods (Graph Pad Prism and OriginLab Pro 9.1), p<0.05 was considered statistically significant. C. Representative images obtained with the Peak Force QNM AFM showing distinct nanomechanical properties (light microscopy image, peak force error (edge detection and fine topographical details)), cell elasticity (Young's modulus, kPa) and cell adhesion (nN) of stably silenced RON (n= 14 biological replicates) or non-targeted PC-3 (n= 16 biological replicates) or wild type PC-3 (n= 9 biological replicates) cells. Peak Force Error images were used to determine location of the cell boundary collected in elasticity and adhesion channels. All the images (except light microscopy) are false colored. The Peak Force Error scale shows smaller to taller objects progressing from black to white color. The Young's modulus (elasticity) scale shows softer objects as black and brown (lower modulus) and more rigid as green and yellow (higher modulus). The adhesion scale shows less adhesive objects as yellow and green (less force needed to separate an AFM tip from a cell) and stickier objects as dark blue and pink (more force needed). The black and white scale bars represent 40 and 20 μm, respectively. D. Photographs of gap closure following wound scratch of monolayer cells monitored every 6h. The experiment was repeated six times for PC-3 (n=6) and thrice for DU145 (n= 3) and a representative phase contrast image from an inverted Zeiss Primo Vert light microscope is shown.
