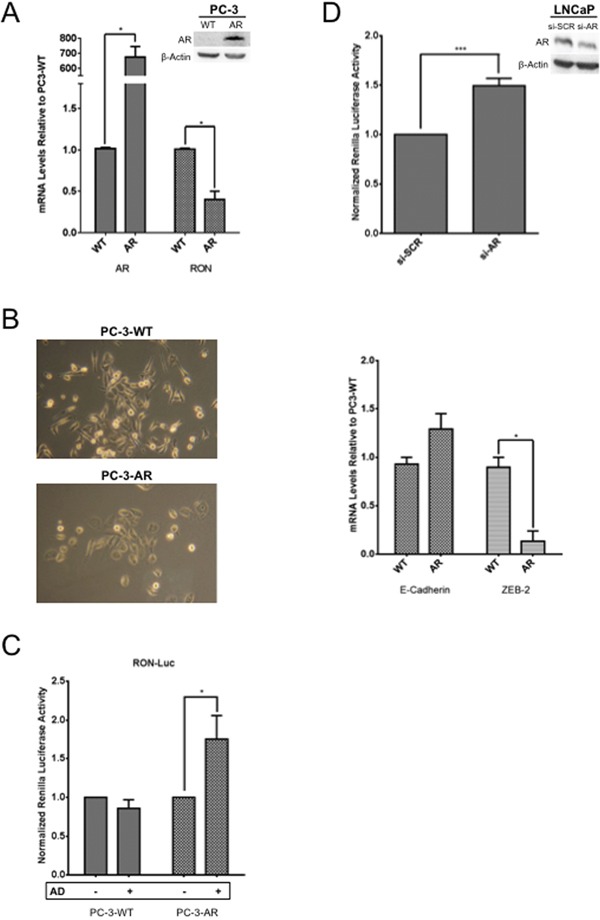
Figure 5. Androgen deprivation, a molecular switch for AR to activate RON.

A. Total RNA, and whole cell extracts prepared from logarithmically growing wild type (PC-3) and stably expressing AR (PC-3AR) cells (n=2 and 3 biological replicates each with triplicate technical replicates for RNA and protein respectively) was used to measure expression and levels of AR and RON. Expression changes (average + sd) in PC-3 AR cells relative to wild type PC-3 cells are shown. B. Phase contrast images depicting morphological differences between PC-3AR and wild type PC-3 cells are shown in the right panel. Images were captured using an inverted light microscope {ZEISS Primo Vert (Jena, Germany)} at 10X. Total RNA prepared from PC-3AR and isogenic PC-3 cells (E-Cadherin and ZEB-2 n= 2 biological replicates with three technical replicates) was used to measure changes in expression of E-cadherin and ZEB-2. C. Logarithmically growing PC-3 and PC-3-AR cells (n= 3 biological replicates each with triplicate replicates) were transfected with RON-luciferase along with Renilla luciferase. 24h post transfection, cells were grown for additional 24h in media containing 10% serum and charcoal stripped serum. Cell lysates were prepared to measure luciferase activity. Data presented is an average+sd of all experiments. D. LNCaP cells (n= 4 biological replicates each with 6 technical replicates) co-transfected with RON-reporter plasmid and AR siRNA along with Renilla luciferase. 48h after transfection, cell lysates were prepared to measure RON promoter activity. Statistical significance of the data was analyzed using student's t-test and p<0.05 was considered significant (* = p ≤ 0.05; ** = p ≤ 0.01; *** = p ≤ 0.001).
