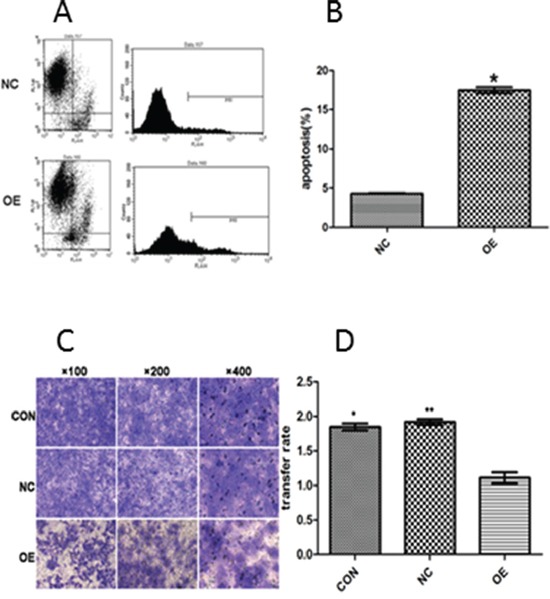
Figure 4. The apoptosis rate was evaluated quantitatively by flow cytometry (A and B) and the suppressive effect of AB209630 on the invasion of FaDu cells (C and D).

A. The figure shows a representative result; B. The comparison of apoptosis rates between NC and OE cells. The data are presented as the mean ± SD for three independent experiments (*P<0.01); C. Transwell invasion assay showed that increased AB209630 expression inhibited cell invasion of FaDu cells. The Gimsa-stained photographs were observed and measured under a microscope (×100, ×200, and ×400). Representative of three experiments; and D. Graphical representation of the rates of invading FaDu cells in the three groups. Data are shown as mean ± SD from three experiments (*P<0.05, CON versus OE; **P<0.05, NC versus OE).
