
Figure 3. Identification of lncRNA signatures characterizing distinct MM genetic subgroups.
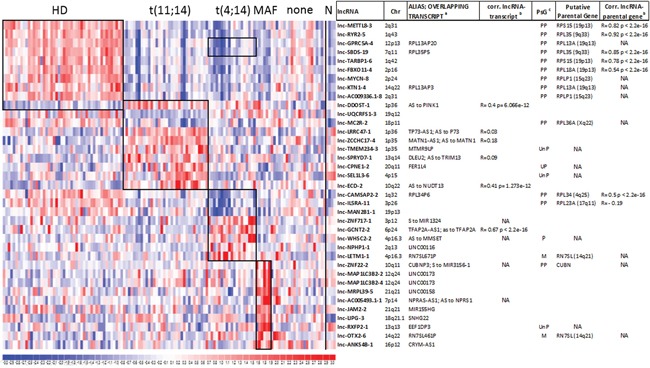
Heatmap of the differentially expressed lncRNAs in 129 MM patients stratified into the five molecular groups as specified in methods; black boxes indicate the ten most differentially expressed lncRNAs resulting from the supervised analysis comparing each subgroup versus the rest of the dataset. LncRNA expression levels in normal plasma cells are shown on the right. For each lncRNA, information about chromosomal localization (Chr), alias name, transcripts overlapping in sense or antisense (indicated as S or AS, respectively) direction, and the Pearson's correlation coefficient between lncRNA and the overlapping transcript (when detected by the array) are indicated. For lncRNAs/pseudogenes, the last column reports the putative parental gene and the Pearson's correlation coefficient between lncRNA and the parental gene expression when detected by the array. a Sense (S) to, or Antisense (AS) to overlapping transcripts; b NA indicates transcripts not detected by the array; c PsG =pseudogene; Ensembl type: PP= Processed Pseudogene; UP= Unitary Pseudogene; UnP= Unprocessed Pseudogene; M= miscellaneous RNA.