
Figure 4. Quantitative RT-PCR validation of lncRNA expression in 60 MM cases.
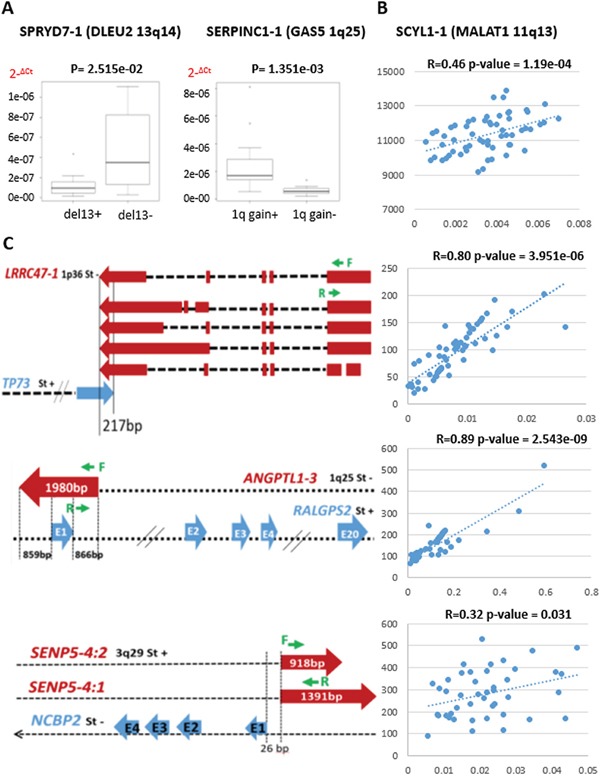
A. Box plots of lnc-SPRYD7-1 and lnc-SERPINC1-1 expression show a significant correlation with group membership based on Wilcoxon rank-sum tests (p-values are shown above each panel). The expression levels are represented as 2−ΔCt. B. MALAT1 expression validation; Pearson's correlation coefficient was calculated between GEP data and quantitative RT-PCR results expressed as 2−ΔCt. C. Genomic map of lncRNAs (red) and antisense genes (blue) with custom primers (green) localization. Sense or antisense chromosomal position (St+ or St-, respectively) are specified. For lnc-LRRC47-1, the scheme was limited to longer transcripts. Pearson's correlation coefficient was calculated between GEP data and quantitative RT-PCR results expressed as 2−ΔCt.