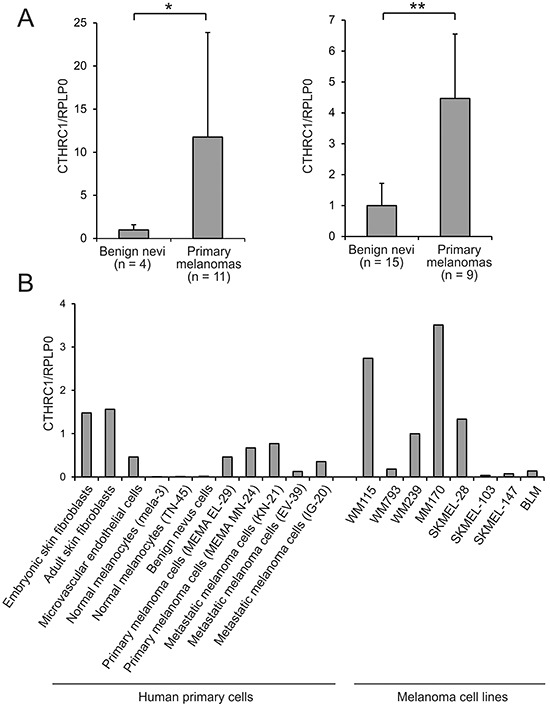
Figure 1. CTHRC1 mRNA expression in benign and malignant melanocytic lesions and cells, and other cell types.

A. Relative CTHRC1 expression levels in benign nevi and primary melanomas in two independent sample sets. CTHRC1 and RPLP0 cDNA levels were measured using qRT-PCR in triplicate for each sample. Bars represent standard deviations. *P = 0.0147, **P = 0.000907. B. CTHRC1 expression in cultures of different primary normal and melanoma cells, and melanoma cell lines. CTHRC1 and RPLP0 cDNA levels were measured using qRT-PCR in triplicate for each sample. CTHRC1/RPLP0 levels are shown relative to that of WM239.
