
Figure 2. UBE2T promoted NPC cell proliferation in vitro and in vivo.
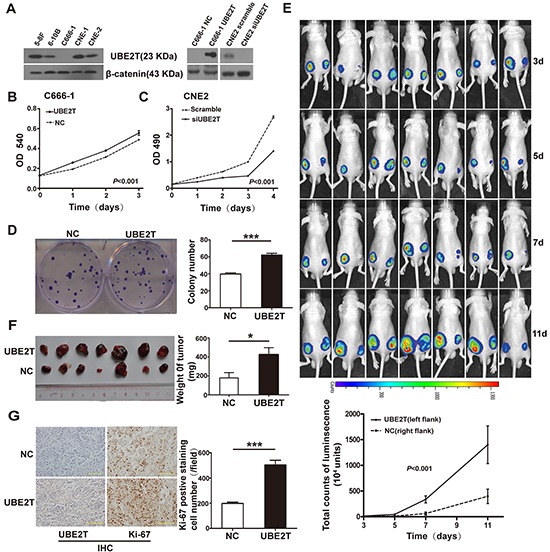
A. Background expression of UBE2T in NPC cell lines was determined by western blotting (left). UBE2T overexpression or knockdown in NPC cells was verified at 48 hours after transfection by western blotting (right). B. and C. MTT assay determined the effects of UBE2T overexpression on C666-1 cell proliferation capacities (B). CCK-8 assay determined the effect of UBE2T knockdown on CNE2 cell proliferation capacities (C). Graph shows the mean ± standard error of mean (SEM) of absorbance at different time points (n=5 or 3, analysis of variance [ANOVA] of factorial design). D. Representative images of colony formation assay (left). The bar chart represents mean ± SEM values for number of colonies from indicated groups (n=3, Student's t-test, ***P<0.001). E. Images of nude mice at indicated time points after subcutaneously injecting C666-1 cells as shown, using the IVIS Lumina II system (up; left flank: UBE2T, right flank: normal control [NC]). The graph shows mean ± SEM values of luminescence signal intensities from both flanks of nude mice at indicated time points (down; n=7, Repeated ANOVA). F. Theimages of indicated C666-1 subcutaneous xenografts (left). The graph shows mean ± SEM values of xenograft weight (n=7, Student's t-test, *P=0.024). G. Representative images of UBE2T and ki-67 expression in C666-1 xenografts from indicated groups by IHC (left). Scales indicate 100 μm. The graph shows mean ± SEM values for the number of ki-67-positive cells from 5 random 40X objective fields for each group (right; Student's t-test, ***P<0.001).