

Abstract
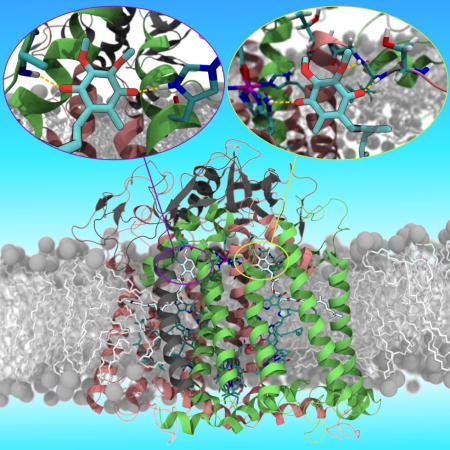
Ubiquinone forms an integral part of the electron transport chain in cellular respiration and photosynthesis across a vast number of organisms. Prior experimental results have shown that the photosynthetic reaction center (RC) from Rhodobacter sphaeroides is only fully functional with a limited set of methoxy-bearing quinones, suggesting that specific interactions with this substituent are required to drive electron transport and the formation of quinol. The nature of these interactions has yet to be determined. Through parameterization of a CHARMM-compatible quinone force field and subsequent molecular dynamics simulations of the quinone-bound RC, we have investigated and characterized the protein interactions with the quinones in the QA and QB sites using both equilibrium simulation and thermodynamic integration. In particular, we identify a specific interaction between the 2-methoxy group of ubiquinone in the QB site and the amide nitrogen of GlyL225 that we implicate in locking the orientation of the 2-methoxy group, thereby tuning the redox potential difference between the quinones occupying the QA and QB sites. Disruption of this interaction leads to weaker binding in a ubiquinone analog that lacks a 2-methoxy group, a finding supported by reverse electron transfer EPR experiments of the biradical and competitive binding assays.
TOC image
Introduction
The reaction center (RC) of the photosynthetic bacteria Rhodobacter sphaeroides is a model system for studying type II photosynthetic RCs. Its role in the photo-reduction of quinone to quinol has been extensively studied (1, 2) and well-established (Fig. 1). In brief, light excitation of a bacteriochlorophyll dimer results in electron transfer through the A branch bacteriochlorophyll and bacteriopheophytin monomers to the QA site (arrow from P to QA in Fig. 1). The resulting anionic semiquinone, , exploits the 60–80 mV (3, 4) redox potential difference between QA and the secondary quinone (QB) such that interquinone electron transport (the arrow between QA and QB in Fig. 1) results in a new charge-separated state . A second light excitation of the RC further reduces the semiquinone in QB to quinol by means of a proton-coupled electron transfer reaction. The weakly bound quinol then dissociates from the RC and shuttles its electrons to the bc1 complex, forming the basis for bacterial photosynthesis.
Figure 1.
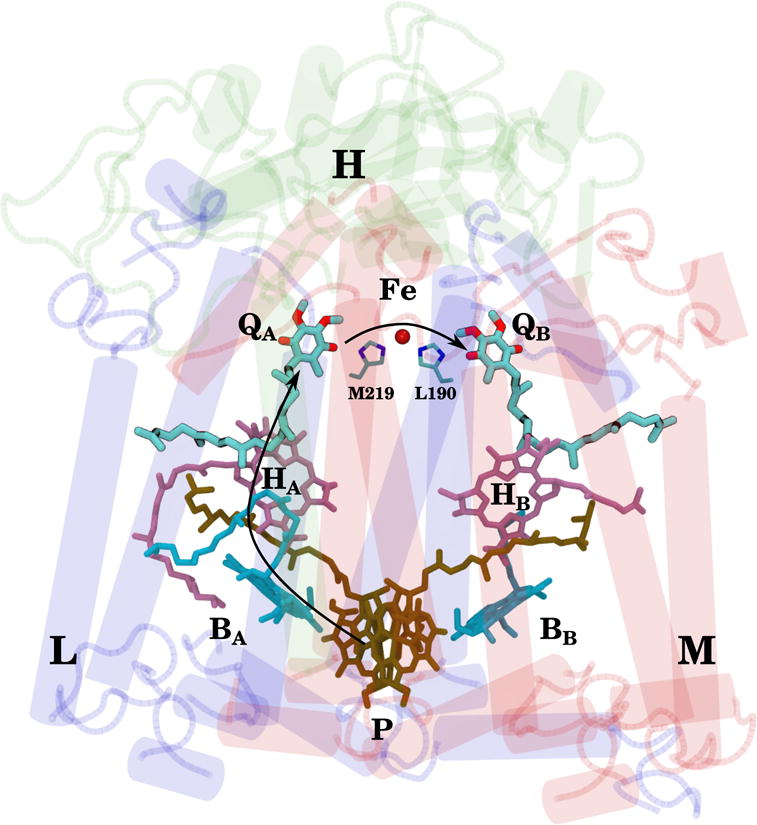
Electron transport pathway within the reaction center (RC) of Rhodobacter sphaeroides. The 3 subunits of the RC are labeled (H is green, L is blue, and M is red), along with their associated cofactors (ubiquinones QA and QB, primary donor P, and bacteriochlorophylls BA, BB, HA, and HB), as well as important residues for interquinone electron transfer, namely a pair of histidines (HisM219 and HisL190) and a non-heme iron. Electrons travel along the A branch from P to QA, and across the non-heme iron from QA to QB, as indicated by the black arrows.
The origins of the redox potential difference between the QA and QB sites necessary for interquinone electron transfer are unclear. Unlike in Rhodopseudomonas viridis, where the RC is believed to exploit the inherent redox potential difference (5) of chemically distinct quinones (6, 7), the QA and QB sites of Rhodobacter sphaeroides RC are occupied by identical quinone molecules, UbiQ-10 (ubiquinone-10, whose quinone head is 2,3-dimethoxy-5-methyl-6-isoprenyl-1,4-benzoquinone). This suggests that the RC, through different interactions with the two quinones, tunes the redox potentials of the individual UbiQ molecules. Previous DFT/EPR experiments have concluded that different orientations of the 2-methoxy group (but not the 3-methoxy group; Fig. 2) in QA and QB are responsible for establishing the functional quinone redox potential difference (8–10).
Figure 2.
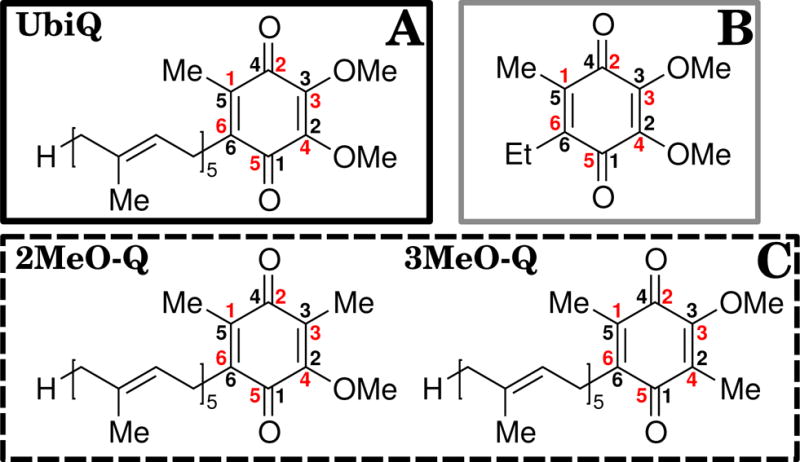
Relevant chemical structures. (A) Ubiquinone (UbiQ) is bordered with a solid black outline, while the monomethoxy quinones (MMQ) 2MeO-Q (2-monomethoxy-ubiquinone) and 3MeO-Q (3-monomethoxy-ubiquinone) are collectively bordered by a dotted black outline (C). (B) The molecule used for parameterization of UbiQ, 2,3-dimethoxy-5-methyl-6-ethyl-1,4-benzoquinone, is outlined in grey. Similar compounds were used for the parameterization of 2MeO-Q and 3MeO-Q (not shown). The alternative numbering schemes for the quinone ring are also labeled. In bold black font is the conventional carbon numbering scheme used to refer to individual atoms throughout the text, while the red numbers follow the crystallographic naming convention for UbiQ-10, and were used when generating the topology and parameter files for the simulation.
Quinones that lack these methoxy groups, such as plastoquinone (2,3-dimethyl-6-isoprenyl-1,4-benzoquinone), are non-functional in the Rhodobacter RC (11). Through the use of synthetic quinones where one of the two methoxy groups of UbiQ is replaced by a methyl, creating a monomethoxy quinone (MMQ, Fig. 2C), it has been shown that interquinone electron transfer only takes place when the QB site is occupied by a quinone that bears a 2-methoxy group, such as 2-monomethoxy ubiquinone (2MeO-Q, 2-methoxy-3,5-dimethyl-6-isoprenyl-1,4-benzoquinone) which lacks a 3-methoxy group (12). In the absence of the 2-methoxy group, e.g., when 3-monomethoxy ubiquinone (3MeO-Q, 3-methoxy-2,5-dimethyl-6-isoprenyl-1,4-benzoquinone) is bound to the RC, only formation of a QA radical upon light excitation is observed, as opposed to the case of 2MeO-Q where both QA and QB are functional (12). As removal of either methoxy group did not impair or substantially alter QA activity, the loss of methoxy-specific interactions in the QB site seems to be responsible for the observed inactivity of 3MeO-Q in the RC. Based on EPR and MMQ activity assays (9, 12), the effects of the 2-methoxy group on the affinity of UbiQ and the tuning of the redox potential of the QB site have been previously proposed to underlie the observed phenomenon, although the nature of the interactions has not been elucidated.
Molecular dynamics (MD) simulations offer the simultaneous spatial (Å) and temporal (fs) resolutions needed to characterize the specific interactions between the quinones in the QA and QB sites. Through equilibrium MD simulations, we have identified different hydrogen bonding patterns between the quinones occupying the respective QA and QB sites, that have eluded prior experimental studies. In addition, MD permits the calculation of experimental observables, such as binding affinities through thermodynamic integration (TI), that can be connected back to experiment. In parallel, we have also carried out EPR experiments in which a biradical is formed by reverse electron transfer from to QA and relative binding assays measurements that specifically address the activity and binding of 3MeO-Q to the QB site.
A prerequisite for any classical MD simulation is an empirical force field to describe the atomic interactions. UbiQ parameters already exist in AMBER (13) and CHARMM (14, 15); however, no parameters have been developed for 2MeO-Q or 3MeO-Q, and existing parameters for CHARMM do not describe methoxy dihedral rotation. Differences between the parameterization procedures for different force fields can result in different structural features, such as protein secondary structure formation (16), so the existing AMBER parameters should not be used within a CHARMM36 simulation. To generate CHARMM-compatible parameters, we follow conventional CHARMM parameterization methodology (17) through the use of ffTK(Force Field Toolkit) (18) to develop a consistent set of parameters for UbiQ and its two MMQ derivatives.
Building upon these new parameters, we have run both equilibrium simulations and TI calculations to investigate protein-quinone interactions in the QA and QB sites, and how these interactions influence methoxy dihedral orientation and monomethoxy binding within the RC. We identify specific protein-quinone interactions, including a hydrogen bond between the backbone of GlyL225 and the 2-methoxy oxygen in the QB site that serve to break the symmetry between the QA and QB sites and drive electron transfer. The TI calculations suggest that the 3MeO-Q has a lower binding affinity than 2MeO-Q or UbiQ in the QB site, which is supported by our experimental measurements. In contrast, no difference in affinity between either MMQ and UbiQ is observed in the QA site. Based on these results, we propose that the GlyL225 hydrogen bond with the 2-methoxy group stabilizes UbiQ in the QB site, and is responsible for turning the 2-methoxy dihedral angle into its out-of-plane orientation necessary to establish the 60–80 mV functional redox potential difference between QA and QB (3, 4).
Methods
In order to accomplish our research objectives, we adopted a concerted computational and experimental approach. Determination of 2MeO-Q and 3MeO-Q binding was carried out both by TI calculations that yield relative binding affinities, and by competitive binding assays and EPR experiments with the biradical that focus on the interactions of the 2-methoxy group. Thus while we present the methodology separately, there is a tight connection between computational and experimental studies, and where possible we connect back calculated quantities to experimental observables. There are two different commonly used numbering schemes for atomic positions in UbiQ (Fig. 2). Crystallographers consider C1 to be the carbon adjacent to the isoprene tail furthest from the methoxy groups in U10 (the residue name for UbiQ-10 in the PDB), while IUPAC considers C1 to be the carbonyl carbon adjacent to the tail (Fig. 2). In order to be consistent with the nomenclature in the PDB, in setting up the topology file for the quinones and in other simulation files, we followed crystallographic numbering. However in discussing the results, we follow IUPAC nomenclature in order maintain consistency with prior studies with MMQs (8, 12) and the wider literature on quinone chemistry.
Computational Methods
The starting point for all simulations was the structure of the bacterial RC (PDB ID: 1DV3) (19), which was chosen due to its planar UbiQ structure in the QB site when compared to later structures with comparable resolution (20). The planar structure suggests that the crystallographic quinone is nearer to its equilibrium position, reducing the impact of applied constraints during the initial equilibration phase. The 1DV3 structure contains five resolved isoprene units, thus all simulations conducted use a quinone head with a five isoprene tail. The isoprenoid tail of UbiQ is membrane exposed when bound to the RC complex. To better represent this in the simulation system, the complex was embedded into a 90 Å×100 Å 1-palmitoyl-2-oleoylphosphatidylcholine (POPC) membrane and solvated such that the axis parallel to the membrane normal was 115 Å long with a 150 mM concentration of NaCl in solution (Fig. S1). The simulations were carried out with NAMD 2.9 (21), using the CHARMM36 force field for proteins (22–24) and lipids (25), the TIP3P water model (26), and existing parameters for cofactors excluding the quinones (14, 27). UbiQ, 2MeO-Q, and 3MeO-Q were re-parameterized for CHARMM using ffTK (18), with a detailed description of the methodology in the following section.
Parameters shared by all the simulations include the non-bonded cutoffs, with a real space cutoff of 12 Å (switching after 10 Å), the inclusion of long-range electrostatics through the use of the particle mesh Ewald (PME) method (28, 29) with a 1 Å grid spacing, as well as 2 fs timesteps and the requisite use of SETTLE (30) to constrain bond lengths to hydrogen atoms. All simulations were performed under constant temperature (310 K unless specified otherwise) and pressure (1 atm), maintained by Langevin dynamics and Langevin piston Nosé-Hoover methods, respectively (31, 32).
Parameterization of UbiQ and Monomethoxy Derivatives
Given the ubiquitous nature of UbiQ, molecular mechanics parameter sets have been developed to model its behavior, most notably existing parameter sets for AMBER (13) and CHARMM (14, 15). The AMBER parameters are incompatible with the CHARMM force field due to their differing methodologies for computing parameters for electrostatic and non-bonded interactions, which in turn also result in differences in the bonded parameters. The prior CHARMM parameter sets for UbiQ were not obtained in a manner consistent with the rest of the force field, and unfortunately for our purposes, did not model force constants for the dihedral torsions. Since we are studying interactions that contribute to the orientation of the methoxy group, thereby tuning the redox potential, it was necessary to reparameterize UbiQ. As we were most concerned with the behavior of the quinone ring itself, parameters for the isoprene tails were taken by analogy from the lipid force field (25).
The reparameterization was conducted within the framework provided by ffTK(18), a recently developed plugin within VMD (33) that streamlines the preparation and analysis of quantum mechanical target data to generate CHARMM-compatible parameters in a manner consistent with the CHARMM General Force Field (CGenFF) (17). The two model compounds used for full parameterization were 2,3-dimethoxy-5-methyl-6-ethyl-1,4-benzoquinone (Fig. 2B) and 2-methoxy-3,5-dimethyl-6-ethyl-1,4-benzoquinone, which are truncated versions of UbiQ and 2MeO-Q respectively (Fig. 2A & C), with the 6-ethyl representing a truncated isoprene group, analogous to prior studies focused on methoxy dihedral behavior (34). As the atomic partial charges are sensitive to the position of substituents on the ring, the corresponding truncated version of 3MeO-Q was subjected to the charge optimization step to arrive at an independent charge distribution. However, as the dihedral terms are identical to those found in 2MeO-Q, 3MeO-Q uses 2MeO-Q bond, angle, and dihedral parameters. The parameterization process follows standard CHARMM force field parameter development (17, 18, 35), and is detailed in the Supporting Information.
The final parameter set is provided in Supporting Information, however the form of the dihedral terms used to describe the rotation about the methoxy-oxygen-ring bond requires additional discussion. In existing x-ray structures, the methoxy methyl groups are oriented out of the quinone ring plane in both QA and QB (36–39) by differing degrees, suggesting that those are the stable conformations in the protein environment. This geometry in UbiQ is in part a steric effect, as suggested by prior computational studies on UbiQ and analogs (40, 41) and observed resonances with IR spectroscopy (42). However when the methoxy is in plane, the methoxy oxygen conjugates into the benzoquinone π-system, lowering the overall energy and redistributing charges (Fig. S2). Thus the QM optimized geometries in vacuum for 2MeO-Q and 3MeO-Q have the methoxy methyl in plane with the quinone ring pointed away from the nearest carbonyl. The minimum energy configuration found for UbiQ (2,3-dimethoxy-5-methyl-6-ethyl-1,4-benzoquinone) has one methoxy in the quinone plane in a similar geometry to the MMQ case and the other methoxy out of plane. The final parameter set treats the minimum energy conformation for the dihedral term as bringing both methoxys in-plane, with the minimum values for the dihedral at 0 and 180 degrees and a periodicity of 2, counter to the observed methoxy orientations in crystallographic structures. Thus any out-of-plane motion will be a result of non-bonded interactions within the quinone.
To assess the performance of the parameters, we calculate the solvation free energy at 296 K for Q0 (2,3-dimethoxy-5-methyl-1,4-benzoquinone), Q0M (2,3-dimethoxy-5,6-dimethyl-1,4-benzoquinone), and Q1 (2,3-dimethoxy-5-methyl-6-isoprenyl-1,4-benzoquinone) in water, octanol, hexane, and cyclohexane using free energy perturbation (FEP) (43) to compare against experimentally determined partition coefficients (44). The FEP details are detailed in the Supporting Information. The analysis of the FEP simulations was carried out using the ParseFEP plugin (45) of VMD (33), with the reported uncertainties calculated using the Bennett acceptance ratio (46). Parameters for octanol, hexane, and cyclohexane were taken from CGenFF (17).
Equilibrium Simulations of Membrane-Embedded Reaction Centers
Three sets of 300 ns equilibrium simulations were carried out, each with a different quinone (UbiQ, 2MeO-Q, and 3MeO-Q) occupying both the QA and QB sites, with the equilibration process described in the Supporting Information. One additional 100 ns simulation was carried out with UbiQ in the QA and QB sites, where AspL213 was protonated in order to investigate the consequences on the hydrogen bonding of SerL223. Analysis of the resulting trajectories was carried out in VMD (33), using features including the HBonds plugin, as well as its scripting capabilities to measure specific dihedrals, distances, and to visualize neighboring interactions. Plots were generated using Matplotlib (47).
Thermodynamic Integration (TI) Calculations
TI calculations (48–50) were set up to determine the binding affinity for 2MeO-Q and 3MeO-Q relative to UbiQ in the QA and QB sites through the use of thermodynamic cycles to transition between states. The state definitions and transition nomenclature are detailed in Fig. 3. Two binding affinity changes were calculated, one which used the quinone in aqueous solution as the reference , and another using a membrane exposed quinone with the headgroup located at a bilayer interface . This entails four alchemical transitions per MMQ derivative (8 total). Two alchemical transitions calculate UbiQ to MMQ transition within the QA and QB sites of the RC . The other two alchemical transitions calculate the UbiQ to MMQ transition in solution and membrane , respectively. The transitions within the RC used the membrane-embedded RC from the equilibrium trajectories as the starting point. Transitions between UbiQ and MMQ in aqueous solution were conducted in a water cube with 40 Å sides. Membrane transitions were conducted in a solvated 1-palmitoyl-2-oleoylphosphatidylethanolamine (POPE) membrane, with 40 Å sides perpendicular to the membrane normal and a 60 Å length parallel to it.
Figure 3.
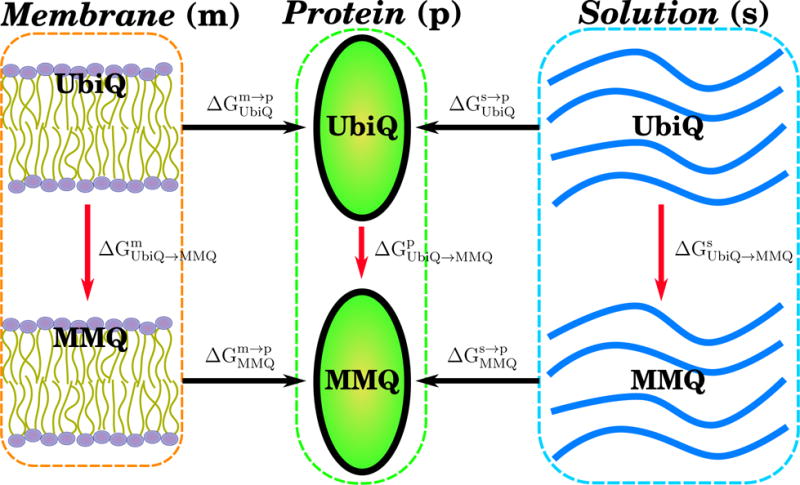
Schematic of the states connected using thermodynamic integration. Ubiquinone (UbiQ) is the quinone present in the top states, while one of the monomethoxy quinones (MMQ), either 2MeO-Q or 3MeO-Q, is present below. The quinone is either immersed in a lipid bilayer (left, denoted m for membrane), the QA or QB site of the RC (middle, denoted p for protein), or immersed in water (right, denoted as s for solution). Horizontal black arrows are used to denote state transitions that are accessible in nature, while vertical red arrows denote alchemical state transitions performed in silico. Since the free energy change around a closed loop must be zero, we can connect the alchemical state transitions to relative binding free energies. Specifically, and . In addition, we can also compute relative free energy change for membrane partitioning between MMQ and UbiQ by connecting the left and right states directly via .
The TI reaction coordinate is described in the Supporting Information, an featured a 20 kcal/mol/Å2 harmonic potential applied between heavy atoms in the MMQ rings to their corresponding partner in UbiQ to eliminate sampling unphysical conformations which can result in slow convergence of the TI calculations (51, 52). The results when such restraints are not applied are detailed in Supporting Information. The free-energy integration itself was carried out on a third order penalized spline (P-spline(53)) fit of the average dU/dλ over 5 ns (10 ns for solution) of simulation time. Before the production simulations, each window was equilibrated for 0.5 ns where collected data did not contribute to the average. Statistical error estimates were obtained using methodology detailed in Steinbrecher et al. (54).
Experimental Methods
RCs used in this study were isolated from a strain of Rb. sphaeroides expressing the protein with a histidine-tag on the M subunit (55). The quinones were extracted by the method of Okamura et al. (56), and replaced with 2MeO-Q, 3MeO-Q, or UbiQ with a length 4 isoprene tail (UbiQ-4) where appropriate. The synthetic quinones have shorter isoprenoid tails than what was simulated (4 units rather than 5). Occasionally, a native UbiQ (with all 10 isoprene units present, UbiQ-10) was used as a reference point, which are clearly indicated.
Previous studies showed that RCs reconstituted with 3MeO-Q were incapable of electron transfer from QA to QB, preventing the formation of a 3MeO-Q radical (12). This has hindered EPR-based investigation of the interaction of 3MeO-Q in QB. However, while the quinone redox potential difference is unfavorable for forward electron transfer, the loss of the 2-methoxy group in 3MeO-Q is expected to facilitate the reverse reaction (8). When the quinone pool is fully reduced to quinol, an equilibrium is established between the EPR silent state and the EPR active state via electron disproportionation (57). Above pH 8.5, this equilibrium favors formation of the biradical. This reverse electron transfer reaction is very likely to also occur for 3MeO-Q bound RCs, because the one-electron redox potential in this case is higher for QA than for QB.
In this experiment, the quinone pool was reduced and the pH adjusted by the method of Calvo et al. (57). The high spin Fe2+ was removed from the RC by biochemically replacing Fe2+ with diamagnetic Zn2+ according to the procedures outlined by Utschig et al. (58) in order to remove the broad signal arising from the coupling of the semiquinone to the high spin Fe2+. EPR samples were generated by borohydride (NaBH4) reduction at pH 10.5 in a D2O buffer to reduce the EPR linewidth. All continuous wave (CW) Q-band measurements were performed on a Bruker ELEXSYS E580 EPR spectrometer equipped with an Oxford CF 935 cryostat and an ER 5106 QT resonator.
Kinetics measurements were performed on a spectrometer of local design, capable of delivering an actinic flash to the RC sample, and monitoring the subsequent kinetics to establish the rate constants for the decay of the charge-separated state:
In this scheme, kAP and kBP are the rates of the direct recombination routes for QA and QB, and KAB is the equilibrium constant between the two radicals. For RCs in which UbiQ is acting as QA and QB, kAP ≫ kBP. Thus, the rate of charge recombination when both QA and QB are bound (kP) can be approximated as (59). Since kP is typically an order of magnitude slower than the case where QB is not present (kAP), the back reaction kinetics can provide a convenient assay of how much QB was bound at the time of the actinic flash.
In this experiment, the ability of 3MeO-Q to compete with UbiQ-4 for the QB site is determined with a competitive binding assay. UbiQ-4 was chosen for this experiment because it has the same isoprenoid tail length as 3MeO-Q. RCs with UbiQ-4 acting as QB give a back reaction rate constant kP upon light activation, whereas RCs with 3MeO-Q bound as QB will back react at a rate kAP because to QB electron transfer does not occur for this quinone analog. With UbiQ-4 analogs, quinone exchange between micelles occurs on the time scale of the back reaction. This makes the kinetics polyphasic, preventing a quantification of the amount of UbiQ-4 bound at QB from the relative amplitudes of the slow (kP) and fast (kAP) phases. In this case, the average lifetime is used instead as a good indicator of the QB binding, where a faster back reaction indicates that more UbiQ-4 is being displaced by 3MeO-Q from the QB site.
QB-extracted RCs were prepared, leaving the QA site intact with the native, tightly bound UbiQ-10. The QB site was then filled with UbiQ-4 by titration from an ethanol stock. 3MeO-Q was then titrated from an ethanol stock in the cuvette while monitoring the average lifetime of the 430 nm back reaction kinetics of the charge recombination. The final ethanol concentration at the end of the titration was 6%. The concentration of 3MeO-Q was increased from 0 to 600 μM, with a fixed concentration of 1.6 μM QB-extracted RCs and 3 μM UbiQ-4 in a pH 7.8 solution of 0.045% LDAO and 10 mM TRIS.
Results and Discussion
Three main categories of results will be presented: (1) the validation of the quinone parameter set against previously measured experimental observables, (2) the calculation of relative binding affinities between UbiQ and MMQ derivatives in the QA and QB sites including comparisons with experimental observables, and (3) the observed behavior of quinones within the QA and QB sites during the equilibrium simulations.
Parameter Validation of Ubiquinone and Derivatives
One basic parameter validation step is to calculate the solvation free energy of the parameterized compounds. While experimental solvation free energies are available for a wide variety of model compounds (60), quinones are not among them. Instead, we use the computed solvation free energies of quinones with varying tail lengths (Table 1), to compute the partition coefficient, log P, which provides a measure of solute partitioning between organic and aqueous phases. Comparison between our calculated log P values and previously reported experimental measurements (44) yields excellent agreement for octanol/water partitioning, coinciding with experimental values within the statistical error of our simulations. By contrast, the partition coefficients for cyclohexane/water partitioning are 1–1.5 log P units skewed in favor of partitioning into water for the most hydrophilic quinone, which may be due to the non-polarizable nature of the force field not accounting for the induced dipoles and quadrupoles in hexane or cyclohexane brought about by the quinone. The magnitude of the error is similar to that found in computational measures of other species which would induce dipoles, such as chlorinated benzene rings in a fixed-charge force field (61, 62). These cases are also found to partition too favorably into water (61, 62). The permanent dipole of octanol better represents the membrane interface, suggesting that the essential interactions of the quinones have been captured.
Table 1.
Calculated solvation free energies (in kcal/mol) for the newly parameterized UbiQ with varying tail lengths, along with the resulting log P values, compared to experimental values (44). The relationship between log P and the computed solvation free energies is . The quinones are referenced by their short names, Q0 is 2,3-dimethoxy-5-methyl-1,4-benzoquinone, Q0M is 2,3-dimethoxy-5,6-dimethyl-1,4-benzoquinone, and Q1 is 2,3-dimethoxy-5-methyl-6-isoprenyl-1,4-benzoquinone.
| Water | Octanol | Cyclohexane | Hexane | ||||||
|---|---|---|---|---|---|---|---|---|---|
| ΔGsolv | ΔGsolv | log P | Exp. log P (44) | ΔGsolv | log P | Exp. log P (44) | ΔGsolv | log P | |
| Q0 | −5.3 ± 0.4 | −6.12 ± 0.07 | 0.63 ± 0.28 | 0.78 | −3.89 ± 0.06 | −1.02 ± 0.28 | 0.39 | −3.85 ± 0.05 | −1.05 ± 0.28 |
| Q0M | −4.77 ± 0.25 | −6.66 ± 0.08 | 1.40 ± 0.19 | 1.26 | −5.01 ± 0.06 | 0.18 ± 0.19 | 0.73 | −4.86 ± 0.06 | 0.07 ± 0.19 |
| Q1 | −4.11 ± 0.26 | −9.28 ± 0.09 | 3.82 ± 0.20 | >3 | −8.19 ± 0.07 | 3.01 ± 0.19 | >3 | −7.66 ± 0.07 | 2.62 ± 0.19 |
Prior studies have highlighted the difficulty in reproducing the methoxy dihedral angles of neutral UbiQ within the regime of a fixed-charge force field (34). In addition to the solvation free energy, we have also compared our observed methoxy dihedral angles from equilibrium protein-bound simulations to distributions observed from the highest resolution structures of UbiQ in the RC of R. sphaeroides (Fig. 4). The degree to which our methoxy dihedral distributions overlap with the corresponding distributions from the PDB varies depending on the specific dihedral. The general trend is for the dihedral distributions from 2MeO-Q and 3MeO-Q simulations to show maxima that are in reasonable agreement with the maxima observed in the PDB distribution, while the distribution for UbiQ shows a less robust overlap. Within the crowded protein environment, the methoxy group orientation is determined by interactions with the protein, in addition to steric interactions between the two methoxy groups in UbiQ. The balance of these effects is delicate, and small errors can shift the distribution relative to experimentally observed PDB distributions. For UbiQ, the methyl moieties of the methoxy groups are frequently located on opposite sides of the quinone plane to minimize steric clashes (resulting in dihedral angles that are both either > 0 or < 0), including states where the methoxy is nearly coplanar due to the position of the methoxy torsion minima at planar geometries (see methods). These states are not represented in the majority of crystallographic structures.
Figure 4.
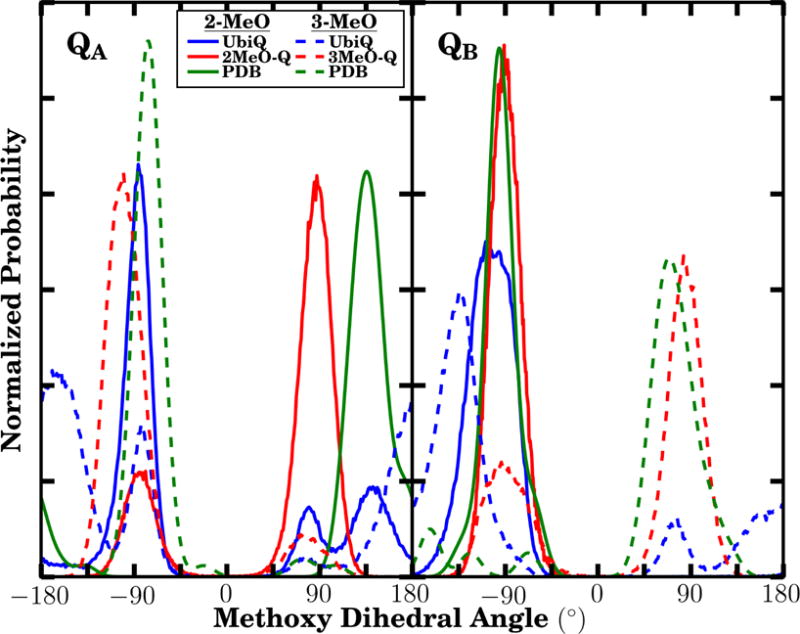
Methoxy dihedral angle distributions from the quinones occupying the QA (left) and QB (right) sites in our simulations (blue and red lines for UbiQ and MMQ distributions, respectively) are compared to same dihedral angles present in the PDB (green). Solid lines indicate the distributions of the 2-methoxy group, while dashed lines are the distributions for the 3-methoxy group. For both methoxy groups, the dihedral is measured with respect to the adjacent carbonyl carbon, that is, C1 for the 2-methoxy group, and C4 for the 3-methoxy group (Fig. 2). The comparison green lines were determined by using 69 QA and 32 QB structures of available PDB structures (with resolution better than 2.8 Å) where the quinone was in the proximal position (as indicated by a hydrogen bond distance below 4 Å to its histidine hydrogen bonding partner). To build the distribution, each PDB value was assumed to be a gaussian with a σ of 10°.
Due to steric interactions between the methoxy groups, the observed peak positions in the UbiQ dihedral distributions are in the correct locations, however the size of these peaks relative to the predominant peak suggests a population shift of approximately 1 kcal/mol in favor of the crystallographically rare states. This population shift is consistent in magnitude with studies comparing the amino acid side chain rotameric states between MD simulation and their distributions within the PDB (63). However, for the 2-methoxy dihedral angle in QB, we see close agreement between the simulation results and the distribution from the PDB, likely due to a hydrogen bond with the surrounding protein environment which will be discussed later in depth. Finally, we note that it is not surprising to detect a wider distribution or even new states and populations when one examines the system at ambient temperatures, as is the case in our simulation, in comparison to crystallographic structures representing a population at very low temperature.
Differential Quinone Binding Affinity in RC QA and QB sites
RCs occupied by 3MeO-Q are unable to undergo interquinone electron transfer (12). Two potential hypotheses exist that might rationalize this observation. One posits that 3MeO-Q, which lacks a 2-methoxy group, simply does not bind to the QB site, thereby preventing interquinone electron transfer. However prior experiments cannot exclude the possibility that 3MeO-Q does bind to QB, and that the redox potential relative to QA is simply unfavorable when 3MeO-Q is bound. Our simulation results for the relative binding affinities (Table 2), show a ~ 1.1 kcal/mol loss in binding free energy when going from UbiQ to 3MeO-Q in the QB site, which is in sharp contrast to the other relative binding free energies that show negligible differences. When comparing to a solution-based reference state, the other three UbiQ→MMQ combinations suggest tighter binding for the MMQ relative to UbiQ. Since 2MeO-Q and 3MeO-Q lack one oxygen relative to UbiQ, they are more hydrophobic, and therefore MMQ species are generally expected to bind the RC tighter than UbiQ when using aqueous solution as the reference. However, as will be discussed in greater detail later, 3MeO-Q in the QB site lacks a strong favorable interaction UbiQ has between the 2-methoxy oxygen and a specific residue on the protein backbone. As a result, 3MeO-Q binds less tightly in QB than UbiQ, despite its increased hydrophobicity.
Table 2.
Relative binding affinities (in kcal/mol) determined by thermodynamic integration for ubiquinone (UbiQ) transformation into a monomethoxy quinone (MMQ) between either solution (s) or the membrane (m) and the RC (p), and , respectively. The ratio between the dissociation constants is related to ΔΔG by , with the factor of emerging to correct for a systematic bias due to limited sampling (see SI). Relative binding free energies (ΔΔG) are calculated as follows: and , using the states defined in Fig. 3.
| Site | MMQ |
|
|
|
|
||||
|---|---|---|---|---|---|---|---|---|---|
| QA | 2MeO-Q | −0.94 ± 0.01 | −0.35 ± 0.03 | −0.04 ± 0.03 | 0.9 | ||||
| 3MeO-Q | −0.70 ± 0.01 | −0.23 ± 0.05 | 0.08 ± 0.05 | 1.1 | |||||
|
| |||||||||
| QB | 2MeO-Q | −0.88 ± 0.01 | −0.28 ± 0.03 | 0.02 ± 0.05 | 1.0 | ||||
| 3MeO-Q | 0.39 ± 0.02 | 0.85 ± 0.05 | 1.16 ± 0.05 | 6.6 | |||||
The aqueous solubility of native quinones is quite poor due to their long isoprenoid tails, and so quinones are known to partition strongly to the membrane (44). To take this aspect into account, we also calculated the relative binding free energy when considering quinones at the membrane interface as the reference state ( in Table 2). The MMQs partition into the membrane more favorably than UbiQ by approximately 0.5 kcal/mol due to the absence of a single oxygen in MMQ relative to UbiQ. Since the quinone pool is predominantly membrane-bound in vivo, may represent a better estimate of the relative binding affinities than .
In the three cases of well-bound MMQs, the mean UbiQ→MMQ is very close to , which is the expected entropic stabilization from populating one internal degree of freedom. UbiQ has an additional dihedral torsion to consider relative to MMQs, and within the confines of the protein, the sampling of the methoxy dihedral angle is retarded, similar to the slowdown observed for protein rotameric transitions when the side chain is buried (63). As detailed in Supporting Information, we do not believe we have adequately sampled this additional slowly varying dihedral within the confines of the protein, and so we account for this additional degree of freedom by adding to in Table 2.
It should be noted that even in the absence of this correction, the relative binding free energies follow the trend that 3MeO-Q in the QB site binds less favorably than UbiQ, qualitatively consistent with the hypothesis that poor binding of 3MeO-Q to the QB site contributes to its inactivity in electron transfer. However we use the corrected relative binding free energies to estimate the ratio of the dissociation constants between MMQs and UbiQ. The ratios in Table 2 indicate that the binding affinities between MMQs and UbiQ are similar, with the exception of 3MeO-Q in the QB site, where the calculated ratio of dissociation constants is 6.6, suggestive of mildly weaker binding by less than an order of magnitude.
Experimental Comparisons
From the TI calculation, we observe that 3MeO-Q exhibits weaker binding to the QB site than does either 2MeO-Q or UbiQ, consistent with its behavior as an acceptable substitute in QA but not QB (12). This can be compared to the CW EPR spectra of borohydride reduced RCs with native and reconstituted MMQ (Fig. 5), where the spectra strongly depend on the chemical identity of the quinone present. With the native quinone (UbiQ-10), the Q-band spectrum is in good agreement with previously reported spectra for the biradical (57), exhibiting additional splittings of the gx and gy spectral components resulting from the dipole-dipole and exchange interaction of two closely located electron spins. When the RC was reconstituted with 2MeO-Q, a splitting of the gx and gy components was still observed, indicating formation of the biradical. The lower spectral resolution of the MMQ spectra in comparison with UbiQ-10 is likely due to the influence of the additional ring-methyl proton hyperfine coupling present in the MMQs, and the overall weaker signal suggests the equilibrium is shifted towards quinol formation at pH 10.5.
Figure 5.
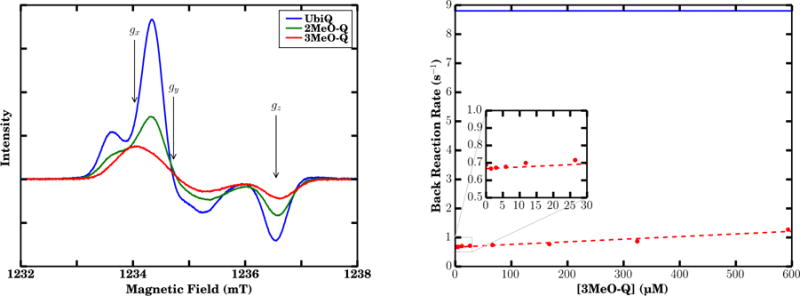
EPR and competitive binding assay. (Left) Continuous wave (CW) Q-band EPR spectra of quinone species formed in borohydride reduced RCs reconstituted with MMQs at pH 10.5. Spectral components gx, gy, and gz are expected to appear where indicated. Experimental settings: microwave frequency 34.63 GHz, modulation amplitude 0.2 mT, temperature 90 K. (Right) Observed back reaction rate constant as a function of 3MeO-Q concentration in RCs, where 3MeO-Q competes with UbiQ-4 to act as QB. The data are essentially linear (red) across the concentration range considered. Shown in blue is the QA back reaction rate (8.8 s−1) for these RCs when QB is unoccupied. Sample conditions: 1.6 μM RC, 3 μM UbiQ-4, 0.045 % LDAO, 10 mM TRIS, pH 7.8.
In contrast, when the RC is reconstituted with 3MeO-Q, no splittings indicating formation of the biradical are observed. Instead, independent pulsed EPR measurements assigned this signal to based on its similarity to previously determined spectra rather than (64, 65) (Fig. S3). Borohydride is a two-electron donor and does not react with the one-electron donor-acceptor QA. Therefore, for RCs reconstituted with 3MeO-Q, could only have been formed by electron disproportionation from . is necessarily formed at least transiently during this process, and the lack of any observable signal indicates this semiquinone is highly unstable and dissociates quickly upon biradical formation. This is in contrast to UbiQ-10 and 2MeO-Q, where is stable enough to observe the biradical. Evidently, the 2-methoxy group plays a substantial role in the binding affinity of UbiQ in its semiquinone form to the QB binding pocket.
The weaker QB binding affinity of 3MeO-Q suggested by the CW Q-band EPR experiments can be quantitated with a competitive binding assay. By titrating in non-functional 3MeO-Q and observing the rate of charge recombination, we can estimate the relative binding affinities of 3MeO-Q and UbiQ. In our case, a back reaction rate of 8.8 s−1 was found for RCs with only QA activity, and upon addition of 3 μM UbiQ-4 to activate QB, the rate decreased to 0.7 s−1. Addition of 3MeO-Q, which inhibits QB activity, is expected to increase the back reaction rate from 0.7 s−1 (up to a maximum of 8.8 s−1) as it competes with the UbiQ-4 bound at the QB site. An increase in the back reaction rate constant is observed as a function of 3MeO-Q concentration (Fig. 5). However, the inhibition of QB activity by 3MeO-Q is very weak, and essentially linear over the concentration range considered. The binding of 3MeO-Q for the QB site is estimated to be more than 1000 times weaker than that of UbiQ-4.
These experimental results are qualitatively consistent with the TI calculations, however are inconsistent in terms of their magnitude, with computed binding affinity differences that are significantly smaller than what experiment would suggest. Nevertheless, the overall conclusion and trends between the methods are the same; there is some protein-quinone interaction that makes 3MeO-Q binding unfavorable, which we will detail below through our investigation of the equilibrium simulations.
Bound Quinone Conformations
In order to characterize structural dynamics of the quinones within their RC binding sites, we have analyzed the trajectories resulting from the equilibrium MD simulations of membrane-bound RCs. We observe modulation of specific interactions unique to each quinone species occupying the QA and QB sites. The primary stabilizing interactions between the RC and the quinones are known to be mediated by hydrogen bonds, and the observed interactions form a superset over the interactions determined through crystallographic (19, 20, 66) and EPR experiments (64, 67–69). We observe two predominant hydrogen bonds between the protein and the carbonyl oxygens of the quinones in their respective sites, as well as protein-methoxy interactions in QB (Table 3). The interactions are dependent on the unique electronic environment of the quinone around itself (Fig. S4). The specific hydrogen bonding interactions are detailed in the sections to follow.
Table 3.
Hydrogen bond interactions between quinones in the QA and QB sites and the surrounding protein. Specific interactions are labeled according to the quinone atom using IUPAC nomenclature (Fig. 2). The atom on the protein residue that participates in the hydrogen bond is also specified. The percentage of time during the simulations when the hydrogen bond was formed, defined to exist when the donor and acceptor heavy atoms are within 3.2 Å and the hydrogen is within 30° of the line between them, are reported. Note that 2MeO-Q and 3MeO-Q have blank entries in the QB site that correspond to the hydrogen bonds that are missing due to the absence of the appropriate hydrogen bond acceptor atom (O2 in the case of 3MeO-Q and O3 in the case of 2MeO-Q). In these cases, the interaction distance is calculated to the methyl carbon that replaces the methoxy oxygen. Animations of the quinones in the QA and QB sites are provided as Supporting Information.
| Q-site:atom | RC-residue:atom | Hydrogen Bond Probability | Average Interaction Distance (Å) | ||||
|---|---|---|---|---|---|---|---|
| UbiQ | 2MeO-Q | 3MeO-Q | UbiQ | 2MeO-Q | 3MeO-Q | ||
| QA:O1 | AlaM260:N | 60.36 | 36.36 | 79.77 | 2.91 ± 0.00 | 3.15 ± 0.05 | 2.89 ± 0.01 |
| QA:O4 | HisM219:ND1 | 59.53 | 80.98 | 64.93 | 3.11 ± 0.02 | 2.92 ± 0.01 | 3.06 ± 0.01 |
|
| |||||||
| QB:O1 | IleL224:N | 61.90 | 39.45 | 51.37 | 2.97 ± 0.01 | 3.06 ± 0.02 | 3.07 ± 0.03 |
| QB:O2 | GlyL225:N | 17.66 | 4.73 | –– | 3.31 ± 0.04 | 3.27 ± 0.01 | 3.72 ± 0.04 |
| QB:O3 | HisL190:ND1 | 0.34 | –– | 3.93 | 4.28 ± 0.03 | 4.50 ± 0.02 | 4.25 ± 0.12 |
| QB:O4 | HisL190:ND1 | 38.37 | 75.08 | 23.19 | 3.07 ± 0.03 | 2.89 ± 0.01 | 3.23 ± 0.06 |
QA site
In QA, the only observed interactions are well defined hydrogen bonds from AlaM260 and HisM219 to the two quinone carbonyl oxygens, with no strong hydrogen bonds between the methoxy groups and the RC. These interactions are well described by simple electrostatics (70), and have been extensively characterized in functional and crystallographic studies (67), and are also maintained in our simulations, as reflected by the short inter-atomic distances between hydrogen bonding partners in QA (Fig. 6). The interaction distances observed in our simulations are very close to the interaction distances seen in prior QM/MM studies of neutral UbiQ (70, 71). The small differences can be attributed to thermal fluctuations of the system in our simulations, as opposed to the minimized geometries in the QM/MM calculations (70, 71). The distance between QA:O4 and HisM219:ND1 is 3.114 ± 0.001 Å, compared to 2.87 Å (70) and 2.81 Å (71). The distance between QA:O1 and AlaM260:N is 2.908 ± 0.001 Å, compared to 2.84 Å (70) and 2.95 Å (71). The overall sum of the distances between interaction partners in our simulations appears to be nearly conserved, with the longer interaction distance between QA:O1 and AlaM260 in 2MeO-Q compensated by the closer interaction of 2MeO-Q with HisM219, a relationship that suggests that the thermal stochastic motion of the quinone is along the vector connecting AlaM260 and HisM219.
Figure 6.
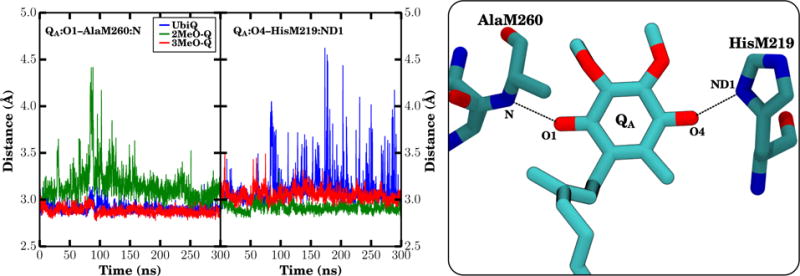
Interaction distances for carbonyl oxygen interactions in QA. The distance between the heavy atoms for each specific interaction was monitored over all three equilibrium trajectories (left). UbiQ is shown in blue, 2MeO-Q in green, and 3MeO-Q in red. Individual datapoints are the running average over 100 ps of trajectory (the average of 50 2 ps frames). On the right is a representative snapshot highlighting the exact distances that were measured. Since distances were measured only between heavy atoms, hydrogens are not shown.
The simulations suggest a dearth of specific interaction partners for the methoxy oxygens in QA. Other than steric interactions with the protein environment, no specific interactions were observed to modulate the methoxy dihedral angle. As a result, the exchange between the two orientations relative to the membrane plane is quite rapid, and is observed frequently in our equilibrium simulations (Fig. 7 and Table S2).
Figure 7.
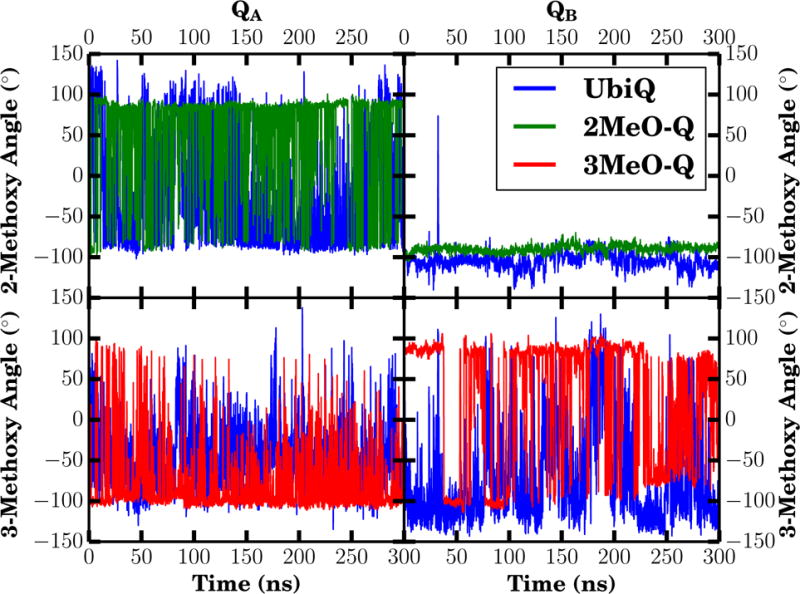
Methoxy dihedral angle over time for both QA (left) and QB (right). The dihedral angle for both 2- (top) and 3- (bottom) methoxy groups is measured with respect to the adjacent carbonyl carbon, C1 for the 2-methoxy group, and C4 for the 3-methoxy group. Individual datapoints are the running average over 100 ps of trajectory (the mean of 50 frames with a 2 ps interval). The corresponding distributions of these dihedral angles are also shown in Fig. 4.
QB site
The quinone occupying the QB site has a different functional role than QA, as it is the quinone that is reduced to quinol and exchanges with the quinone pool in the membrane. However the primary quinone-protein interactions observed in the QB site are quinone carbonyl and protein interactions analogous to the interactions in the QA site. The hydrogen bond between the quinone carbonyl oxygen QB:O4 and HisL190 is well established (66). The identity of the hydrogen bonding partner(s) opposite HisL190 in QB is a matter of debate. From available crystal structures, it is ambiguous as to which residues might form interactions with the carbonyl oxygen QB:O1 (20, 66). Some structures also show the quinone in a nonfunctional site distal to the iron but still within the RC, rather than in the site proximal to the iron which is thought to be the active state. For structures where the quinone is proximal to the iron, SerL223, IleL224, and GlyL225 have each been suggested as potential candidates for the interaction partner with QB:O1. We do not detect any significant interaction between SerL223 and the quinone within our simulations. SerL223 has been suggested by mutagenesis and EPR experiments (72–74) to be involved in proton transfer from solution to the quinone. When AspL213 is deprotonated in our simulations, SerL223 interacts with AspL213, a state that has previously been shown computationally to be favored for deprotonated AspL213 (73, 75, 76). The most significant O1 interactions are formed with IleL224 across all three quinones simulated (Table 3 and Figs. 8 and 9).
Figure 8.
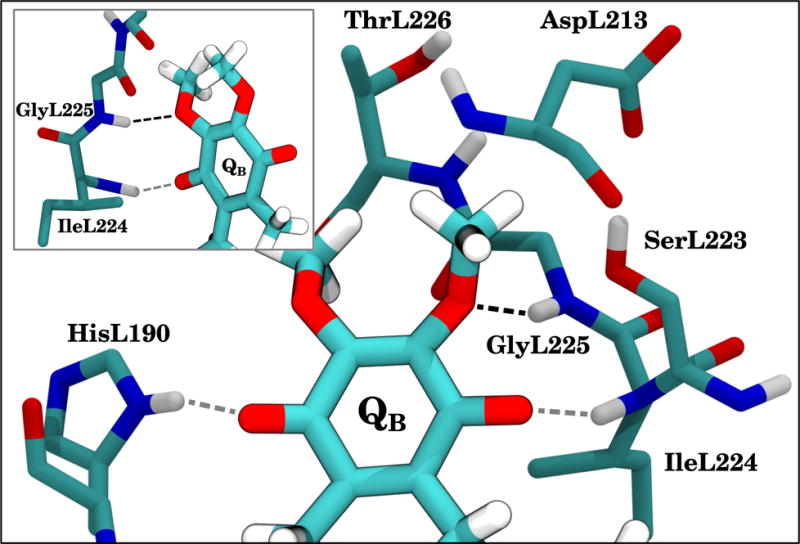
The quinone occupying the QB site, along with its interaction partners and other relevant residues. Carbons are cyan, oxygens are red, nitrogens are blue, and hydrogens are white. UbiQ is drawn with a black outline and more brightly than the surrounding protein residues. The three predominant hydrogen bonds are indicated by dashed lines. The 2-methoxy oxygen interaction with GlyL225 is black, while the other hydrogen bonds are gray. The hydrogen bonds to GlyL225 and IleL224 are highlighted in the inset, which shows a rotated view of the main figure with only L224–L226 provided for context.
Figure 9.
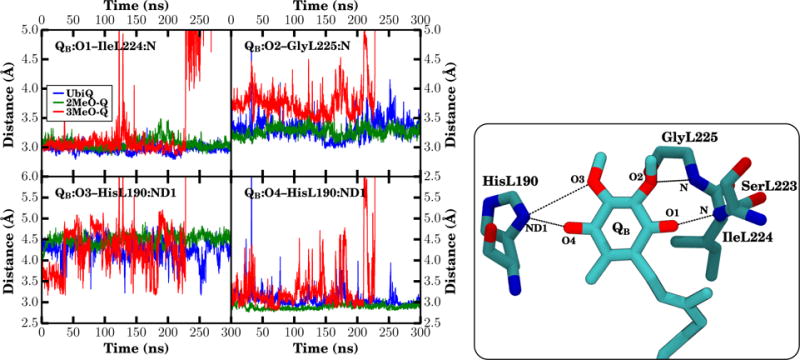
Interaction distances for oxygen interactions in QB. (Right) The distance between the heavy atoms for each specific interaction was monitored over all three equilibrium trajectories. If the oxygen is missing for a particular interaction, i.e., when a methyl group replaces a methoxy group in MMQs, the distance was determined based on the methyl carbon that replaced it. Distances for UbiQ, 2MeO-Q, and 3MeO-Q are shown in blue, green, and red in the timeseries. (Left) A snapshot highlighting the specific distances measured. Since distances were measured only between heavy atoms, hydrogens are not shown. Note that 3MeO-Q moves to the distal site after 225 ns, shifting the interaction distances up by 4–6 Å (see also Fig. S6). Individual datapoints are the running average over 100 ps of trajectory (the average of 50 frames with a 2 ps interval).
In addition to the carbonyl interactions, our simulations suggest an interaction unique to the QB site between the 2-methoxy oxygen and the protein environment. Specifically, there is a detectable and prevalent hydrogen bond between QB:O2 and the backbone amino group of GlyL225 (Table 3), with the methoxy oxygen as the acceptor of the amide hydrogen (Fig. 8). Deviations in the interaction distance are small around its equilibrium length of ~ 3.3 Å in the UbiQ and 2MeO-Q simulations where the 2-methoxy oxygen is present (Fig. 9 and Table 3). Due to the electrostatic interaction with GlyL225, the 2-methoxy group is effectively locked in place, as it cannot flip without disrupting the favorable hydrogen bond and placing the methoxy methyl into the space occupied by GlyL225. As a result, only a single instance of the 2-methoxy flipping in the QB site was observed (Fig. 7 and Table S2). The hydrogen bond between GlyL225 and the methoxy oxygen in QB may be the structural mechanism whereby the 2-methoxy dihedral angle is kept further out of plane, thereby breaking the symmetry between the QA and QB quinones and is essential (9) for generating the observed 60–80 mV redox potential difference (3, 4). When the methoxy group is out of plane, it withdraws electrons from the ring, raising the redox potential relative to an in-plane conformation where the methoxy oxygen p-orbitals conjugate with those in the ring, donating electrons instead, particularly to C3 of the ring (Fig. S2B). Prior calculations have shown that this effect contributes in excess of 160 mV to the redox potential difference between QA and QB (9). Thus this hydrogen bond may be essential to generating a redox potential difference for efficient electron transfer between the two quinones.
In 3MeO-Q, where the 2-methoxy group is replaced by a methyl, the hydrogen bonding interaction to GlyL225 is abolished. The observed distances between the QB:O1 carbonyl oxygen and IleL224 are comparable across all three quinones, the distance between GlyL225 and the 2-methyl carbon in 3MeO-Q is increased, as otherwise the hydrogens from the methyl and the backbone of this residue would clash (Fig. 9 and Table 3). The 3-methoxy oxygen of 3MeO-Q forms sporadic interactions with HisL190, as indicated by interaction distances below 3.5 Å in Fig. 9, and this competing interaction lengthens the average distance between the O4 carbonyl oxygen and HisL190 (Table 3).
The observed small changes in the interaction pattern brought about by replacing a methoxy group with a methyl group cause minor perturbations to the position of the quinone in the QB site. The RMSD relative to the available crystallographic structures for quinones within the QB site is rather small (Table 4 and Fig. S7), with a mean RMSD of less than 1 Å between the ring carbons of the quinone headgroups seen in simulation and conformations identified crystallographically. Despite being small, the RMSD in the case of 3MeO-Q is substantially larger than the RMSDs for UbiQ or 2MeO-Q, exhibiting larger average displacements and deviations from the crystallographic proximal (active, quinone near the iron) states (Table 4). We hypothesize that the origin of the increased displacement is due to steric interactions between GlyL225 and the methyl group replacing the 2-methoxy group in 3MeO-Q changing the equilibrium position slightly, as supported by the altered interaction distances in QB (Table 3). The binding site perturbations for 3MeO-Q in the QB site support the free energy calculations that suggest a lower binding affinity for 3MeO-Q relative to the other simulated quinones (Table 2). The larger variability in quinone position for 3MeO-Q suggests that the transition barrier between the sites proximal and distal to the iron (Fig. 1) in QB may be easily surmountable at physiological temperatures, which is strongly supported by the observed movement of 3MeO-Q to the distal site after 225 ns (Figs. 9, S6, and S7). The expectation is that 3MeO-Q would have a substantially lower mean lifetime (<~ 1μs) within the proximal position of the QB site relative to either UbiQ or 2MeO-Q (> 1 ms) (77).
Table 4.
RMSD and displacement (d), both in Å, for the quinone ring carbons occupying the QB site calculated from the simulations relative to the proximal QB position observed in the 32 R. sphaeroides RC crystal structures with better than 2.8 Å resolution. The reported mean (μ) and standard deviations (σ) exclude when 3MeO-Q was in the distal site, however for UbiQ and 2MeO-Q, the entire 300 ns trajectory was considered when computing the average.
| Quinone | RMSD | d |
|---|---|---|
| UbiQ | 0.75 ± 0.27 | 0.65 ± 0.29 |
| 2MeO-Q | 0.72 ± 0.18 | 0.57 ± 0.19 |
| 3MeO-Q | 0.97 ± 0.38 | 0.89 ± 0.40 |
Interaction partners for SerL223 after protonation of AspL213
In the simulations described to this point, AspL213 was deprotonated, and was the predominant hydrogen bonding partner for the hydroxyl group of SerL223. SerL223 has been established to play a role in proton transfer, providing a hydrogen to reduce the semiquinone radical to form the appropriate quinol. The orientation of SerL223 has been shown to depend on several factors. Some crystallographic structures suggest that SerL223 interacts via a hydrogen bond to the quinone (19, 20, 66) whereas electrostatics calculations suggest that deprotonated AspL213 might be the significant partner to SerL223 (73, 75, 76), consistent with what we observe in our deprotonated simulations. In our additional simulation of UbiQ in the QA and QB sites with protonated AspL213, SerL223 shifts from interacting with AspL213 to ArgL217 (Table S5). Interactions between SerL223 and UbiQ still form, but only for a small fraction of time (< 0.2%), contrary to what might be inferred from the shorter bond between SerL223 and UbiQ seen crystalographically (Table S3). Given the role of GlyL225 in interacting with the 2-methoxy group and no observed SerL223/UbiQ interactions, our interpretation is that the predominant QB quinone carbonyl interaction across from HisL190 is IleL224 in the neutral state. This differs from the semiquinone state, where GlyL225 has been suggested to be the primary carbonyl interaction parter (64), and may indicate a small quinone rearrangement upon semiquinone formation.
Conclusions
After reparameterization of the quinone force field, we have investigated the specific interactions between the protein environment and UbiQ that might be responsible for breaking the symmetry and generating the redox potential difference in the two quinone binding sites within the RC of Rhodobacter sphaeroides. The simulations performed are the longest simulations to date of a membrane-bound bacterial RC by two orders of magnitude, with 300 ns of simulation for each of the three quinone analogs studied. These simulations indicate that the 2-methoxy oxygen of the QB quinone forms an interaction with the backbone amide of GlyL225, while the carbonyl oxygen opposite of HisL190 hydrogen bonds with the backbone of IleL224. This interaction pattern serves to break the symmetry of neutral UbiQ between QA and QB by locking the 2-methoxy dihedral angle of QB in a position conducive to electron transfer from QA to QB. 3MeO-Q lacks this 2-methoxy oxygen, and therefore exhibits weaker binding to the QB site than either UbiQ or 2MeO-Q, consistent with its observed non-functionality as an electron acceptor in QB (12), the weak binding shown through TI calculations and spontaneous unbinding in equilibrium, its poor competition for the QB site, and lack of any observable biradical signal in the CW EPR spectrum upon borohydride reduction at pH 10.5. In addition, we determined that SerL223 does not form direct interactions with the neutral quinone either with or without the protonation of AspL213, suggesting that its role as the proton donor in the formation of quinol is mediated by the formation of the semiquinone or biradical, as has been postulated previously (75). These mechanistic details may not be unique to the RC, and are a clear example of the detailed interactions that lie at the heart of protein redox chemistry.
Supplementary Material
Acknowledgments
This research used resources of the National Energy Research Scientific Computing Center (NERSC), which is supported by the Office of Science of the U.S. Department of Energy under Contract No. DE-AC02-05CH11231. This research also was conducted through the use of the parallel computing resource Taub provided by the Computational Science and Engineering Program at the University of Illinois. Additional simulations were performed using Stampede, hosted at the Texas Advanced Computing Center (TACC) at The University of Texas at Austin through XSEDE (grant number MCA06N060 to E.T.) funded by NSF.
The computational work was supported by the grants from NIH to E.T. (U54–GM087519, and P41–RR05969), grants from NSF to C.A.W. (MCB-0818121), and the DOE CSGF Fellowship to J.V.V. (DE-FG02-97ER25308). S.A.D. acknowledges grant DE-FG02-08ER15960 from the U.S. Department of Energy, Office of Science, Office of Basic Energy Sciences, Chemical Sciences, Geosciences and Biosciences Division to support the EPR studies. J.V.V. and A.T.T. would like to acknowledge past support from the NIH Molecular Biophysics Training Grant.
Footnotes
Supporting Information Available
The final topology and parameter files for quinones are provided. There is additional discussion regarding the need for orientational restraints during TI calculations and the origins of the correction in Table 2. In addition, large or ancilliary tables and figures are added in the Supporting Information, as well as animations detailing the interactions in the QA and QB sites. This material is available free of charge via the Internet at http://pubs.acs.org/.
References
- 1.Wraight CA, Gunner MR. The Purple Phototrophic Bacteria. In: Hunter CN, Daldal F, Thurnauer MC, Beatty JT, editors. Advances in Photosynthesis and Respiration. Vol. 28. Springer; Netherlands: 2009. pp. 379–405. [Google Scholar]
- 2.Okamura M, Paddock M, Graige M, Feher G. Proton and electron transfer in bacterial reaction centers. Biochim Biophys Acta. 2000;1458:148–163. doi: 10.1016/s0005-2728(00)00065-7. [DOI] [PubMed] [Google Scholar]
- 3.Wraight CA. Electron acceptors of bacterial photosynthetic reaction centers. II. H+ binding coupled to secondary electron transfer in the quinone acceptor complex. Biochim Biophys Acta. 1979;548:309–327. doi: 10.1016/0005-2728(79)90138-5. [DOI] [PubMed] [Google Scholar]
- 4.Kleinfeld D, Okamura MY, Feher G. Electron transfer in reaction centers of Rhodopseudomonas sphaeroides. I. Determination of the charge recombination pathway of and free energy and kinetic relations between and . Biochim Biophys Acta. 1984;766:126–140. doi: 10.1016/0005-2728(84)90224-x. [DOI] [PubMed] [Google Scholar]
- 5.Prince RC, Dutton P, Bruce J. Electrochemistry of ubiquinones. FEBS Lett. 1983;160:273–276. [Google Scholar]
- 6.Allen JP, Feher G, Yeates TO, Komiya H, Rees DC. Structure of the reaction center from Rhodobacter sphaeroides R-26: the cofactors. Proc Natl Acad Sci USA. 1987;84:5730–5734. doi: 10.1073/pnas.84.16.5730. [DOI] [PMC free article] [PubMed] [Google Scholar]
- 7.Ke B. Photosynthesis: Photobiochemistry and Photobiophysics. Kluwer Academic Publishers; Boston, MA: 2001. [Google Scholar]
- 8.Taguchi AT, O’Malley PJ, Wraight CA, Dikanov SA. Conformational differences between the methoxy groups of QA and QB site ubisemiquinones in bacterial reaction centers: a key role for methoxy group orientation in modulating ubiquinone redox potential. Biochemistry. 2013;52:4648–4655. doi: 10.1021/bi400489b. [DOI] [PMC free article] [PubMed] [Google Scholar]
- 9.Taguchi AT, Mattis AJ, O’Malley PJ, Dikanov SA, Wraight CA. Tuning Cofactor Redox Potentials: The 2-Methoxy Dihedral Angle Generates a Redox Potential Difference of > 160 mV between the Primary (QA) and Secondary (QB) Quinones of the Bacterial Photosynthetic Reaction Center. Biochemistry. 2013;52:7164–7166. doi: 10.1021/bi4011896. [DOI] [PMC free article] [PubMed] [Google Scholar]
- 10.de Almeida WB, Taguchi AT, Dikanov SA, Wraight CA, O’Malley PJ. The 2-Methoxy Group Orientation Regulates the Redox Potential Difference between the Primary (QA) and Secondary (QB) Quinones of Type II Bacterial Photosynthetic Reaction Centers. J Phys Chem Lett. 2014;5:2506–2509. doi: 10.1021/jz500967d. [DOI] [PMC free article] [PubMed] [Google Scholar]
- 11.Zhang X, Gunner MR. Affinity and activity of non-native quinones at the QB site of bacterial photosynthetic reaction centers. Photosyn Res. 2013 doi: 10.1007/s11120-013-9850-1. [DOI] [PMC free article] [PubMed] [Google Scholar]
- 12.Wraight CA, Vakkasoglu AS, Poluektov Y, Mattis AJ, Nihan D, Lip-shutz BH. The 2-methoxy group of ubiquinone is essential for function of the acceptor quinones in reaction centers from Rba. sphaeroides. Biochim Biophys Acta. 2008;1777:631–636. doi: 10.1016/j.bbabio.2008.04.025. [DOI] [PubMed] [Google Scholar]
- 13.Ceccarelli M, Procacci P, Marchi M. An ab initio force field for the cofactors of bacterial photosynthesis. J Comp Chem. 2003;24:129–142. doi: 10.1002/jcc.10198. [DOI] [PubMed] [Google Scholar]
- 14.Damjanović A, Kosztin I, Kleinekathoefer U, Schulten K. Excitons in a Photosynthetic Light-Harvesting System: A Combined Molecular Dynamics, Quantum Chemistry and Polaron Model Study. Phys Rev E. 2002;65:031919. doi: 10.1103/PhysRevE.65.031919. [DOI] [PubMed] [Google Scholar]
- 15.Nonella M, Schulten K. Molecular Dynamics Simulation of Electron Transfer in Proteins: Theory and Application to QA → QB Transfer in the Photosynthetic Reaction Center. J Phys Chem. 1991;95:2059–2067. [Google Scholar]
- 16.Cino EA, Choy WY, Karttunen M. Comparison of Secondary Structure Formation Using 10 Different Force Fields in Microsecond Molecular Dynamics Simulations. J Chem Theor Comp. 2012;8:2725–2740. doi: 10.1021/ct300323g. [DOI] [PMC free article] [PubMed] [Google Scholar]
- 17.Vanommeslaeghe K, Hatcher E, Acharya C, Kundu S, Zhong S, Shim J, Darian E, Guvench O, Lopes P, Vorobyov I, MacKerell AD., Jr CHARMM General Force Field: A force field for drug-like molecules compatible with the CHARMM all-atom additive biological force fields. J Comp Chem. 2010;31:671–690. doi: 10.1002/jcc.21367. [DOI] [PMC free article] [PubMed] [Google Scholar]
- 18.Mayne CG, Saam J, Schulten K, Tajkhorshid E, Gumbart JC. Rapid parameterization of small molecules using the Force Field Toolkit. J Comp Chem. 2013;34:2757–2770. doi: 10.1002/jcc.23422. [DOI] [PMC free article] [PubMed] [Google Scholar]
- 19.Axelrod HL, Abresch EC, Paddock ML, Okamura MY, Feher G. Determination of the binding sites of the proton transfer inhibitors Cd2+ and Zn2+ in bacterial reaction centers. Proc Natl Acad Sci USA. 2000;97:1542–1547. doi: 10.1073/pnas.97.4.1542. [DOI] [PMC free article] [PubMed] [Google Scholar]
- 20.Koepke J, Krammer EM, Klingen AR, Sebban P, Ullmann GM, Fritzsch G. pH modulates the quinone position in the photosynthetic reaction center from Rhodobacter sphaeroides in the neutral and charge separated states. J Mol Biol. 2007;371:396–409. doi: 10.1016/j.jmb.2007.04.082. [DOI] [PubMed] [Google Scholar]
- 21.Phillips JC, Braun R, Wang W, Gumbart J, Tajkhorshid E, Villa E, Chipot C, Skeel RD, Kale L, Schulten K. Scalable Molecular Dynamics with NAMD. J Comp Chem. 2005;26:1781–1802. doi: 10.1002/jcc.20289. [DOI] [PMC free article] [PubMed] [Google Scholar]
- 22.Best RB, Zhu X, Shim J, Lopes PEM, Mittal J, Feig M, MacKerell AD. Optimization of the Additive CHARMM All-Atom Protein Force Field Targeting Improved Sampling of the Backbone ϕ, ψ and Side-Chain χ1 and χ2 Dihedral Angles. J Chem Theor Comp. 2012;8:3257–3273. doi: 10.1021/ct300400x. [DOI] [PMC free article] [PubMed] [Google Scholar]
- 23.Mackerell AD. Empirical force fields for biological macromolecules: Overview and issues. J Comp Chem. 2004;25:1584–1604. doi: 10.1002/jcc.20082. [DOI] [PubMed] [Google Scholar]
- 24.MacKerell AD, Jr, et al. All-atom empirical potential for molecular modeling and dynamics studies of proteins. J Phys Chem B. 1998;102:3586–3616. doi: 10.1021/jp973084f. [DOI] [PubMed] [Google Scholar]
- 25.Klauda JB, Venable RM, Freites JA, O’Connor JW, Tobias DJ, Mondragon-Ramirez C, Vorobyov I, MacKerell AD, Jr, Pastor RW. Update of the CHARMM all-atom additive force field for lipids: Validation on six lipid types. J Phys Chem B. 2010;114:7830–7843. doi: 10.1021/jp101759q. [DOI] [PMC free article] [PubMed] [Google Scholar]
- 26.Jorgensen WL, Chandrasekhar J, Madura JD, Impey RW, Klein ML. Comparison of simple potential functions for simulating liquid water. J Chem Phys. 1983;79:926–935. [Google Scholar]
- 27.Autenrieth F, Tajkhorshid E, Baudry J, Luthey-Schulten Z. Classical force field parameters for the heme prosthetic group of cytochrome c. J Comp Chem. 2004;25:1613–1622. doi: 10.1002/jcc.20079. [DOI] [PubMed] [Google Scholar]
- 28.Darden T, York D, Pedersen LG. Particle mesh Ewald: An N·log(N) method for Ewald sums in large systems. J Chem Phys. 1993;98:10089–10092. [Google Scholar]
- 29.Essmann U, Perera L, Berkowitz ML, Darden T, Lee H, Pedersen LG. A smooth particle mesh Ewald method. J Chem Phys. 1995;103:8577–8593. [Google Scholar]
- 30.Miyamoto S, Kollman PA. SETTLE: An Analytical Version of the SHAKE and RATTLE Algorithm for Rigid Water Molecules. J Comp Chem. 1992;13:952–962. [Google Scholar]
- 31.Martyna GJ, Tobias DJ, Klein ML. Constant Pressure Molecular Dynamics Algorithms. J Chem Phys. 1994;101:4177–4189. [Google Scholar]
- 32.Feller SE, Zhang Y, Pastor RW, Brooks BR. Constant pressure molecular dynamics simulation: The Langevin piston method. J Chem Phys. 1995;103:4613–4621. [Google Scholar]
- 33.Humphrey W, Dalke A, Schulten K. VMD – Visual Molecular Dynamics. J Mol Graphics. 1996;14:33–38. doi: 10.1016/0263-7855(96)00018-5. [DOI] [PubMed] [Google Scholar]
- 34.Nilsson JA, Lyubartsev A, Eriksson LA, Laaksonen A. Molecular dynamics simulations of ubiquinone; a survey over torsional potentials and hydrogen bonds. Mol Phys. 2001;99:1795–1804. [Google Scholar]
- 35.MacKerell AD, Brooks B, Brooks CL, Nilsson L, Roux B, Won Y, Karplus M. Encyclopedia of Computational Chemistry. John Wiley & Sons, Ltd; 2002. [Google Scholar]
- 36.Saer RG, Hardjasa A, Rosell FI, Mauk AG, Murphy MEP, Beatty JT. Role of Rhodobacter sphaeroides photosynthetic reaction center residue M214 in the composition, absorbance properties, and conformations of HA and BA cofactors. Biochemistry. 2013;52:2206–2217. doi: 10.1021/bi400207m. [DOI] [PubMed] [Google Scholar]
- 37.Vasilieva LG, Fufina TY, Gabdulkhakov AG, Leonova MM, Khatypov RA, Shuvalov VA. The site-directed mutation I(L177)H in Rhodobacter sphaeroides reaction center affects coordination of PA and BB bacteriochlorophylls. Biochim Biophys Acta. 2012;1817:1407–1417. doi: 10.1016/j.bbabio.2012.02.008. [DOI] [PubMed] [Google Scholar]
- 38.Gibasiewicz K, Pajzderska M, Potter JA, Fyfe PK, Dobek A, Brettel K, Jones MR. Mechanism of recombination of the radical pair in mutant Rhodobacter sphaeroides reaction centers with modified free energy gaps between and . J Phys Chem B. 2011;115:13037–13050. doi: 10.1021/jp206462g. [DOI] [PubMed] [Google Scholar]
- 39.Frolov D, Marsh M, Crouch LI, Fyfe PK, Robert B, van Grondelle R, Hadfield A, Jones MR. Structural and spectroscopic consequences of hexa-coordination of a bacteriochlorophyll cofactor in the Rhodobacter sphaeroides reaction center. Biochemistry. 2010;49:1882–1892. doi: 10.1021/bi901922t. [DOI] [PubMed] [Google Scholar]
- 40.Burie J-R, Boullais C, Nonella M, Mioskowski C, Nabedryk E, Breton J. Importance of the Conformation of Methoxy Groups on the Vibrational and Electrochemical Properties of Ubiquinones. J Phys Chem B. 1997;101:6607–6617. [Google Scholar]
- 41.Asher JR, Kaupp M. Car-Parrinello molecular dynamics simulations and EPR property calculations on aqueous ubisemiquinone radical anion. Theor Chem Acc. 2008;119:477–487. [Google Scholar]
- 42.Boullais C, Nabedryk E, Burie JR, Nonella M, Mioskowski C, Breton J. Site-specific isotope labeling demonstrates a large mesomeric resonance effect of the methoxy groups on the carbonyl frequency in ubiquinones. Photosyn Res. 1998;55:247–252. [Google Scholar]
- 43.Zwanzig RW. High-temperature equation of state by a perturbation method. I. Nonpolar Gases. J Chem Phys. 1954;22:1420–1426. [Google Scholar]
- 44.Rich PR, Harper R. Partition coefficients of quinones and hydroquinones and their relation to biochemical reactivity. FEBS Lett. 1990;269:139–144. doi: 10.1016/0014-5793(90)81139-f. [DOI] [PubMed] [Google Scholar]
- 45.Liu P, Dehez F, Cai W, Chipot C. A Toolkit for the Analysis of Free-Energy Perturbation Calculations. J Chem Theor Comp. 2012;8:2606–2616. doi: 10.1021/ct300242f. [DOI] [PubMed] [Google Scholar]
- 46.Bennett CH. Efficient estimation of free energy differences from Monte Carlo data. J Comp Phys. 1976;22:245–268. [Google Scholar]
- 47.Hunter JD. Matplotlib: A 2D graphics environment. Comput in Sci and Eng. 2007;9:90–95. [Google Scholar]
- 48.Kirkwood JG. Statistical Mechanics of Fluid Mixtures. J Chem Phys. 1935;3:300. [Google Scholar]
- 49.Kollman P. Free energy calculations: Applications to chemical and biochemical phenomena. Chem Rev. 1993;93:2395–2417. [Google Scholar]
- 50.Chipot C, Pohorille A. Free Energy Calculations: Theory and Applications in Chemistry and Biology. Springer; 2007. [Google Scholar]
- 51.Axelsen PH, Li D. Improved convergence in dual-topology free energy calculations through use of harmonic restraints. J Comp Chem. 1998;19:1278–1283. [Google Scholar]
- 52.Deng Y, Roux B. Computations of Standard Binding Free Energies with Molecular Dynamics Simulations. J Phys Chem B. 2009;113:2234–2246. doi: 10.1021/jp807701h. [DOI] [PMC free article] [PubMed] [Google Scholar]
- 53.Ellers PHC, Marx BD. Flexible Smoothing with B-splines and Penalties. Stat Sci. 1996;11:89–121. [Google Scholar]
- 54.Steinbrecher T, Joung I, Case DA. Soft-core potentials in thermodynamic integration: comparing one- and two-step transformations. J Comp Chem. 2011;32:3253–3263. doi: 10.1002/jcc.21909. [DOI] [PMC free article] [PubMed] [Google Scholar]
- 55.Goldsmith JO, Boxer SG. Rapid isolation of bacterial photosynthetic reaction centers with an engineered poly-histidine tag. Biochim Biophys Acta – Bioener. 1996;1276:171–175. [Google Scholar]
- 56.Okamura MY, Isaacson RA, Feher G. Primary acceptor in bacterial photosynthesis: obligatory role of ubiquinone in photoactive reaction centers of Rhodopseudomonas spheroides. Proc Natl Acad Sci USA. 1975;72:3491–3495. doi: 10.1073/pnas.72.9.3491. [DOI] [PMC free article] [PubMed] [Google Scholar]
- 57.Calvo R, Abresch EC, Bittl R, Feher G, Hofbauer W, Isaacson RA, Lubitz W, Okamura MY, Paddock ML. EPR Study of the Molecular and Electronic Structure of the Semiquinone Biradical Q−A Q−B in Photosynthetic Reaction Centers from Rhodobacter sphaeroides. J Am Chem Soc. 2000;122:7327–7341. [Google Scholar]
- 58.Utschig LM, Greenfield SR, Tang J, Laible PD, Thurnauer MC. Influence of iron-removal procedures on sequential electron transfer in photosynthetic bacterial reaction centers studied by transient EPR spectroscopy. Biochemistry. 1997;36:8548–8558. doi: 10.1021/bi9630319. [DOI] [PubMed] [Google Scholar]
- 59.Shinkarev VP, Wraight CA. In: Photosynthetic Reaction Center. Deisenhofer J, Norris JR, editors. Academic Press; San Diego: 1993. p. 193. [Google Scholar]
- 60.Marenich AV, Kelly CP, Thompson JD, Hawkins GD, Chambers CC, Giesen DJ, Winget P, Cramer CJ, Truhlar DG. Minnesota Solvation Database. 2012 [Google Scholar]
- 61.Garrido NM, Economou IG, Queimada AJ, Jorge M, Macedo EA. Prediction of the n-hexane/water and 1-octanol/water partition coefficients for environmentally relevant compounds using molecular simulation. AIChE J. 2012;58:1929–1938. [Google Scholar]
- 62.Lyubartsev AP, Jacobsson SP, Sundholm G, Laaksonen A. Solubility of Organic Compounds in Water/Octanol Systems. A Expanded Ensemble Molecular Dynamics Simulation Study of log P Parameters. J Phys Chem B. 2001;105:7775–7782. [Google Scholar]
- 63.Scouras AD, Daggett V. The Dynameomics rotamer library: amino acid side chain conformations and dynamics from comprehensive molecular dynamics simulations in water. Prot Sci. 2011;20:341–352. doi: 10.1002/pro.565. [DOI] [PMC free article] [PubMed] [Google Scholar]
- 64.Taguchi AT, O’Malley PJ, Wraight CA, Dikanov SA. Nuclear hyperfine and quadrupole tensor characterization of the nitrogen hydrogen bond donors to the semiquinone of the QB site in bacterial reaction centers: a combined X- and S-band 14,15N ESEEM and DFT study. J Phys Chem B. 2014;118:1501–1509. doi: 10.1021/jp411023k. [DOI] [PMC free article] [PubMed] [Google Scholar]
- 65.Taguchi AT, O’Malley PJ, Wraight CA, Dikanov SA. Hyperfine and nuclear quadrupole tensors of nitrogen donors in the Q A site of bacterial reaction centers: Correlation of the histidine Nδ tensors with hydrogen bond strength. J Phys Chem B. 2014;118:9225–9237. doi: 10.1021/jp5051029. [DOI] [PMC free article] [PubMed] [Google Scholar]
- 66.Stowell MHB, Phillips TM, Rees DC, Soltis SM, Abresch E, Feher G. Light-induced structural changes in photosynthetic reaction center: Implications for mechanism of electron-proton transfer. Science. 1997;276:812–816. doi: 10.1126/science.276.5313.812. [DOI] [PubMed] [Google Scholar]
- 67.Flores M, Isaacson R, Abresch E, Calvo R, Lubitz W, Feher G. Protein-cofactor interactions in bacterial reaction centers from Rhodobacter sphaeroides R-26: II. Geometry of the hydrogen bonds to the primary quinone by 1H and 2H ENDOR spectroscopy. Biophys J. 2007;92:671–682. doi: 10.1529/biophysj.106.092460. [DOI] [PMC free article] [PubMed] [Google Scholar]
- 68.Martin E, Samoilova RI, Narasimhulu KV, Wraight CA, Dikanov SA. Hydrogen bonds between nitrogen donors and the semiquinone in the QB site of bacterial reaction centers. J Am Chem Soc. 2010;132:11671–11677. doi: 10.1021/ja104134e. [DOI] [PMC free article] [PubMed] [Google Scholar]
- 69.Martin E, Samoilova RI, Narasimhulu KV, Lin TJ, O’Malley PJ, Wraight CA, Dikanov SA. Hydrogen bonding and spin density distribution in the QB semiquinone of bacterial reaction centers and comparison with the QA site. J Am Chem Soc. 2011;133:5525–5537. doi: 10.1021/ja2001538. [DOI] [PMC free article] [PubMed] [Google Scholar]
- 70.Zhao N, Hastings G. On the nature of the hydrogen bonds to neutral ubiquinone in the QA binding site in purple bacterial photosynthetic reaction centers. J Phys Chem B. 2013;117:8705–8713. doi: 10.1021/jp403833y. [DOI] [PubMed] [Google Scholar]
- 71.Sinnecker S, Flores M, Lubitz W. Protein-cofactor interactions in bacterial reaction centers from Rhodobacter sphaeroides R-26: effect of hydrogen bonding on the electronic and geometric structure of the primary quinone. A density functional theory study. Phys Chem Chem Phys. 2006;8:5659–5670. doi: 10.1039/b612568a. [DOI] [PubMed] [Google Scholar]
- 72.Paddock ML, Flores M, Isaacson R, Chang C, Abresch EC, Okamura MY. ENDOR Spectroscopy Reveals A Light Induced Movement of the H-Bond from Ser-L223 Upon Forming the Semiquinone (QB) in Reaction Centers from Rhodobacter sphaeroides. Biochemistry. 2007;46:8234–8243. doi: 10.1021/bi7005256. [DOI] [PMC free article] [PubMed] [Google Scholar]
- 73.Ishikita H, Knapp EW. Variation of Ser-L223 hydrogen bonding with the QB redox state in reaction centers from Rhodobacter sphaeroides. J Am Chem Soc. 2004;126:8059–8064. doi: 10.1021/ja038092q. [DOI] [PubMed] [Google Scholar]
- 74.Zhu Z, Gunner MR. Energetics of quinone-dependent electron and proton transfers in Rhodobacter sphaeroides photosynthetic reaction centers. Biochemistry. 2005;44:82–96. doi: 10.1021/bi048348k. [DOI] [PubMed] [Google Scholar]
- 75.Martin E, Baldansuren A, Lin TJ, Samoilova RI, Wraight CA, Dikanov SA, O’Malley PJ. Hydrogen bonding between the QB site ubisemiquinone and Ser-L223 in the bacterial reaction center: a combined spectroscopic and computational perspective. Biochemistry. 2012;51:9086–9093. doi: 10.1021/bi300834w. [DOI] [PMC free article] [PubMed] [Google Scholar]
- 76.Alexov EG, Gunner MR. Calculated protein and proton motions coupled to electron transfer: Electron transfer from Q−A to QB in bacterial photosynthetic reaction centers. Biochemistry. 1999;38:8253–8270. doi: 10.1021/bi982700a. [DOI] [PubMed] [Google Scholar]
- 77.Mavelli F, Trotta M, Ciriaco F, Agostiano A, Giotta L, Italiano F, Milano F. The binding of quinone to the photosynthetic reaction centers: Kinetics and thermodynamics of reactions occurring at the QB-site in zwitterionic and anionic liposomes. Eur Biophys J. 2014;43:301–315. doi: 10.1007/s00249-014-0963-z. [DOI] [PubMed] [Google Scholar]
Associated Data
This section collects any data citations, data availability statements, or supplementary materials included in this article.