Abstract
Objective
How obesity affects the response to sepsis is not completely understood. We hypothesize that obesity alters adipose and hepatic tissue inflammation through STAT3 activation.
Methods
Male C57BL/6 mice at six-weeks of age were randomized to a high-fat (HFD) (60% kcal fat) or normal diet (ND) (16% kcal fat) for 6–7 weeks. Sepsis was then induced by cecal ligation and puncture (CLP) and animals were monitored for survival or sacrificed and tissue collected.
Results
HFD-fed mice gained more weight, had increased fat mass and were glucose intolerant compared to ND-fed mice. Obesity increased hepatic neutrophil infiltration and injury after sepsis. Obese mice had higher plasma leptin levels compared to non-obese mice. Adipose tissue expression of adiponectin receptor 2, TNFα and PPARγ were altered during sepsis and affected by obesity but the greatest change in adipose tissue expression was in leptin. Septic obese mice had lower plasma IL-17a, IL-23 and TNFα levels and increased hepatic STAT3 and Activator Protein-1 activation compared to non-obese septic mice. Ultimately, obese mice had a lower probability of survival following sepsis.
Conclusions
Obese mice are more susceptible to sepsis and have higher mortality, in part, through activation of the STAT3 signaling pathway and through AP-1 activation.
Keywords: obesity, sepsis, hepatic, high fat diet, adipose tissue
Introduction
Obesity is a significant public health problem and increases the risk for many comorbid disorders including sepsis (1). In a cohort of Medicare patients with severe sepsis 34% were overweight and 24% were obese or severely obese (2). Severe sepsis patients with obesity had more days in a healthcare facility and greater Medicare expenditures compared with non-obese patients (2). Critically ill patients with obesity also had longer durations of mechanical ventilation and ICU lengths of stay compared to non-obese critically ill subjects (3).
Subjects with obesity may actually have a survival advantage in certain diseases (obesity paradox). Patients with obesity had lower hospital mortality rates compared to non-obese patients (4). These findings are in contrast to early data suggesting an increase in morbidities and mortalities for subjects with obesity (5, 6). However, it is still unclear whether obesity is independently associated with mortality after critical illness as some are beginning to question the obesity paradox findings (7). Regardless of whether obesity is protective or detrimental, given the high prevalence of obesity, it is imperative to understand the mechanistic changes that occur during critical illness from sepsis.
Multiple studies demonstrate that obesity increases mortality in infectious animal models (8–10). Previous work from our laboratory demonstrates that short term (3wk), HFD-fed mice have more inflammation and higher mortality following sepsis compared to normal diet-fed mice (10). Other studies show contradictory findings on obesity-associated mortality after sepsis in that prolonged exposure to HFD leads to protection of sepsis-induced lung injury (11). Hyperleptinemia from mice fed a 12-week high-fat diet improved survival after polymicrobial sepsis (12). Therefore the impact of obesity on the outcomes from sepsis remains unclear and may involve the effects of leptin. Leptin is increased in obese mice and is important in energy metabolism and immune regulation (10, 13). Leptin acts through the Janus Kinase (JAK)/signal transducer and activator of transcription (STAT3) pathway.
We hypothesize that obesity increases the inflammatory response in sepsis through alteration of adipose and hepatic inflammation and activation of STAT3. The aim of the current study is to validate previous findings using a longer dietary intervention model and to identify important signaling pathways that occur in both obese and non-obese mice during sepsis.
Methods
Animal model
The investigations conformed to the Guide for the Care and Use of Laboratory Animals (14) and was approved by the Institutional Animal Care and Use Committee at Cincinnati Children’s Hospital Medical Center (CCHMC). The experimental groups consisted of male C57BL/6 mice at six-weeks of age from Charles River Laboratories International, Inc. (Wilmington, MA). Mice were housed in the animal facility at CCHMC. Food and water were provided ad libitum. Animals were randomized to high-fat diet (HFD) (TestDiet – 58Y1) (60% kcal provided by fat) or normal diet (ND) (Formulab – 5008) (16% kcal provided by fat) for 6–7 weeks.
Body weight and composition
Body weights were monitored twice weekly throughout the diet phase. Body composition was analyzed using NMR imaging by EchoMRI at the end of the 6–7 week diet phase (EchoMRI, Houston, Tx).
Glucose tolerance test
Intraperitoneal glucose tolerance tests (GTTs) were conducted after 6–7 weeks of feeding on HFD or ND. After a 6h fast, baseline blood glucose (250μl blood) was obtained from the tail vein. Mice then received a 2g/kg dextrose injection. Blood glucose (250μl blood) was assessed 15, 30, 45, 60 and 120min after injection.
Model of cecal ligation and puncture (CLP)
Mice were fed a HFD or ND for 6–7 weeks and then underwent CLP with a 22g needle to induce polymicrobial sepsis and was performed as previously described (15). After CLP, mice were fluid resuscitated with sterile saline (0.6ml) injected subcutaneously. Plasma, liver and white adipose tissue (WAT) were collected at 6h after CLP for biochemical studies.
Survival studies
In separate studies, mice were divided into two treatment groups: ND mice, HFD mice after 6 weeks of feeding. Polymicrobial sepsis was induced by CLP and mice were monitored for survival (n=8–12/group). Animals were fluid resuscitated with sterile saline (0.6ml) injected subcutaneously.
Measurement of ALT
Plasma alanine aminotransferase (ALT) was measured using standard enzyme assay kits (ID Labs, London, Ontario, Canada).
Measurement of hepatic triglyceride
Mouse livers were weighed, then minced into small pieces and processed according to the manufacturer’s instructions for the triglyceride Colorimetric Assay kit (Caymen Chemical, Ann Arbor, MI).
Measurement of myeloperoxidase activity
Myeloperoxidase activity was determined as an index of neutrophil accumulation in liver as previously described (16).
Plasma levels of adipokines and cytokines
Plasma levels of adipokines and cytokines were measured with the multiplex assay kit (EMD Millipore, Billerica, MA) using the manufacturer’s protocol.
Immunohistochemistry
Liver was collected and fixed in 10% buffered formalin solution overnight, followed by paraffin embedding. Hematoxylin and eosin staining was performed on 5μm sections from the paraffin-embedded tissue blocks for conventional light microscopy. For CD68 staining, liver sections were deparaffinized and immunostained with rabbit anti-CD68 antibody (Abcam, Cambridge, MA) using the automated Ventana immunostainer, according to manufacturer’s recommendation. The cell count was performed on scanned slides using Imagescope software (Leica Biosystems, Buffalo Grove, IL).
Gene expression analysis
RT-qPCR assays were performed using the Mouse Obesity RT2 Profiler PCR Array which profiles the expression of 84 obesity-related genes (Qiagen, Valencia, CA). WAT were homogenized in TRIzol (Invitrogen, Grand Island, NY). RNA was reversely transcribed using the RT2 First Strand Kit for cDNA synthesis (Qiagen). Cycle threshold was standardized between samples. Each sample was normalized to one of five housekeeping genes (ΔCT). The fold change in each tissue was calculated using the comparative CT method (2−ΔΔCT).
Quantitative reverse-transcription polymerase chain reaction (qRT-PCR)
To confirm the results obtained using the PCR Array we analyzed WAT gene expression of select genes. WAT samples were homogenized in TRIzol (Invitrogen) and mRNA was extracted and purified. The mRNA was reversely transcribed to cDNA using the high-capacity cDNA reverse transcription kit (Applied Biosystems, Grand Island, NY). Comparative qPCR was performed using TaqMan Gene expression master mix (Applied Biosystems) with the following primers and probes: GAPDH (Mm99999915_gl), IL-6 (Mm00446190_ml), TNFα (Mm00443258_ml), AdipoR2 (Mm11184032_m1) and PPARγ (Mm01184332-m1). The reaction was performed and analyzed using a quantitative PCR system (QuantStudio-6Flex machine, Applied Biosystems). Samples were run in duplicate. The change in gene expression was normalized to GAPDH.
Subcellular fractionation and nuclear protein extraction
Tissue samples were prepared as previously described (10). The amount of protein was quantified by Bradford assay.
Western blot analysis
The Invitrogen NuPAGE gel electrophoresis system (Invitrogen) was used for all Western blotting. NuPAGE 10% Bis-Tris gels were used with NuPAGE MOPS buffer and Invitrogen Novex Mini-Cell, BioRad PowerPac 300. Membranes imaged using BioRad ChemiDoc XRS+ gel documentation system and analyzed using ImageLab v5.1 software (BioRad, Hercules, CA). The following antibodies were used for cytosol extracts: STAT3, pSTAT3 (Tyrosine705), pSTAT3 (Serine727) (Cell Signaling, Danvers, MA), beta-Actin (Santa Cruz, Dallas, Texas).
Determination of activator protein-1 (AP-1) activity
AP-1 (c-Jun) activation was detected in liver nuclear extracts by using an ELISA-based transcription factor assay kit (10). Nuclear protein, 10μg, obtained from liver extracts was added to a 96-well plate with oligonucleotide containing the AP-1 consensus binding sequence (Active Motif North America, Carlsbad, CA). A wild-type and mutated oligonucleotides were used for AP-1 binding to monitor the specificity of the assay (data not shown).
Data Analysis
Data were analyzed using SigmaStat for Windows Version 13 (SysStat Software, San Jose, CA). Values in the text and figures are expressed as mean and standard error of the mean (SEM) for parametric data and median and interquartile range for nonparametric data. Survival analysis was performed by log-rank test. Statistical analysis were performed using the two-way ANOVA with Holm-Sidak method for parametric and Kruskal-Wallis ANOVA with the Dunn post hoc test for nonparametric data. A value of p ≤ 0.05 was considered significant.
Results
Model of diet-induced obesity (DIO) that replicates human obesity
To determine whether this model replicates human obesity we randomized mice to a normal or HFD for 6wks. There was no difference in age or body weight at the beginning of the dietary intervention. After 6–7wks of feeding, HFD-fed mice had higher weights compared to the ND group (Figure 1A). Mice fed a HFD had greater fat mass compared to mice fed a ND as analyzed by EchoMRI (Figure 1B). HFD-fed mice had higher plasma insulin levels compared to ND-fed mice but this did not reach statistical significance (2,041 vs 1,641 pg/ml, p=0.1). Mice fed a HFD had higher blood glucose values after glucose challenge (Figure 1C) and elevated hepatic triglyceride levels compared to mice fed a ND (81.5 ± 4.8 vs. 24.3 ± 3.2 mg/dl, p<0.001). These findings confirm the methodological technique of using a HFD to replicate human obesity and glucose intolerance.
Figure 1.
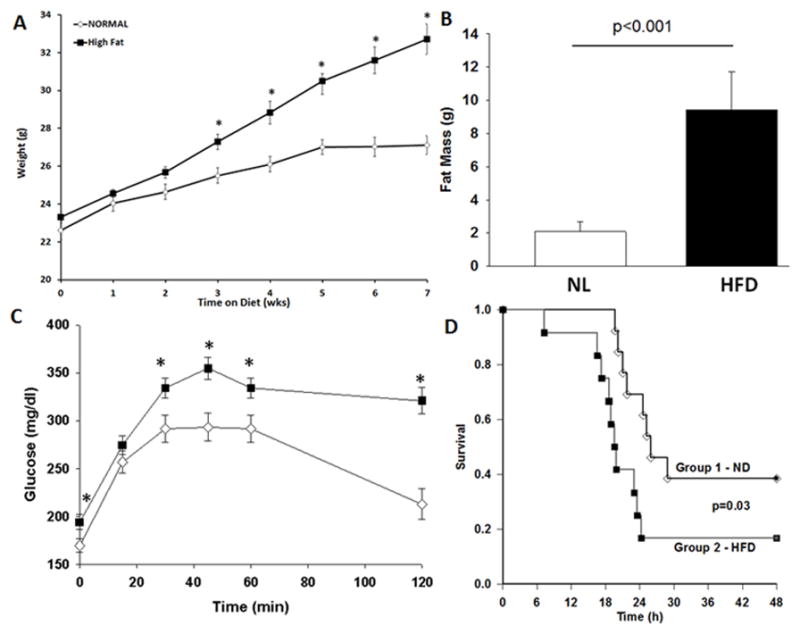
Model of DIO replicates human obesity. Changes in (A) body weight (B) fat mass measured by EchoMRI and (C) glucose tolerance test in mice fed a high fat diet (HFD) or standard control diet (CD) for 6 weeks. Values are means ± SEM. *p<0.05 vs normal diet. n=12–16/group. White boxes=Normal diet, Black boxes = HFD. (D) Obese mice have higher mortality after sepsis. Mice were randomized to a HFD or ND for 6–7wks. CLP was performed and survival was monitored. Animals were censored at 30h. p=0.035 by log-rank test, n=12/group. White diamonds = Normal diet, Black boxes = HFD.
Survival study
We have previously demonstrated that a HFD, even for a short duration, increases mortality after sepsis (10). To determine the effects of longer-term obesity on outcomes from sepsis we performed a survival study on mice after 6–7 weeks of feeding on ND or HFD. After the dietary intervention, polymicrobial sepsis was induced by CLP and mice were monitored for survival. Obese mice had shorter survival times and a lower probability of survival following polymicrobial sepsis than non-obese mice (Figure 1D).
Plasma Adipokines – leptin and adiponectin
Obesity is characterized by an increase in plasma leptin levels. Similar to human obesity, plasma leptin levels at baseline were significantly higher in obese mice compared to non-obese mice (Figure 2). After CLP, leptin levels remained significantly higher in obese mice after sepsis compared to non-obese mice after sepsis (26.6 ng/ml ± 10.9 vs. 7.3 ± 5 ng/ml, p ≤ 0.05). The anti-inflammatory adipokine, adiponectin, was reduced in obese mice after sepsis but remained unchanged in non-obese mice after sepsis (Figure 2B).
Figure 2.
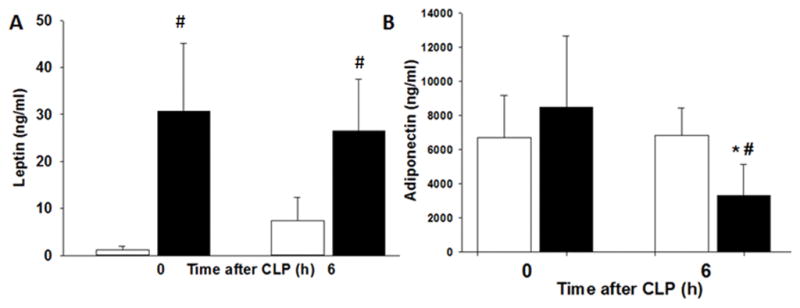
Obesity alters adipokines after polymicrobial sepsis. Mice were randomized to a HFD or ND for 6–7wks. Polymicrobial sepsis was induced by CLP after diet intervention. Plasma (A) leptin and (B) adiponectin levels after CLP. *p<0.05 vs time 0h, #p<0.05 vs. normal diet. White boxes = Normal diet, Black boxes = HFD. n=4–5 mice/group.
Effects of a HFD on the systemic inflammatory response after sepsis
To determine the effect of obesity on the systemic inflammatory response we measured plasma cytokine levels. Plasma levels of interleukin IL-17a and IL-23, mediators of the T helper type 17 cellular response, increased in non-obese mice after sepsis compared to baseline (1,407 ± 442 vs. 23 ± 2 pg/ml and 2,250 ± 864 vs. 474 ± 51 pg/ml respectively, p<0.05) (Figure 3A&B). In obese septic mice IL-17a and IL-23 expression were significantly lower compared to non-obese mice septic mice (685 ± 191 pg/ml and 314 ± 133 pg/ml respectively, p<0.05). Plasma TNFα and IL-6 levels increased in both obese and non-obese mice after sepsis (Figure 3C&D). Unlike IL-6 levels, plasma TNFα levels were significantly lower in obese septic mice compared to non-obese septic mice.
Figure 3.
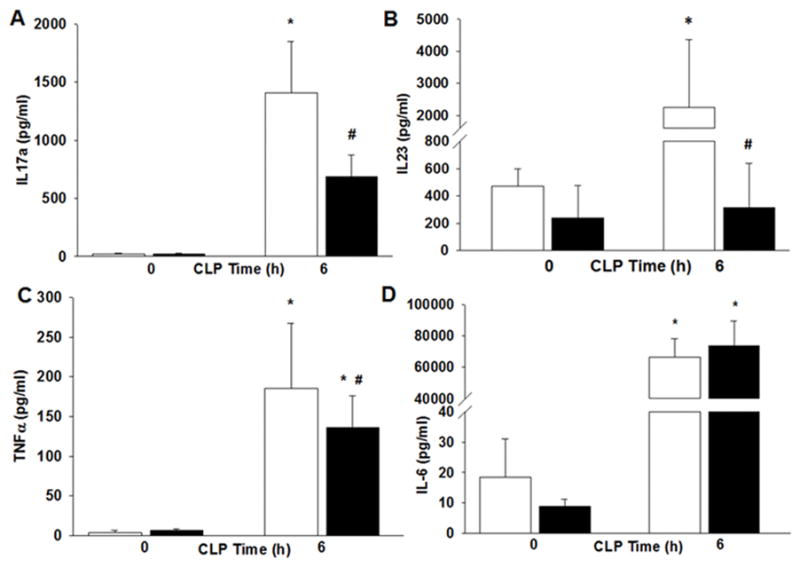
Obesity alters cytokines after polymicrobial sepsis. Mice were randomized to a HFD or ND for 6–7wks. Polymicrobial sepsis was induced by CLP after diet intervention. Plasma (A) IL-17a (B) IL-23 (C) TNFα and (D) IL-6 levels after CLP. *p<0.05 vs time 0h, #p<0.05 vs. normal diet. White boxes = Normal diet, Black boxes = HFD. n=5–6 mice/group.
Effects of obesity on liver injury and inflammation after sepsis
Multiple organ failure is a serious complication of sepsis and is usually preceded by accumulation of neutrophils in several vital organs (17). Neutrophil infiltration in the liver was quantified by myeloperoxidase (MPO) activity, an enzyme specific to granulocyte lysosomes. At 6h after CLP, obese mice had an increase in MPO activity compared with non-obese mice (11.4 ± 1.4 vs. 7 ± 0.3 U/100mg tissue, p<0.05) (Figure 4A). Macrophages were quantified by staining of the liver for the general macrophage marker, CD68. Macrophages increased in both the obese (34 ± 2.9 cells/high power field) and non-obese (33.2 ± 4.1 cells/high power field) groups after sepsis compared to baseline (21.1 ± 2.2 and 18.9 ± 2.9 cells/high power field respectively), but there was no dietary effect (Figure 4C–G).
Figure 4.
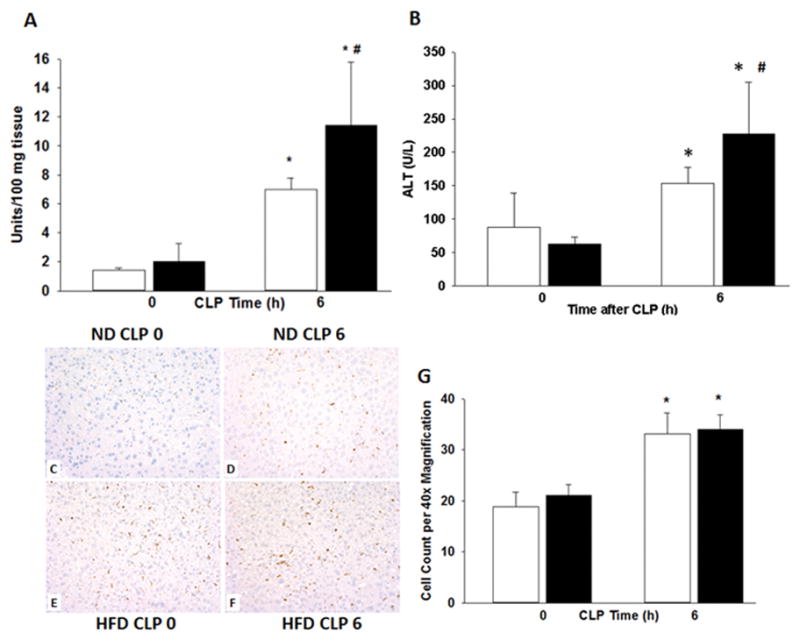
Mice were randomized to a HFD or ND for 6–7wks. Polymicrobial sepsis was induced by CLP after diet intervention and (A) liver neutrophil infiltration was determined by myeloperoxidase assay. (B) Plasma ALT levels were measured. Representative immunohistochemistry for CD68 of liver sections from mice on (C) ND prior to CLP (D) on ND at 6h after CLP (E) on HFD prior to CLP and (F) on HFD at 6h after CLP. Images at 20x magnification and (G) quantification performed at 40x. *p<0.05 vs. time 0h. #p<0.05 vs. normal diet. White boxes = Normal diet, Black boxes = HFD. n=5–8 mice/group.
To determine whether hepatic inflammation after high-fat feeding is associated with liver injury we measured plasma alanine aminotransferase (ALT), an enzyme released into the bloodstream with liver injury. Plasma ALT levels were higher after the induction of sepsis in both obese and non-obese mice (227 U/L ± 32 and 154 U/L ± 10 respectively) compared with baseline (63 U/L ± 4 and 88 U/L ± 21 respectively) (Figure 4B). Obese septic mice had significantly higher ALT levels compared with non-obese septic mice (p<0.05). These findings indicate that obese mice have more hepatic inflammation and injury than non-obese mice after the induction of sepsis.
Effects of obesity on adipose tissue gene expression in sepsis
Little is known regarding the contribution of adipose tissue inflammation in sepsis. We investigated differences in gene expression from obese and non-obese mice prior to and after the induction of sepsis. Gene expression was determined using the mouse obesity RT2 Profiler PCR Array which profiles the expression of 84 obesity related-genes. Genes significantly overexpressed in WAT from non-obese septic mice compared to non-obese non-septic mice include IL-1β (50.5 fold), IL-1r1 (8.4 fold), IL-6 (126 fold), and TNFα (6 fold). Genes significantly under-expressed in WAT from non-obese septic mice compared to non-obese non-septic mice include adiponectin receptor 2 (AdipoR2) (−6.1 fold), peroxisome proliferator activated receptor gamma (PPARγ) (−8.5 fold), adrenergic receptor beta 1 (Adrb1) (−8.2 fold), nuclear receptor subfamily 1 (Nr3c1) (−5.1 fold), glucuronidase beta (Gusb) (−4.3 fold). Genes significantly overexpressed in WAT in obese septic mice compared to obese non-septic mice include ciliary neurotrophic factor receptor (Cntfr) (4 fold), IL-1β (14 fold), IL-1r1 (7 fold), and IL-6 (61 fold). Genes significantly under-expressed in WAT from obese septic mice compared to obese non-septic mice include Adrb1 (−9 fold). Of the 84 genes, the greatest fold change in adipose tissue from septic obese mice compared to septic non-obese mice was found in the leptin gene (Figure 5). Leptin expression was increased 3-fold in obese non-septic mice compared to non-obese non-septic mice. Septic obese mice had a 7-fold increase in leptin expression compared to septic non-obese mice. Therefore the differences in leptin expression are affected by diet and sepsis.
Figure 5.
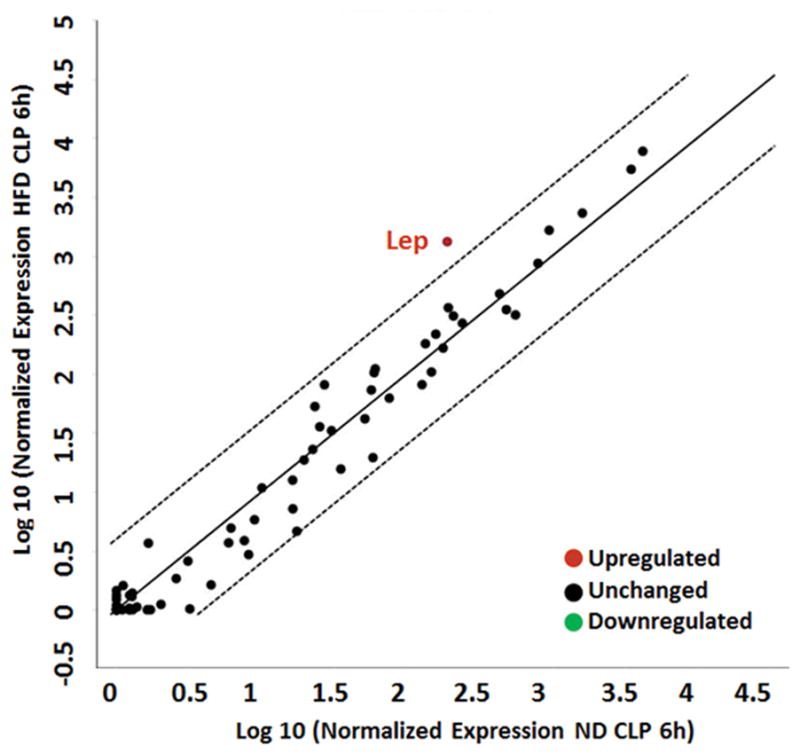
Leptin gene expression is increased in WAT in obese mice after sepsis. 6wk male C57BL/6 mice were randomized to a HFD or normal chow diet for 6wks. Sepsis was induced by CLP after diet intervention and epididymal WAT obtained for analysis. Gene expression profile of 84 genes related to obesity was evaluated. Center line represents unchanged gene expression. Boundary line (dashed lines) indicates 4-fold gene regulation cut-off between septic obese and septic non-obese samples. Leptin demonstrated differences that represented more than a doubling or halving (log 2 changes of >1.0 or −1.0, respectively) and were statistically significant at p ≤0.05. n=3 mice/group.
To confirm these results we determined gene expression in WAT of select genes. As demonstrated in Figure 6A, AdipoR2 expression decreased in WAT after sepsis but was higher in obese mice compared to non-obese mice. Expression of IL-6 increased after sepsis in both obese and non-obese mice (Figure 6B). White adipose tissue TNFα gene expression increased in non-obese septic mice but not in obese septic mice (Figure 6C). As compared to non-obese septic mice, obese septic mice had lower TNFα expression. PPARγ expression was lower in obese mice compared to non-obese mice (Figure 6D). In response to sepsis, PPARγ expression increased in obese mice but remained significantly lower than non-obese mice.
Figure 6.
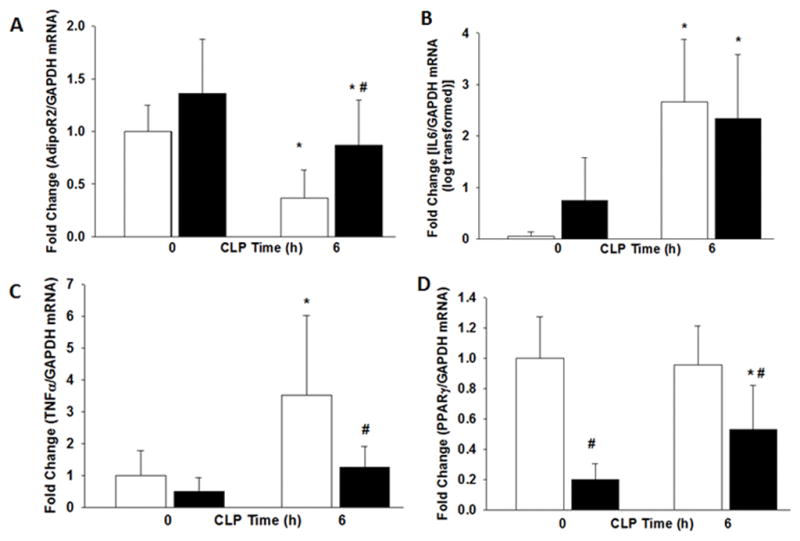
The expression of (A) Adiponectin Receptor 2 (B) IL-6 (C) TNFα and (D) PPARγ in WAT were measured by RT-qPCR after CLP. *p<0.05 vs. time 0h. #p<0.05 vs. normal diet. White boxes = Normal diet, Black boxes = HFD. n=6 mice/group.
Effects of obesity on hepatic STAT3 expression
STAT3 is an important transcription factor affecting hepatic inflammation. We investigated the differences in the nuclear activity of STAT3 between obese and non-obese mice. As demonstrated in Figure 7, both serine and tyrosine phosphorylation of STAT3 was increased after sepsis in both non-obese and obese mice and was significantly enhanced in obese mice compared to non-obese mice after sepsis (Figure 7).
Figure 7.
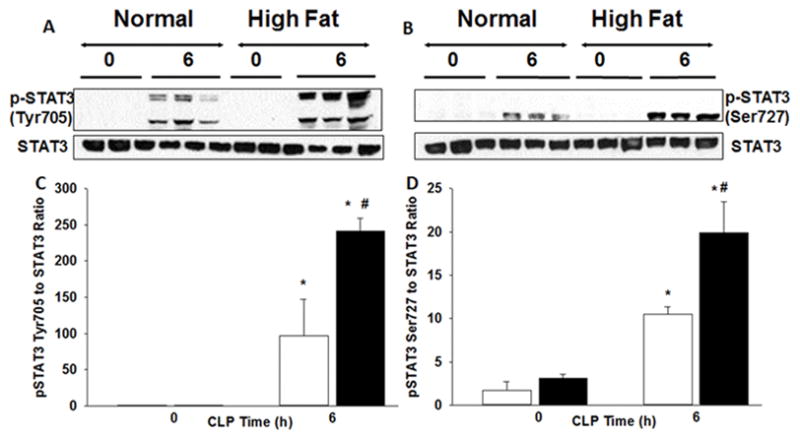
Phosphorylation sites of STAT3 expression in liver. (A) Changes in tyrosine705 and (B) serine727 phosphorylation of STAT3 and STAT3 expression in liver nuclear extracts by Western blot. (C & D) Densitometric analysis. White boxes = Normal diet, Black boxes = HFD. *p<0.05 vs time 0h. #p<0.05 vs normal diet.
Effects of obesity on hepatic AP-1 Activity
We investigated the transcription factor, AP-a as a mechanism leading to obesity-associated inflammation. AP-1 is a transcription factor involved in the signal transduction of the inflammatory process. Hepatic AP-1 DNA-binding activity in obese mice was greater than non-obese mice after 6wks of feeding. Although AP-1 activity increased in non-obese mice at 6h after CLP, AP-1 activity was significantly higher in obese mice than non-obese mice after CLP (Figure 8).
Figure 8.
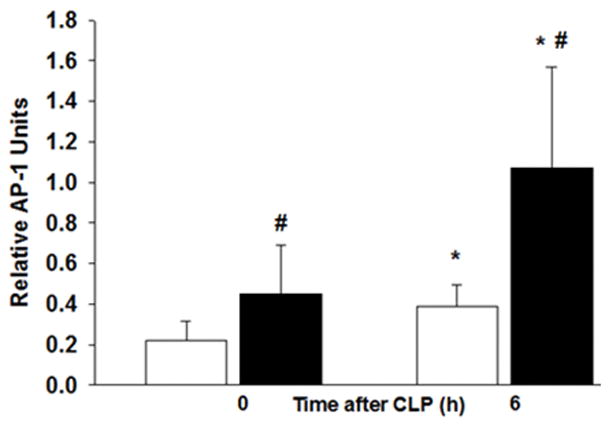
Liver nuclear extracts were obtained from ND and HFD-fed mice after CLP. Liver AP-1 DNA binding was evaluated by transcription factor assay kit. n= 6–8/group. White boxes = Normal diet, Black boxes = HFD. *p<0.05 vs time 0h. #p<0.05 vs normal diet.
Discussion
We have developed a model of diet-induced obesity (DIO) that replicates human obesity in that mice fed a 6-week HFD develop increased body weight, increased fat mass, an accumulation of hepatic triglycerides and glucose intolerance. Using this approach provides an opportunity to understand the mechanistic changes that occur during sepsis and to determine the role of obesity in altering the inflammatory response after sepsis.
We found that adipose tissue expression of select inflammatory genes were altered during sepsis and affected by obesity. Plasma and adipose leptin expression was increased obese septic mice compared to non-obese septic mice. After the induction of sepsis, obese mice developed significant liver injury and increased activation of hepatic STAT3 and AP-1 compared to non-obese septic mice. Subsequently, obese mice had higher mortality following polymicrobial sepsis.
The higher mortality in septic obese mice is similar to our previous data using a short-term (3wk) HFD (10). In both dietary intervention time periods mice with obesity have similar mortality. The magnitude of the survival difference in the normal and HFD groups is different between the 3 and 6wk diet groups and reflects the differences in the survival of the normal diet cohorts. Dietary time may also explain differences demonstrated in other rodent models of obesity and sepsis. Multiple studies demonstrate that obesity increases inflammation and mortality in sepsis models (8–10). Other studies utilizing longer feeding strategies showed contradictory findings and demonstrate a protective effect of obesity during sepsis (11, 12). The impact of obesity on the outcomes from sepsis remains unclear but may be affected by the duration of high fat feeding.
Leptin is secreted by adipocytes and has an important role in appetite regulation and energy homeostasis (18). Our findings are consistent with previous studies demonstrating that obese mice have increased adipose leptin expression and hyperleptinemia (13). Leptin expression was significantly elevated in adipose tissue from obese septic mice compared to non-obese septic mice. Human and murine studies demonstrate that leptin is increased during sepsis independent of body mass (19–21). Leptin also has beneficial effects because leptin deficient mice (ob/ob) are more susceptible to bacteria and develop increased inflammation (22, 23). Surprisingly, exogenous leptin administration given to non-obese septic mice improved their survival (12). More studies are necessary in leptin deficient and hyperleptinemic mice to understand the importance of leptin in the response to sepsis.
Leptin activates intracellular signaling pathways including STAT3. Phosphorylation of tyrosine1138 and serine727 occurs in response to cytokine stimulation (24, 25). Both tyrosine and serine STAT3 phosphorylation were increased in obese septic mice. Studies suggest that serine STAT3 phosphorylation is required for maximal activation and may function as a negative regulator of STAT3 activation (26, 27). The influence of both serine and tyrosine phosphorylation on STAT3 activity still is unknown and remains a focus of our ongoing investigations.
IL-6 activates STAT3 and is important in the acute phase response to injury (28). IL-6-STAT3 activation promotes tumorigenesis and anti-apoptotic pathways in multiple tumor types (29, 30). In sepsis, hepatic STAT3 activation is essential for survival (31). Septic hepatocyte specific STAT3-deficient mice had higher mortality and lower acute phase proteins (31). In a two-hit model of infection hepatic STAT3-deficient mice had higher mortality and decreased alveolar macrophage reactive oxygen species production (32). It is possible that during sepsis the STAT3 pathway, although deleterious in cancer, may lead to cell survival and prove beneficial.
Interestingly, plasma IL-17a, IL-23 and TNFα levels in obese mice were significantly lower after CLP compared to non-obese septic mice. These results are consistent with our previous results in a short-term HFD model (10). A depressed cytokine response was evident in injured patients with obesity (33). Following blunt trauma, subjects with obesity had lower inflammatory cytokines compared with subjects without obesity. These data suggest that obesity leads to an impaired cytokine response after an inflammatory insult. Interleukin-23 and IL-17 are cytokines involved in tissue neutrophil recruitment. IL-17a knockout mice have increased susceptibility to infection compared to wild-type mice (34). IL-17a is critical for the host defense against oral candidiasis. The reduced plasma cytokine response in mice with obesity found in our investigations may contribute to the increased mortality after sepsis because of a relative immune-suppression.
Activator Protein-1 activity increased in non-obese septic mice but was further enhanced in obese septic mice. Patients with obesity are at increased risk of developing non-alcoholic fatty liver disease (NAFLD) and non-alcoholic steatohepatitis (NASH). Hepatic NF-κB and AP1 activity were higher in patients with NAFLD and obesity compared to patients with obesity alone (35). The increase in these transcription factors directly correlated with insulin resistance. AP1 activation is increased in primary mouse hepatocytes after free fatty acid stimulation (36). We found that obese mice had higher hepatic triglyceride levels than non-obese mice and therefore may explain AP-1 activation. This mechanism will need to be explored in future studies. NFκB, STAT3 and AP1 are important pathways in cancer research (37, 38). Taken together with our previous work, we have identified important signaling pathways that are induced in septic mice with obesity.
A limitation of the study is the choice of diets. The HFD is a semi-purified diet that consists of lard, casein, maltodextrin and sucrose among other ingredients and has many differences compared to the normal chow diet (39). The HFD has a higher percentage of total monounsaturated and saturated fatty acids, lower carbohydrates and protein compared to normal chow. The normal chow diet includes corn, wheat, and soybean meal. These ingredients, among others, can affect the endocrine response because they provide a source of phytoestrogens (40). The differences in composition of the two diets in our study could also alter the gut microbiota thereby affecting the inflammatory response.
In conclusion, 6 weeks of high fat feeding replicates the physiologic state that occurs in human obesity. Diminished adipose tissue inflammatory responses may be detrimental during sepsis. In combination with a depressed plasma cytokine response the obese mouse may be more susceptible to multi-system organ failure, including lung and liver injury, and ultimately death. This may occur, in part, through activation of STAT3 and AP-1 signaling pathways.
What is already known about this subject?
Short term high fat feeding in mice increases mortality during sepsis
Obesity is associated with hepatic and adipose tissue inflammation
Hepatic STAT3 activation is important for recovery from sepsis
What does your study add?
During sepsis we found that adipose tissue expression of adiponectin receptor 2 was decreased in mice with and without obesity but remained higher in mice with obesity. Mice with obesity have decreased adipose tissue expression of TNFα and PPARγ after sepsis compared to non-obese mice.
Circulating plasma levels of IL-17a, IL-23 and TNFα levels in obese mice were significantly lower after CLP compared with non-obese mice.
These studies add to the understanding of the mechanisms of obesity-associated inflammation during sepsis and provide signaling pathways (STAT3 and AP-1) which could be therapeutic targets to alter the inflammatory response in obese mice with sepsis.
Acknowledgments
Funding: Supported, in part, by the National Institutes of Health grants R01 GM067202 (BZ), K08 GM093135 (JK), and P30DK078392.
Footnotes
Disclosures: JK reports financial support to institution for work on DSMB of a clinical trial (Eli Lilly) not related in any way to the work in the manuscript.
References
- 1.Brown CV, Neville AL, Salim A, Rhee P, Cologne K, Demetriades D. The impact of obesity on severely injured children and adolescents. J Pediatr Surg. 2006;41:88–91. doi: 10.1016/j.jpedsurg.2005.10.012. discussion 88–91. [DOI] [PubMed] [Google Scholar]
- 2.Prescott HC, Chang VW, O’Brien JM, Jr, Langa KM, Iwashyna T. Obesity and 1-Year Outcomes in Older Americans With Severe Sepsis. Crit Care Med. 2014 doi: 10.1097/CCM.0000000000000336. [DOI] [PMC free article] [PubMed] [Google Scholar]
- 3.Akinnusi ME, Pineda LA, El Solh AA. Effect of obesity on intensive care morbidity and mortality: a meta-analysis. Crit Care Med. 2008;36:151–158. doi: 10.1097/01.CCM.0000297885.60037.6E. [DOI] [PubMed] [Google Scholar]
- 4.Hogue CW, Jr, Stearns JD, Colantuoni E, et al. The impact of obesity on outcomes after critical illness: a meta-analysis. Intensive Care Med. 2009;35:1152–1170. doi: 10.1007/s00134-009-1424-5. [DOI] [PubMed] [Google Scholar]
- 5.Nasraway SA, Jr, Albert M, Donnelly AM, Ruthazer R, Shikora SA, Saltzman E. Morbid obesity is an independent determinant of death among surgical critically ill patients. Crit Care Med. 2006;34:964–970. doi: 10.1097/01.CCM.0000205758.18891.70. quiz 971. [DOI] [PubMed] [Google Scholar]
- 6.Bercault N, Boulain T, Kuteifan K, Wolf M, Runge I, Fleury JC. Obesity-related excess mortality rate in an adult intensive care unit: A risk-adjusted matched cohort study. Crit Care Med. 2004;32:998–1003. doi: 10.1097/01.ccm.0000119422.93413.08. [DOI] [PubMed] [Google Scholar]
- 7.Arabi YM, Dara SI, Tamim HM, et al. Clinical characteristics, sepsis interventions and outcomes in the obese patients with septic shock: an international multicenter cohort study. Crit Care. 2013;17:R72. doi: 10.1186/cc12680. [DOI] [PMC free article] [PubMed] [Google Scholar]
- 8.Sakai S, Iizuka N, Fujiwara M, et al. Mild obesity reduces survival and adiponectin sensitivity in endotoxemic rats. J Surg Res. 2013;185:353–363. doi: 10.1016/j.jss.2013.06.002. [DOI] [PubMed] [Google Scholar]
- 9.Strandberg L, Verdrengh M, Enge M, et al. Mice chronically fed high-fat diet have increased mortality and disturbed immune response in sepsis. PLoS ONE. 2009;4:e7605. doi: 10.1371/journal.pone.0007605. [DOI] [PMC free article] [PubMed] [Google Scholar]
- 10.Kaplan JM, Nowell M, Lahni P, O’Connor MP, Hake PW, Zingarelli B. Short-term high fat feeding increases organ injury and mortality after polymicrobial sepsis. Obesity (Silver Spring) 2012;20:1995–2002. doi: 10.1038/oby.2012.40. [DOI] [PMC free article] [PubMed] [Google Scholar]
- 11.Khan M, Patrick AL, Fox-Robichaud AE Canadian Critical Care Translational Biology G. Development of a murine model of early sepsis in diet-induced obesity. Biomed Res Int. 2014;2014:719853. doi: 10.1155/2014/719853. [DOI] [PMC free article] [PubMed] [Google Scholar]
- 12.Siegl D, Annecke T, Johnson BL, 3rd, et al. Obesity-induced hyperleptinemia improves survival and immune response in a murine model of sepsis. Anesthesiology. 2014;121:98–114. doi: 10.1097/ALN.0000000000000192. [DOI] [PubMed] [Google Scholar]
- 13.Frederich RC, Hamann A, Anderson S, Lollmann B, Lowell BB, Flier JS. Leptin levels reflect body lipid content in mice: evidence for diet-induced resistance to leptin action. Nat Med. 1995;1:1311–1314. doi: 10.1038/nm1295-1311. [DOI] [PubMed] [Google Scholar]
- 14.National Research Council Committee for the Update of the Guide for the C, Use of Laboratory A. 2011.
- 15.Kaplan J, Nowell M, Chima R, Zingarelli B. Pioglitazone reduces inflammation through inhibition of NF-kappaB in polymicrobial sepsis. Innate Immun. 2013 doi: 10.1177/1753425913501565. [DOI] [PMC free article] [PubMed] [Google Scholar]
- 16.Zingarelli B, Sheehan M, Hake PW, O’Connor M, Denenberg A, Cook JA. Peroxisome proliferator activator receptor-gamma ligands, 15-deoxy-Delta(12,14)-prostaglandin J2 and ciglitazone, reduce systemic inflammation in polymicrobial sepsis by modulation of signal transduction pathways. J Immunol. 2003;171:6827–6837. doi: 10.4049/jimmunol.171.12.6827. [DOI] [PubMed] [Google Scholar]
- 17.Abraham E. Nuclear factor-kappaB and its role in sepsis-associated organ failure. J Infect Dis. 2003;187(Suppl 2):S364–369. doi: 10.1086/374750. [DOI] [PubMed] [Google Scholar]
- 18.Halaas JL, Gajiwala KS, Maffei M, et al. Weight-reducing effects of the plasma protein encoded by the obese gene. Science. 1995;269:543–546. doi: 10.1126/science.7624777. [DOI] [PubMed] [Google Scholar]
- 19.Shapiro NI, Khankin EV, Van Meurs M, et al. Leptin exacerbates sepsis-mediated morbidity and mortality. J Immunol. 2010;185:517–524. doi: 10.4049/jimmunol.0903975. [DOI] [PMC free article] [PubMed] [Google Scholar]
- 20.Bornstein SR, Licinio J, Tauchnitz R, et al. Plasma leptin levels are increased in survivors of acute sepsis: associated loss of diurnal rhythm, in cortisol and leptin secretion. J Clin Endocrinol Metab. 1998;83:280–283. doi: 10.1210/jcem.83.1.4610. [DOI] [PubMed] [Google Scholar]
- 21.Kaplan JM, Denenberg A, Monaco M, Nowell M, Wong H, Zingarelli B. Changes in peroxisome proliferator-activated receptor-gamma activity in children with septic shock. Intensive Care Med. 2010;36:123–130. doi: 10.1007/s00134-009-1654-6. [DOI] [PMC free article] [PubMed] [Google Scholar]
- 22.Mancuso P, Gottschalk A, Phare SM, Peters-Golden M, Lukacs NW, Huffnagle GB. Leptin-deficient mice exhibit impaired host defense in Gram-negative pneumonia. J Immunol. 2002;168:4018–4024. doi: 10.4049/jimmunol.168.8.4018. [DOI] [PubMed] [Google Scholar]
- 23.Hsu A, Aronoff DM, Phipps J, Goel D, Mancuso P. Leptin improves pulmonary bacterial clearance and survival in ob/ob mice during pneumococcal pneumonia. Clin Exp Immunol. 2007;150:332–339. doi: 10.1111/j.1365-2249.2007.03491.x. [DOI] [PMC free article] [PubMed] [Google Scholar]
- 24.Banks AS, Davis SM, Bates SH, Myers MG., Jr Activation of downstream signals by the long form of the leptin receptor. J Biol Chem. 2000;275:14563–14572. doi: 10.1074/jbc.275.19.14563. [DOI] [PubMed] [Google Scholar]
- 25.Gough DJ, Koetz L, Levy DE. The MEK-ERK pathway is necessary for serine phosphorylation of mitochondrial STAT3 and Ras-mediated transformation. PLoS One. 2013;8:e83395. doi: 10.1371/journal.pone.0083395. [DOI] [PMC free article] [PubMed] [Google Scholar]
- 26.Chung J, Uchida E, Grammer TC, Blenis J. STAT3 serine phosphorylation by ERK-dependent and -independent pathways negatively modulates its tyrosine phosphorylation. Mol Cell Biol. 1997;17:6508–6516. doi: 10.1128/mcb.17.11.6508. [DOI] [PMC free article] [PubMed] [Google Scholar]
- 27.Wen Z, Zhong Z, Darnell JE., Jr Maximal activation of transcription by Stat1 and Stat3 requires both tyrosine and serine phosphorylation. Cell. 1995;82:241–250. doi: 10.1016/0092-8674(95)90311-9. [DOI] [PubMed] [Google Scholar]
- 28.Heinrich PC, Castell JV, Andus T. Interleukin-6 and the acute phase response. Biochem J. 1990;265:621–636. doi: 10.1042/bj2650621. [DOI] [PMC free article] [PubMed] [Google Scholar]
- 29.Hodge DR, Xiao W, Wang LH, Li D, Farrar WL. Activating mutations in STAT3 and STAT5 differentially affect cellular proliferation and apoptotic resistance in multiple myeloma cells. Cancer Biol Ther. 2004;3:188–194. doi: 10.4161/cbt.3.2.621. [DOI] [PubMed] [Google Scholar]
- 30.Leu CM, Wong FH, Chang C, Huang SF, Hu CP. Interleukin-6 acts as an antiapoptotic factor in human esophageal carcinoma cells through the activation of both STAT3 and mitogen-activated protein kinase pathways. Oncogene. 2003;22:7809–7818. doi: 10.1038/sj.onc.1207084. [DOI] [PubMed] [Google Scholar]
- 31.Sakamori R, Takehara T, Ohnishi C, et al. Signal transducer and activator of transcription 3 signaling within hepatocytes attenuates systemic inflammatory response and lethality in septic mice. Hepatology. 2007;46:1564–1573. doi: 10.1002/hep.21837. [DOI] [PubMed] [Google Scholar]
- 32.Hilliard KL, Allen E, Traber KE, et al. Activation of Hepatic STAT3 Maintains Pulmonary Defense during Endotoxemia. Infect Immun. 2015;83:4015–4027. doi: 10.1128/IAI.00464-15. [DOI] [PMC free article] [PubMed] [Google Scholar]
- 33.Winfield RD, Delano MJ, Cuenca AG, et al. Obese patients show a depressed cytokine profile following severe blunt injury. Shock. 2012;37:253–256. doi: 10.1097/SHK.0b013e3182449c0e. [DOI] [PMC free article] [PubMed] [Google Scholar]
- 34.Mosci P, Gabrielli E, Luciano E, et al. Involvement of IL-17A in preventing the development of deep-seated candidiasis from oropharyngeal infection. Microbes Infect. 2014;16:678–689. doi: 10.1016/j.micinf.2014.06.007. [DOI] [PubMed] [Google Scholar]
- 35.Videla LA, Tapia G, Rodrigo R, et al. Liver NF-kappaB and AP-1 DNA binding in obese patients. Obesity (Silver Spring) 2009;17:973–979. doi: 10.1038/oby.2008.601. [DOI] [PubMed] [Google Scholar]
- 36.Malhi H, Bronk SF, Werneburg NW, Gores GJ. Free fatty acids induce JNK-dependent hepatocyte lipoapoptosis. J Biol Chem. 2006;281:12093–12101. doi: 10.1074/jbc.M510660200. [DOI] [PubMed] [Google Scholar]
- 37.Gaykalova DA, Manola JB, Ozawa H, et al. NF-kappaB and stat3 transcription factor signatures differentiate HPV-positive and HPV-negative head and neck squamous cell carcinoma. Int J Cancer. 2015;137:1879–1889. doi: 10.1002/ijc.29558. [DOI] [PMC free article] [PubMed] [Google Scholar]
- 38.Canino C, Luo Y, Marcato P, Blandino G, Pass HI, Cioce M. A STAT3-NFkB/DDIT3/CEBPbeta axis modulates ALDH1A3 expression in chemoresistant cell subpopulations. Oncotarget. 2015;6:12637–12653. doi: 10.18632/oncotarget.3703. [DOI] [PMC free article] [PubMed] [Google Scholar]
- 39.Warden CH, Fisler JS. Comparisons of diets used in animal models of high-fat feeding. Cell Metab. 2008;7:277. doi: 10.1016/j.cmet.2008.03.014. [DOI] [PMC free article] [PubMed] [Google Scholar]
- 40.Thigpen JE, Setchell KD, Saunders HE, Haseman JK, Grant MG, Forsythe DB. Selecting the appropriate rodent diet for endocrine disruptor research and testing studies. ILAR J. 2004;45:401–416. doi: 10.1093/ilar.45.4.401. [DOI] [PubMed] [Google Scholar]


