

Abstract
Objective
To determine if tympanic membrane (TM) electrodes induce behavioral pure tone threshold shifts.
Design
Pure tone thresholds (250–8000 Hz) were measured twice in test (n=18) and control (n=10) groups. TM electrodes were placed between first and second threshold measurements in the test group, whereas the control group did not receive electrodes. Pure tone threshold shifts were compared between groups. The effect of TM electrode contact location on threshold shifts was evaluated in the test group.
Results
TM electrodes significantly increased average low-frequency thresholds, 7.5 dB at 250 Hz and 4.2 dB at 500 Hz, and shifts were as large as 25 dB in individual ears. Also, threshold shifts did not appear to vary at any frequency with TM electrode contact location.
Conclusions
Low-frequency threshold shifts occur when using TM electrodes and insert earphones. These findings are relevant to interpreting electrocochleographic responses to low-frequency stimuli.
Introduction
Electrocochleography is a technique used to measure electrical potentials of the inner ear and auditory nerve. Recording electrodes can be placed on the scalp, earlobe, ear canal wall, tympanic membrane (TM), cochlear promontory or round-window. TM electrodes provide superior signal-to-noise ratios compared to other extra-tympanic electrodes and are a non-invasive alternative to using trans-tympanic electrodes, which require a tympanotomy. Electrocochleography with a TM electrode has been used for a wide variety of clinical (e.g., Ferraro 2010) and basic investigation purposes (e.g., Chertoff et al. 2010; Lichtenhan & Chertoff 2008; Lichtenhan et al. 2015); however, no experiment has investigated the effects of TM electrode placement and contact location on behavioral hearing thresholds.
TM electrodes are typically retained in the ear canal and held against the TM using expanding foam tips of insert earphones. This placement technique, however, may influence sound transmission through the middle ear from the weight of the electrolyte gel and pressure applied to the TM electrode by the expanding foam tip. Shifts in behavioral pure tone thresholds induced by TM electrodes would indicate an attenuation of sound energy reaching the cochlea, which in turn would be expected to increase physiologic threshold estimates and yield poorer waveform morphology and signal-to-noise ratios at suprathreshold stimulus levels. Depending on the frequency specificity of such effects, physiologic responses to some stimuli may be more attenuated than others. In the original report describing TM electrodes, Stypulkowski and Staller (1987) did not observe changes in audiometric thresholds after electrode placement in three subjects. The location of electrode contact on the TM was not reported, although this is an important consideration because vibration patterns vary across the tympanic membrane surface (e.g., Cheng et al. 2013).
Materials and Methods
Participants
The University of Arizona Human Subjects Protection Program approved the methods used in this study. Participants were 28 (18 female) adults (average age 23.9 years, SD = 3.6). None reported otopathology, occupational, or recreational noise exposure. Otoscopy examinations found that all ear canals were free of excess cerumen and that tympanic membranes appeared healthy. Tympanometry was within normal limits (Gelfand 2009) bilaterally.
Stimuli
Pure tone stimuli were generated and attenuated with a portable audiometer (Maico MA 41). The pure tones were presented via Etymotic Research ER-3A insert earphones (ER-3A, Elk Grove Village, IL) coupled to the ear with 13 mm ER3-14A foam ear tips. In all subjects, the foam ear tips were deeply inserted, as recommended by the manufacturer.
TM Electrode
TM electrodes were constructed using a standardized assembly protocol based on the work of Ferraro and Durant (2002), with the exception that the distal end of the 0.1 mm gauge silver wire was not soldered to an alligator clip and was instead coupled to a connector suitable for our amplifier (Intelligent Hearing Systems, Miami, FL). A 27-gauge needle and 1 cc syringe was used to saturate the cotton-tipped proximal end of TM electrodes with Synapse electrode cream (Kustomer Kinetics, Arcadia, CA).
Procedures
Participants were assigned to either control (n=10, 6 female) or test (n=18, 12 female) groups. First, right ear pure tone thresholds at 250–8000 Hz were quantified using the modified Hughson-Westlake procedures with a 5 dB ascending step size (Carhart & Jerger, 1959). The earphone tip was removed after the initial pure tone test. Control group participants had the earphone tip re-inserted and pure tone threshold tests were repeated for the right ear. The purpose of the control group was to document test-retest variability in thresholds attributable to inserting, removing, and reinserting earphones without the influence of a TM electrode.
TM electrodes were placed in the right ears of the test group subjects and advanced until the TM was contacted; this was verified with subject report (e.g., the occlusion effect) and electrode-impedance measurements of ≤ 7 kOhms on the Intelligent Hearing Systems bio-amplifier (Ferraro 2010). The insert earphone foam ear tip was re-inserted to the same depth and allowed to fully expand to retain the electrode in the ear canal and maintain its contact with the TM. Pure tone thresholds were then immediately re-tested in the test group. Threshold shifts for each group were calculated as the difference between the second and first measurements at each frequency.1
In the test group, the TM electrodes were removed following the second pure tone test and otoscopy was performed. Acute areas of redness and accumulation of electrode gel were used to identify contact locations and classify them into four quadrants: anterior superior, posterior superior, anterior inferior, and posterior inferior (e.g., Fig. 1).
Fig. 1.

Otoscopy from an exemplary subject after TM electrode removal. Electrode gel (black arrow) and irritation (to the left of black arrow) identified that the TM electrode in this subject was on the posterior superior quadrant of the TM.
Results
Test and Control Group Threshold Differences
Threshold shifts are expressed as a function of frequency for test and control groups in Figure 2. The largest mean threshold shifts in the test group were: 7.5 dB (±7.32) at 250 Hz, 4.2 dB (± 4.93) at 500 Hz, and 3.89 dB (± 6.98) at 8000 Hz. In contrast, mean threshold shifts in the control group were 1.2 dB or less across these frequencies. The range of threshold shifts at these frequencies in the test group was −5 to 25 dB and −5 to 5 dB in the control group. A two-way ANOVA determined the effect of group (test and control) and frequency (250–8000) on threshold shifts. Main effects analysis was significant for group (F= 21.82 ; df = 1; p < 0.0001) and frequency (F= 2.29 ; df = 7; p = 0.0285) with no interaction between these two factors. Post-hoc t-tests with Bonferroni correction for multiple comparisons (α = 0.00625) revealed significant group differences in mean threshold shifts at 250 Hz (t = −2.73; df = 26; p= 0.0057) and 500 Hz (t= −2.50; df = 26; p=0.0094), respectively.
Fig. 2.
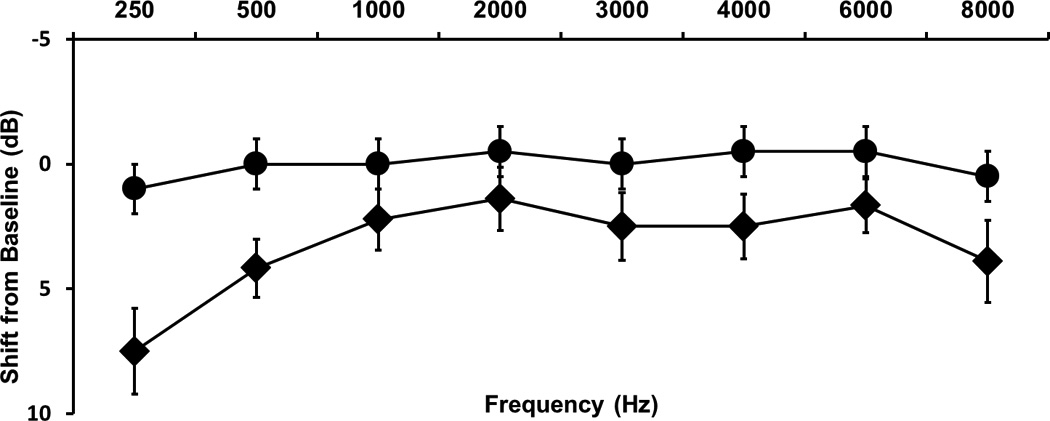
Average pure tone threshold shifts between first and second tests for the control group (●) and test group (♦; bars = ± 1 SEM).
Electrode contact site
We investigated the effect of TM electrode contact location on threshold shifts in 18 ears in the test group (Fig. 3). There was an uneven distribution of electrode contact sites, with 44% in the posterior superior quadrant, 28% in the anterior superior quadrant, 17% in the anterior inferior quadrant, and 11% in the posterior inferior quadrant. Given the small sample sizes of each group, meaningful statistical analyses could not be conducted with the present data. No clear relationship between contact location and threshold shift at any frequency is evident (Figure 3).
Fig. 3.
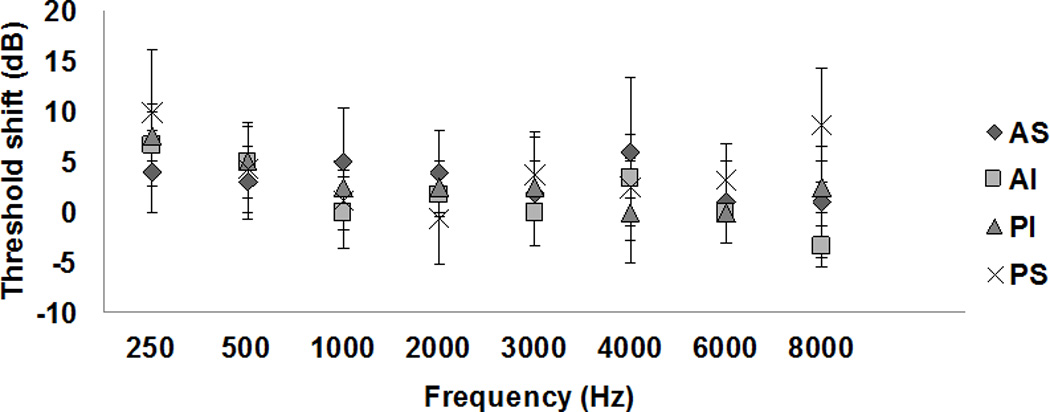
Average threshold shifts as a function of frequency with TM electrode contact locations as the parameter (bars = ± 1 SEM). AS: anterior-superior quadrant; AI: anterior-inferior quadrant; PI: posterior-inferior quadrant; PS: posterior-superior quadrant.
Discussion
The results demonstrate that TM electrodes held in place with foam ear tips caused the largest threshold shifts at 250, 500, and 8000 Hz. These findings suggest that TM electrodes affect hearing sensitivity by altering transmission through the tympanic membrane; we assume that threshold shifts were conductive in nature, but did not verify with bone-conduction tests due to time constraints.
The TM electrodes did not significantly affect mid-frequency thresholds. This is consistent with reports of simultaneous measurement of click-evoked ABR wave I from scalp and TM electrodes, which showed that wave I response latencies were not prolonged relative to published normative data when the TM electrode was in place (e.g., Ferraro & Ferguson 1989; Minaya & Atcherson 2015). If the TM electrodes caused conductive hearing losses in the mid-frequency (i.e., 1.0–4.0 kHz) range, absolute latencies of all ABR peaks would have increased relative to published norms. Thus, it appears that click-evoked compound action potentials or ABRs are not affected by low-frequency threshold shifts induced by TM electrodes.
There was no apparent relationship between electrode contact location and the magnitude of threshold shifts at any frequency in our small samples of participants. This observation is generally consistent with studies on the relationship between size and location of tympanic membrane perforations and resulting conductive hearing loss. For example, perforations cause conductive hearing loss in the low frequencies, an effect mediated by the size, not location, of the perforation (Mehta et al. 2006; Voss et al. 2001).
We did not control the amount of pressure applied to the tympanic membrane by the TM electrode. It is possible that the pressure against the TM, as well as the mass of the gel-soaked electrode tip, caused the threshold shifts. TM electrodes likely do not cause a shift in hearing sensitivity when using free field stimuli because expandable foam insert earphones are not used and thus there is less medial pressure imparted on the electrode (e.g., Lichtenhan et al. 2015). Pure tone threshold data was solely collected by the first author. While this helped ensure that earphone and TM electrode insertion were standardized to limit threshold shifts due to placement variation, a possible consequence of an un-blinded experimenter is biasing pure tone threshold measures. However, improvement in threshold at some frequencies after TM electrode insertion in some subjects demonstrates that experimenter bias was not an influence on our measures.
The present results should be considered using electrocochleography measurements from low-frequency sound, such as broadband or narrowband chirps (Chertoff et al. 2010), low-frequency tone bursts used to evoke the Auditory Nerve Overlapped Waveform (ANOW2; cf. Ferraro et al. 1994; Lichtenhan et al. 2013, 2014), speech-evoked responses (King et al. 2002), or the low-frequency biasing technique (Brown & Gibson 2011; Lichtenhan 2012). The next step in verification could be to measure cochlear nerve action potentials and auditory brainstem responses using these stimuli to determine if the behavioral threshold shifts we observed can influence attributes of electrophysiological measurements.
Acknowledgments
We thank Professors John J. Guinan, Jr. and Frank Musiek for comments on earlier versions of this manuscript. This research was funded by the National Institutes of Health, National Institute on Deafness and other Communication Disorders (F30 DC014180) to S.B.S.
Footnotes
We made chirp-evoked electrocochleography measurements from test-group participants for use in another study. No data was collected to compare electrophysiologic threshold estimates from chirp stimuli to behavioral threshold measures from pure tone stimuli.
The ANOW is an objective measure of low-frequency function that utilizes excitation of afferent auditory-nerve fibers in the apical half of the cochlear spiral.
References
- Brown DJ, Gibson WP. On the differential diagnosis of Ménière's disease using low-frequency acoustic biasing of the 2f1-f2 DPOAE. Hear Res. 2011;282(1–2):119–127. doi: 10.1016/j.heares.2011.09.002. [DOI] [PubMed] [Google Scholar]
- Carhart R, Jerger J. Preferred method for clinical determination of pure-tone thresholds. J Speech Hear Dis. 1959 [Google Scholar]
- Cheng JT, Hamade M, Merchant SN, et al. Wave motion on the surface of the human tympanic membrane: holographic measurement and modeling analysis. J Acous Soc of Am. 2013;133(2):918–937. doi: 10.1121/1.4773263. [DOI] [PMC free article] [PubMed] [Google Scholar]
- Chertoff M, Lichtenhan J, Willis M. Click-and chirp-evoked human compound action potentials. J Acous Soc of Am. 2010;127(5):2992–2996. doi: 10.1121/1.3372756. [DOI] [PMC free article] [PubMed] [Google Scholar]
- Ferraro JA, Ferguson R. Tympanic ECochG and conventional ABR: a combined approach for the identification of wave I and the IV interwave interval. Ear Hear. 1989;10(3):161–166. [PubMed] [Google Scholar]
- Ferraro JA, Durrant JD. Electrocochleography. In: Katz J, editor. Handbook of Clinical Audiology. New York: Lippincott, Williams and Williams; 2002. pp. 249–273. [Google Scholar]
- Ferraro JA. Electrocochleography: a review of recording approaches, clinical applications, and new findings in adults and children. J Am Acad of Audiol. 2010;21(3):145–152. doi: 10.3766/jaaa.21.3.2. [DOI] [PubMed] [Google Scholar]
- Gelfand SA. Essentials of audiology. New York, NY: Thieme; 2009. [Google Scholar]
- King C, Warrier CM, Hayes E, Kraus N. Deficits in auditory brainstem pathway encoding of speech sounds in children with learning problems. Neurosci Lett. 15. 2002;319(2):111–115. doi: 10.1016/s0304-3940(01)02556-3. [DOI] [PubMed] [Google Scholar]
- Lichtenhan JT, Chertoff ME. Temporary hearing loss influences post-stimulus time histogram and single neuron action potential estimates from human compound action potentials. J Acoust Soc Am. 2008;123(4):2200–2212. doi: 10.1121/1.2885748. [DOI] [PMC free article] [PubMed] [Google Scholar]
- Lichtenhan JT, Cooper NP, Guinan JJ. A new auditory threshold estimation technique for low frequencies: proof of concept. Ear Hear. 2013;34(1):42. doi: 10.1097/AUD.0b013e31825f9bd3. [DOI] [PMC free article] [PubMed] [Google Scholar]
- Lichtenhan JT, Hartsock JJ, Gill RM, et al. The Auditory Nerve overlapped Waveform (ANOW) originates in the cochlear apex. Assoc Res Otolaryngol. 2014;15(3):395–411. doi: 10.1007/s10162-014-0447-y. [DOI] [PMC free article] [PubMed] [Google Scholar]
- Lichtenhan JT, Wilson US, Hancock KE, et al. Medial Olivocochlear Efferent Reflex Inhibition of Human Cochlear Nerve Responses. Hear Res. 2015 doi: 10.1016/j.heares.2015.09.001. In Press. [DOI] [PMC free article] [PubMed] [Google Scholar]
- Mehta RP, Rosowski JJ, Voss SE, et al. Determinants of hearing loss in perforations of the tympanic membrane. Otol Neurotol. 2006;27(2):136. doi: 10.1097/01.mao.0000176177.17636.53. [DOI] [PMC free article] [PubMed] [Google Scholar]
- Minaya C, Atcherson SR. Simultaneous extratympanic electrocochleography and auditory brainstem responses revisited. Audiol Res. 2015;5(1) doi: 10.4081/audiores.2015.105. [DOI] [PMC free article] [PubMed] [Google Scholar]
- Stypulkowaki PH, Staller SJ. Clinical evaluation of a new ECoG recording electrode. Ear Hear. 1987;8(5):304. doi: 10.1097/00003446-198710000-00010. [DOI] [PubMed] [Google Scholar]
- Voss SE, Rosowski JJ, Merchant SN, et al. How do tympanic-membrane perforations affect human middle-ear sound transmission? Acta Otolaryngol. 2001;121(2):169–173. doi: 10.1080/000164801300043343. [DOI] [PubMed] [Google Scholar]