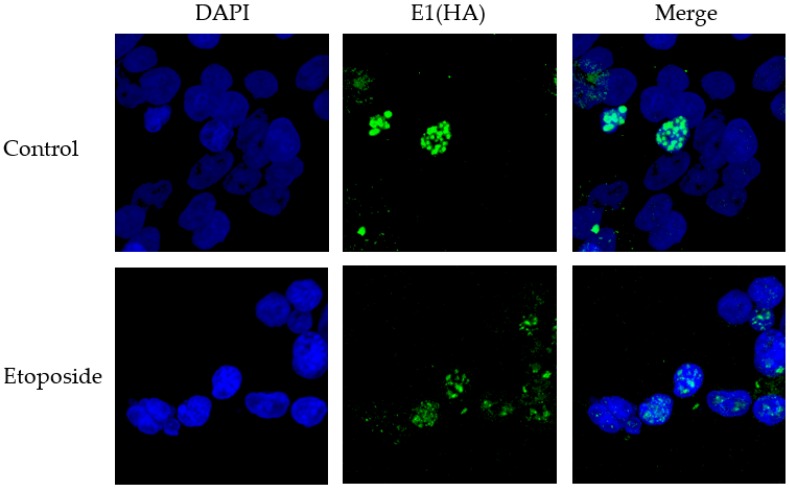
Figure 7.
Representative images of the localization of E1 into nuclear foci in the presence and absence of etoposide. C33a cells were transfected with 1 µg pOri, 1 µg E1 (HA) and 1 µg E2. The representative images presented show typical staining patterns observed in the presence or absence of 5 µM etoposide.

