

Abstract
Myelin controls the time required for an action potential to travel from the neuronal soma to the axon terminal, defining the temporal manner in which information is processed within the CNS. The presence of myelin, the internodal length, and the thickness of the myelin sheath are powerful structural factors that control the velocity and fidelity of action potential transmission. Emerging evidence indicates that myelination is sensitive to environmental experience and neuronal activity. Activity-dependent modulation of myelination can dynamically alter action potential conduction properties but direct functional in vivo evidence and characterization of the underlying myelin changes is lacking. We demonstrate that in mice long-term monocular deprivation increases oligodendrogenesis in the retinogeniculate pathway but shortens myelin internode lengths without affecting other structural properties of myelinated fibers. We also demonstrate that genetically attenuating synaptic glutamate neurotransmission from retinal ganglion cells phenocopies the changes observed after monocular deprivation, suggesting that glutamate may constitute a signal for myelin length regulation. Importantly, we demonstrate that visual deprivation and shortened internodes are associated with a significant reduction in nerve conduction velocity in the optic nerve. Our results reveal the importance of sensory input in the building of myelinated fibers and suggest that this activity-dependent alteration of myelination is important for modifying the conductive properties of brain circuits in response to environmental experience.
SIGNIFICANCE STATEMENT Oligodendrocyte precursor cells differentiate into mature oligodendrocytes and are capable of ensheathing axons with myelin without molecular cues from neurons. However, this default myelination process can be modulated by changes in neuronal activity. Here, we show, for the first time, that experience-dependent activity modifies the length of myelin internodes along axons altering action potential conduction velocity. Such a mechanism would allow for variations in conduction velocities that provide a degree of plasticity in accordance to environmental needs. It will be important in future work to investigate how these changes in myelination and conduction velocity contribute to signal integration in postsynaptic neurons and circuit function.
Keywords: conduction velocity, glutamate, monocular deprivation, myelin, oligodendrocyte, optic nerve
Introduction
Myelination of axons enables the process of saltatory conduction, increasing the speed and efficacy of action potential propagation throughout the nervous system. Myelin is an integral part of the structure and function of the axon; and as such, the interplay between neurons and oligodendroglial cells has been a subject of intense investigation. It is now clear that myelination is able to proceed in the absence of axons. In vitro, oligodendrocytes can myelinate fixed neurons and plastic nanofibers similar in shape and size to axons (Rosenberg et al., 2008; Lee et al., 2012). Despite the lack of requirement of axonal signals for myelination, evidence is building that neuronal activity and experience affect diverse aspects of the myelination process: oligodendrocyte progenitor cell (OPC) proliferation and differentiation (Barres and Raff, 1993; Mangin et al., 2008; Gibson et al., 2014; Hill et al., 2014; McKenzie et al., 2014), selection of axon targets (Hines et al., 2015), number of myelin internodes generated per oligodendrocyte (Mensch et al., 2015), and thickness of the myelin around axons (Liu et al., 2012; Makinodan et al., 2012; Gibson et al., 2014). However, what are the functional consequences of activity-induced changes in myelinated fibers? Myelin deposited along axons is organized with periodic gaps in between segments called nodes of Ranvier. Action potentials travel passively in the axon along the length of the myelin internode and are regenerated at these ion channel-rich nodes. Action potential conduction velocity depends on how much of the axon is myelinated, the thickness of the myelin, and the length of uninterrupted myelin internodes. All these parameters can vary widely between neighboring axons, and even along individual axons the structure of myelin is not uniformly continuous (Ibrahim et al., 1995; Tomassy et al., 2014). Yet, it is not known whether the complexity of the myelinated brain relates to information processing requirements or reflects stochastic patterns of myelination. Currently, it is unclear how variations in specific myelin parameters impact axon conduction in the CNS, and direct in vivo evidence that demonstrates whether neuronal activity alters action potential conduction is lacking. To directly test the hypothesis that neuronal activity may modify action potential conduction velocity by altering myelination, we set out to manipulate sensory experience in the visual system and analyze the effects on retinal ganglion cell (RGC) axon myelination and conduction properties. Using a monocular deprivation (MD) model, we demonstrate that, in the mouse visual system, sensory experience significantly regulates myelin internode length along axons. Associated with shorter myelin internodes, optic nerve (ON) conduction velocity is reduced after visual deprivation. A conditional knock-out of the vesicular glutamate transporter 2 (VGlut2) in RGCs significantly alters glutamate neurotransmission along the retinogeniculate pathway and phenocopies the changes observed after MD. Our results suggest that visual experience is necessary for the normal development and function of myelinated axons.
Materials and Methods
Mouse lines.
Mice that expressed the Islet1-cre (Srinivas et al., 2001) were crossed to mice carrying the floxed allele of vglut2 (Hnasko et al., 2010). The breeding scheme was Islet1-cre+VGlutfl/− crossed with VGlut2fl/fl and VGlut2fl/−. These crosses generated Islet1-cre+/−VGlut2fl/fl mice referred to as VGlut2KO mice. Knock-outs were compared with both Islet1-cre+ and VGlut2fl/fl littermates. Recombination efficiency in RGC was determined by crosses to the Ai34 reporter mice (Madisen et al., 2010), which harbor a targeted mutation with a loxP-flanked STOP cassette preventing transcription of tdtomato (obtained from The Jackson Laboratory). Mice that expressed ET33-cre were crossed to mice carrying the floxed allele of vglut2 (Hnasko et al., 2010) and the Ai34 reporter mice (The Jackson Laboratory). The breeding scheme was ET33-cre+:tdtomato:VGlut2fl/− crossed with VGlut2fl/fl and VGlut2fl/−. These crosses generated ET33-cre+/−:tdtomato:VGlut2fl/fl mice and control ET33-cre+/−:tdtomato controls. NG2-creERT2 mouse was kindly provided by Dr. Anders Persson (University of California–San Francisco), and the tau-mGFP reporter mouse (Hippenmeyer, 2005) by John Rubenstein (University of California–San Francisco). Genotypes of all mice were determined by PCR analysis of tail or ear genomic DNA using appropriate primers. Mice used were both males and females. Experimental procedures were approved by the University of California–San Francisco Institutional Animal Care and Use Committee.
MD.
Monocular eyelid suture was performed in C57BL/6 at eye opening (around P15) during brief anesthesia with 70 mg/kg ketamine, 3.5 mg/kg xylazine hydrochloride, and 0.7 mg/kg acepromazine maleate, intraperitoneally (Maffei et al., 2006). The eyelid was covered with a thin layer of xylocaine gel, and the lid was secured with three mattress sutures (6-0 Vicryl). At the end of the deprivation period, mice were anesthetized, stitches were removed, and lid margins were separated. Eyes were flushed with sterile saline and checked for clarity under a microscope. Only mice without corneal opacities or signs of infection were used.
Compound action potential (CAP) recordings.
Following anesthetization of mice by isoflurane, ONs were dissected from CTL and MD eyes and placed into separate labeled incubation chambers for incubation with oxygenated recording solution (in mm) as follows: 125 NaCl, 2.5 KCl, 1 MgCl2, 2 CaCl2, 10 d-glucose, 1.25 NaH2PO4, and 25 NaHCO3 at room temperature. Following transfer to the recording chamber and under visualization by a light microscope (Nikon), the ends of the ONs were suctioned into separate fire-polished borosilicate glass suction electrodes using 2 ml precision syringes (Gilmont). A grid with 1 mm spacing allowed for the measurement of the ON length between the ends of the suction electrodes. Constant current stimulation (50 μs) was delivered to the suction electrode on one end of the nerve using a stimulus isolator (ISO-Flex, A.M.P.I.). Electrical signals were acquired using a differential AC amplifier (model 1700, AM Systems) and digitized using a digitizer (Axon Digidata 1440A, Molecular Devices). The recording chamber was constantly perfused by oxygenated recording solution delivered by gravity and removed via a peristaltic pump. Recordings of CAPs were taken at room temperature by stimulation of the ON at one end and measuring the response at the other end. Conduction velocity was calculated by dividing the length of the ON over the latency between the start of the stimulus artifact and the peak of the CAP. The normalized half-width was determined by measuring the latency between the half-amplitude preceding and half-amplitude following the peak of the CAP, and dividing over the length of the ON. For paired-pulse experiments, two stimulations at varying interstimulus intervals (4–13 ms) were used to evoke pairs of CAPs. The amplitude of the second CAP was normalized by dividing over that of the first CAP in a recording.
Acute dorsal lateral geniculate nucleus (dLGN) slice electrophysiology.
VGlut2KO and control mice were anesthetized via isoflurane inhalation. The mice were quickly decapitated, and their brains removed and placed in ice-cold cutting solution, containing the following (in mm): 78.3 NaCl, 33.8 choline chloride, 23 NaHCO3, 23 dextrose, 2.3 KCl, 1.1 NaH2PO4, 6.4 MgCl2, 0.45 CaCl2, oxygenated by continuous bubbling of 95% oxygen, 5% carbon dioxide. Brains were dissected and slices through the dLGN were prepared, using a vibrating microtome, along an angle parallel to and preserving much of the optic tract (OT) as it approached the dLGN, as previously published (Turner and Salt, 1998). Slices were immediately transferred to oxygenated warm (∼35°C) cutting solution for 25 min, then to warm ACSF containing the following (in mm): 125 NaCl, 25 NaHCO3, 10 dextrose, 2.5 KCl, 1.25 NaH2PO4, 1 MgCl2, 2 CaCl2, oxygenated for 25 min. Slices were allowed to return to room temperature, and recordings were performed at room temperature in ACSF, including 10 μm bicuculline to block inhibitory transmission. Relay cells within the dLGN were patched with electrodes pulled from glass capillaries (2.5–3.5 mΩ) and loaded with internal solution containing the following (in mm): 100 CsCl, 35 CsF, 10 EGTA, 10 HEPES, 8 sucrose, 0.1 methoxyverapamil HCl, pH 7.25. Cells were voltage-clamped while the OT was stimulated at varying intensities with a bipolar electrode (FHC). As stimulation intensity increased, additional retinal afferents were recruited, increasing the amplitude of the recorded evoked EPSC until a saturating intensity was found (Chen and Regehr, 2000). This maximal EPSC was determined at −70 and 40 mV, reflecting maximal synaptic current mainly through AMPA and NMDA receptors, respectively. Series resistance varied from 5 to 20 mΩ and was compensated by 50%–70%. No difference in input or series resistance was observed between VGlut2KO and control mice. Data were analyzed offline using Clampfit (Molecular Devices).
Retinal dye injections.
To label retinogeniculate axon paranodes with cholera toxin B conjugated with AlexaFluor-488 (CTB-488) (Invitrogen, 1 μg/μl), mice were anesthetized with ketamine/xylazine and the eyes were numbed with local anesthetic (proparacaine hydrochloride ophthalmic solution). A hole was made with a 30 gauge needle at the border of the iris and a pulled micropipette (VWR PCR Micropipettes with plunger) was used to inject 2 μl of the CTB-488 tracer in the vitreous space. To inject the tracer after MD, stitches were removed and lid margins were separated for intravitreal injection. After injection, the eyelid was stitched again. Mice were perfused 24 h later.
Immunohistochemistry.
Mice were anesthetized and intracardially perfused with 0.1 m phosphate buffer (PB) briefly followed by 4% PFA in 0.1 m PB. Brains, retinas, and ONs were removed and postfixed in the same fixative overnight at 4°C. Tissue was cryoprotected with a 30% sucrose solution for 24 h, and sections (30 μm thick) were cut with a sliding microtome (Thermo Scientific, HM 450) equipped with a freezing unit (Thermo Scientific, KS34). After blocking in 20% normal goat serum for 1 h at room temperature, free-floating sections were incubated with primary antibodies overnight at 4°C in PBS containing 0.3% Triton, 1% BSA, and 1% normal goat serum. The following primary antibodies were used: rat anti-MBP (1:100; Millipore Bioscience Research Reagents), mouse anti-CC1 (1:200; Abcam), rabbit anti-Caspr (1:2000; kindly provided by Elior Peles, Weizmann Institute of Science), mouse anti-NeuN (1:250; Millipore Bioscience Research Reagents), guinea pig anti VGlut-2 (1:1000; Synaptic Systems), and guinea pig anti VGlut-1 (1:1000; Synaptic Systems). Tissue sections were washed and incubated with the appropriate secondary antibodies in PBS containing 0.3% Triton, 1% BSA, and 1% normal goat serum for 1 h at room temperature: The AlexaFluor-488, -594, and -647 anti-rat, anti-rabbit, anti-guinea pig, and anti-mouse IgG secondary antibodies (Invitrogen) were used for fluorescence detection. Cell nuclei were examined with DAPI (Vector Laboratories).
Image acquisition and analysis.
Images were acquired using the Zeiss Axio Imager Z1 with ApoTome attachment and Axiovision software. Z-stacks ranging from 0.3- to 2-μm-thick single-plane images were captured. Images were subsequently processed with National Institutes of Health ImageJ for quantification. For OT measurements, images were taken from both sides of the brain in consecutive coronal sections starting from bregma −1.3 to −2.0. To calculate the number of CTB-488+ contralateral nodes, the threshold of the images was adjusted and the number of particles in each single-plane of a Z-stack automatically calculated and summed (size = 12–400; circularity = 0.3–1). The number of ipsilateral CTB-488+ nodes was manually counted in single planes of a Z-stack image using ImageJ. The number of contralateral and ipsilateral nodes was divided by the area occupied by the OT in each image. Measurements were taken from at least 6 tissue sections obtained from 3 or 4 mice in each group. Myelin internodes in the NG2-creERT2:tau-mGFP and ET33-cre:tdtomato mouse were traced and measured using NeuronJ (ImageJ). Images were processed with Adobe Photoshop/Illustrator (Adobe Systems) for presentation purposes. Student's t test, paired, was performed to establish statistical significance in experiments when individual measurements from both deprived (closed) and control (open) eye ON or OTs in the same mouse could be compared (see Figs. 1, 5). Student's t test, unpaired, was used when measurements from different experimental animals were compared (see Figs. 2, 4, 6). Internode length measurements were not normally distributed (K test), and Mann–Whitney U test was used for statistical significance (see Figs. 3, 7).
Figure 1.
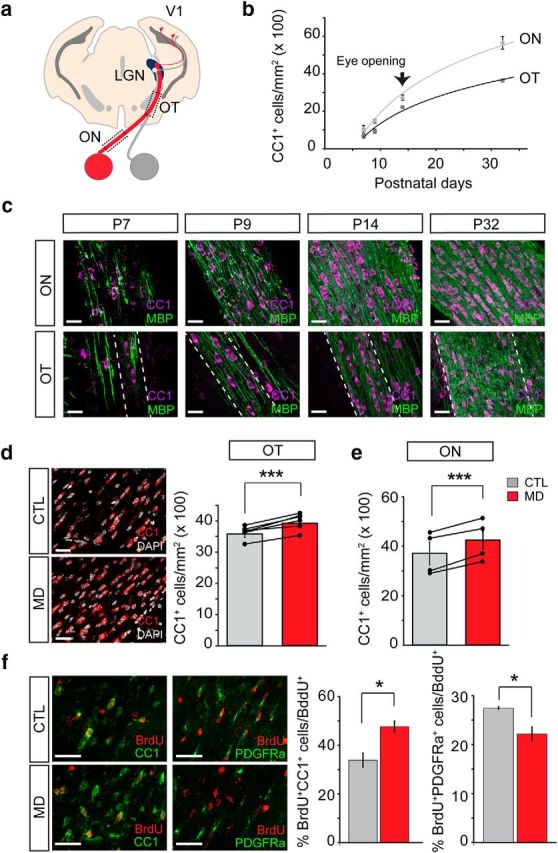
MD increases oligodendrogenesis. a, Schematic diagram of a brain section depicting the visual system. The axons of ganglion cells exit the eye via the ON, partially cross at the optic chiasm, and project to the contralateral and the ipsilateral LGN through the OT. The LGN receives input from both eyes and relays these messages to the primary visual cortex (V1). b, CC1+ mature oligodendrocyte density in the mice ON and OT (15 μm stack) during the first postnatal month. Eye opening takes place after the second postnatal week. c, Representative images of CC1+ (magenta) OLs and myelin staining (MBP, green) at different postnatal ages in the ON and OT. d, Mice were subjected to long-term MD from P15 to P32, and the contralateral deprived or ipsilateral control OTs were analyzed. Left, Representative coronal brain slice images of CC1 (red, mature oligodendrocytes) and DAPI (white, nuclear staining) immunostaining in control and monocularly deprived OT. Right, Quantification of the number of CC1+ cells in the contralateral and ipsilateral OT of MD mice (CTL = 35 ± 0.8 cells; MD = 40 ± 0.7; N = 6 mice; p = 0.001, paired t test). e, Quantification of the number of OLs in deprived and control ONs (CTL = 35.8 ± 4.5 cells; MD = 40.79 ± 3.45 cells; N = 4 mice; p = 0.007, paired t test). Black dots represent individual measurements. Lines connect CTL and MD measurements from the same animal. f, Monocularly deprived mice were injected with BrdU (100 μg/g) every day from P16 to P32, and the percentage of the cumulative proliferating mature oligodendrocytes (BrdU+/CC1+, CTL = 33.9%, n = 5 mice, MD = 47.7% n = 4 mice, p = 0.01, t test) and oligodendrocyte progenitor cells (BrdU+/ PDGFRα+, CTL = 27.5%, MD = 22.2%, p = 0.03, t test, n = 3 mice) in the deprived and control OTs was quantified. Scale bar, 30 μm. Data in bar graphs represent mean ± SEM. *p < 0.05, ***p < 0.001.
Figure 5.

Visual experience modulates ON action potential conduction properties. a, Representative traces of CAP recordings from isolated ONs projecting from control (black) and MD eyes (red) at P32. Note the increased latency from the stimulation (end of baseline) to the CAP peak and the widening of the CAP response in the MD eye compared with control. Traces are scaled to match CAP amplitude. b, Quantification of conduction velocity of CTL and MD nerves (CTL: 2.64 ± 0.080 m/s; MD: 1.85 ± 0.067 m/s, p = 0.004, paired t test). c, Half-width of CAP response normalized to the length of the nerve (CTL: 0.657 ± 0.077 ms/mm; MD: 1.030 ± 0.131 ms/mm, p = 0.03, paired t test). d, In paired-pulse recordings, peak amplitude of second CAP normalized over that of first CAP for various interstimulus intervals (4–13 ms). b, c, Individual dots indicate single-nerve measurements. Lines connect CTL and MD nerve measurements from the same animal. Bar graphs represent mean ± SEM. *p < 0.05, **p < 0.01.
Figure 2.

MD does not alter ON ultrastructural properties. a, Representative TEM images of P32 control mouse ON or visually deprived nerve. Scale bar, 0.1 μm. b, The percentage of myelinated axons in electron microscopy images was quantified in both control and MD mice (CTL = 8 6.9 ± 0.9%, MD = 88 ± 1.1%, p = 0.47, n = 1350 axons). c, Scatter plots of g-ratio as a function of axon diameter in control and MD mice display no significant difference in myelin thickness (average g-ratio CTL = 0.79; MD = 0.79, n ≥ 70 axons). d, Comparison of axon diameter distributions in deprived and normal nerves showed no differences on axonal ultrastructure (average axon diameter CTL = 0.68 μm, MD = 0.65 μm, n ≥ 1440 axons). ns, Not significant.
Figure 4.

MD increases the number of paranodes in the OT. a, Schematic diagram of a mouse brain and a coronal brain section depicting labeling of RGC axons after unilateral injection of the tracer CTB-488. The axons of ganglion cells project to the contralateral and the ipsilateral LGN through the OT. The OT region in the dotted box is used for quantification in all subsequent experiments. b, Low-magnification images of CTB-488 labeling of ipsilateral and contralateral OTs. Scale bar, 200 μm. c, The ability of the CTB-488 tracer to accumulate at the paranodal regions of nodes of Ranvier is illustrated with high-magnification representative images showing ipsilateral and contralateral axons and colocalization of CTB-488 (green) with the paranodal marker Caspr (magenta). Scale bar, 10 μm. Inset, Magnification of a single node of Ranvier. d, Mice were subjected to long-term MD from P15 to P32. One day before perfusion, the CTB-488 tracer was injected in the control open eye (CTL) or deprived eye (MD) and the average number of CTB-488 labeled paranodes along contralateral (ND = 83.4 ± 1.9; MD = 97.7 ± 1.5; p = 0.002, t test; n ≥ 3 mice) and ispsilateral (ND = 92.5 ± 4.6; MD = 86.9 ± 1; p = 0.28, t test; n = 4 mice) OT pathways quantified. In parallel, normal reared littermate mice (NR) were injected with the tracer at P31 and the average number of paranodes was quantified at P32 (Contra = 79.7 ± 1.4, CTL vs MD, p = 0.0009, CTL vs ND, p = 0.21, t test, n = 3 mice; Ipsi = 72.4 ± 5.2, CTL vs MD, p = 0.04, CTL vs ND, p = 0.02, t test, n = 4 mice). *p < 0.05, ***p < 0.001.
Figure 6.
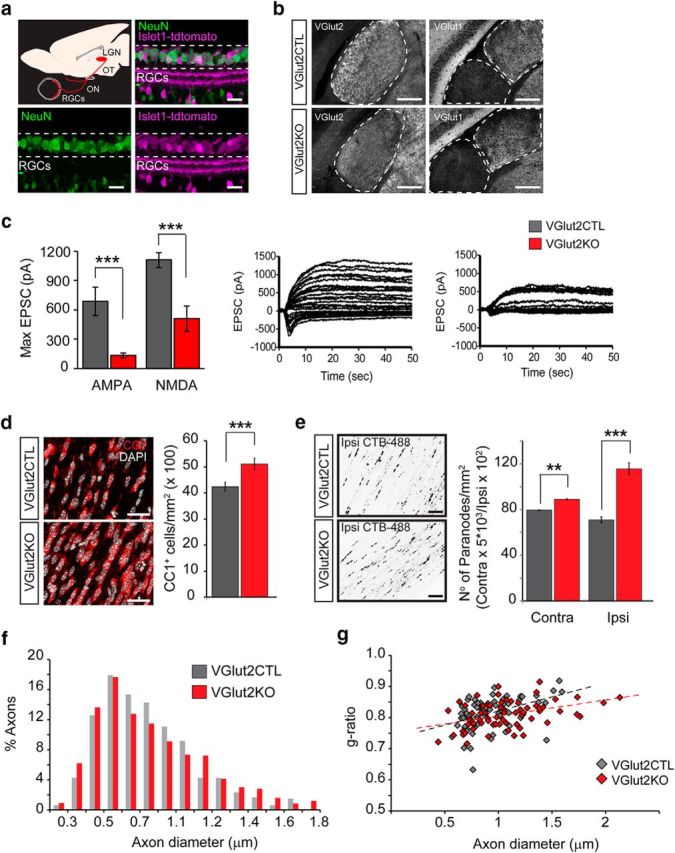
Genetic attenuation of synaptic glutamate release from retinal axons increases oligodendrogenesis and the number of nodes of Ranvier. The VGlut2 gene that mediates the uptake of glutamate into synaptic vesicles was conditionally ablated in RGCs under the control of the Islet1 (Islet-class factor 1) promoter by crossing Islet1-cre mice with floxed VGlut2 mice. a, Retinal section immunostained for NeuN (green) displaying tdTomato cre recombination reporter fluorescence (magenta) in most of the RGCs. Scale bar, 30 μm. b, Left, Sections through the dLGN immunostained for VGlut2 in the conditional VGlut2KO mice (islet1-cre:VGlut2fl/fl) and control littermates. Scale bar, 200 μm. Right, Sections through the dLGN and ventral LGN immunostained for VGlut1. c, Representative postsynaptic currents evoked by stimulation of the OT (at varying intensities), recorded from P9–P12 control and KO mice dLGN neurons. Each set of traces shows the superimposition of two experiments: recordings while holding the postsynaptic cell membrane potential at −70 mV to register mostly AMPAR-mediated responses, and recordings at 40 mV to elicit NMDAR-mediated currents. Maximal currents evoked at saturating stimulation intensity were quantified and displayed in the bar graphs. VGlut2 KO mice exhibited strongly attenuated total synaptic drive through both AMPA (CTL = 688 ± 146 pA; KO = 133 ± 28 pA; p = 0.0002) and NMDA receptors (CTL = 1108 ± 75 pA; KO = 508 ± 128 pA; p = 0.0007). d, Representative images and quantification of the number of CC1+ mature oligodendrocytes in KO and CTL mice (CTL = 42.42 ± 1.68, MD = 51.08 ± 2.19, p = 0.007, t test, n = 3 mice). Scale bar, 30 μm. Data are presented as mean ± SEM. e, The CTB-488 tracer was intravitreally injected in VGlut2KO and control mice to label nodes of Ranvier in RGC axons 1 d before death at P40. The average number of CTB-488+ paranodes in the contralateral and ispsilateral OTs increased after synaptic glutamate reduction (Contra VGlut2CTL = 79.4 ± 0.68, VGlut2KO = 88.97 ± 0.63, p = 0.008 t test; Ipsi VGlut2CTL = 70.97 ± 4.87; VGlut2KO = 115.5 ± 10.23; p = 0.0005, t test, n = 3 mice). f, Axon diameter distribution was analyzed in electron microscopy images of P14 VGlut2KO and control mice ONs (CTL = 0.74 ± 0.01, KO = 0.76 ± 0.01, p = 0.17, t test, n ≥ 475 axons). g, Scatter plots of g-ratio as a function of axon diameter in control and KO mice display no significant difference in myelin thickness (average g-ratio CTL = 0.81; KO = 0.80; p = 0.47, t test, n = 70 axons). **p < 0.01, ***p < 0.001.
Figure 3.
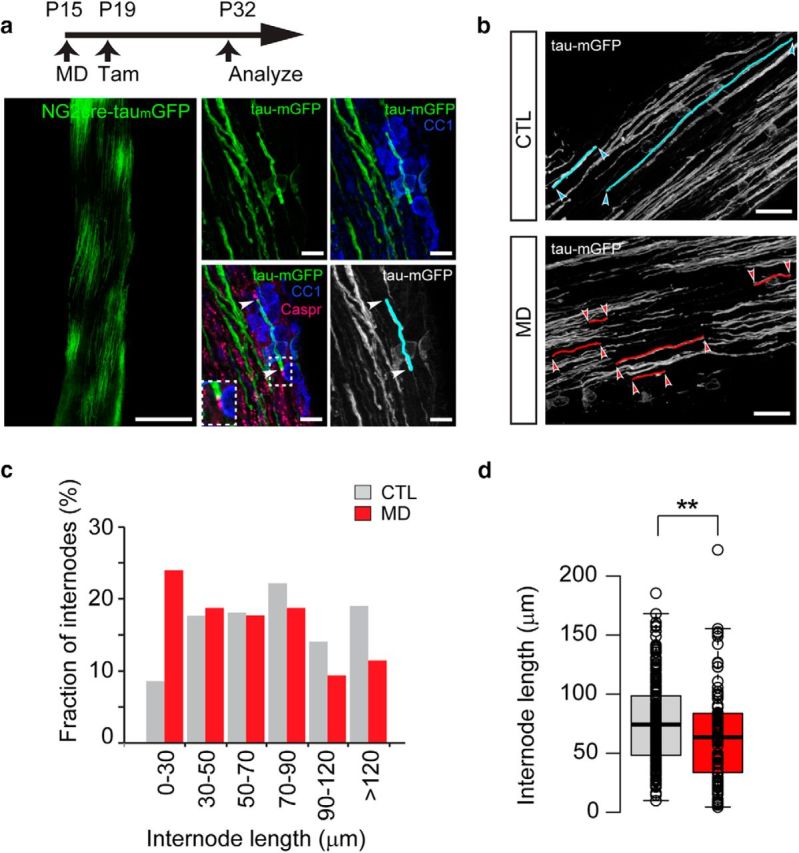
Visual experience regulates myelin internode length establishment during development. a, MD was performed in NG2-creERT2:tau-mGFP mice from P15 to P32 and new myelin generated during that period in the normal and deprived ON was labeled upon injection of tamoxifen at P19. Left, Representative low-magnification image of a longitudinal NG2-creERT2:tau-mGFP mice ON section at P32. Scale bar, 200 μm. Right, High-magnification images immunostained with CC1 (blue) show sparse labeling of mature oligodendrocytes (green) and immunostaining with Caspr (magenta) used to identify nodes of Ranvier (arrowheads). Myelin internodes were traced (cyan) and their length measured using NeuronJ plugin for ImageJ. Scale bar, 10 μm. b, Representative images of traced GFP+ myelin internodes in control (blue) and deprived (red) ONs of NG2-creERT2:tau-mGFP mice. c, Distributions of internode lengths for OLs born during MD in ONs from open and closed eyes. d, Box-plot of internode lengths measured from control and MD nerves. Center lines indicate the medians (CTL = 74.39 μm, n = 221 internodes from 8 mice; MD = 63.55 μm, n = 116 internodes from 7 mice; p = 0.008, Mann–Whitney U test). Box limits indicate the 25th and 75th percentiles. Whiskers extend to the 5th and 95th percentiles (Altman). Dots represent outliers. Open circles represent data points. **p < 0.01.
Figure 7.

RGC glutamate neurotransmission regulates internode length. a, Left, Schematic diagram of a coronal brain section depicting sparse colabeling of ipsilateral-projecting RGC axons genetically using the reporter mouse ET33-cre:tdtomato (purple) and upon unilateral injection of the tracer cholera toxin B conjugated with AlexaFluor-488 (CTB-488, green). Right, Representative images of the ET33-cre:tdtomato mice showing the genetically labeled OT (scale bar, 400 μm) and colocalization of the reporter and the tracer in RGC axon terminals at the LGN (scale bar, 20 μm). b, Left, Representative merged images showing genetically labeled axons (ET33-cre:tdtomato) and CTB-labeled nodes of Ranvier in the OT. Myelin internode lengths were measured as the distance between two CTB-labeled nodes (arrowheads) in ET33-tdtomato axons. Scale bar, 20 μm. Right, Box-plot of internode lengths measured from control ET33-cre:tdtomato mice and after conditionally ablating VGlut2 from ET33-cre:tdtomato-expressing neurons (ET33-cre:tdtomato:VGlut2fl/fl) at P20–P40. Center lines indicate the medians (CTL = 74.39 μm n = 221 internodes from 8 mice; MD = 63.55 μm n = 116 internodes from 7 mice; p = 0.029 by Mann–Whitney U test). Box limits indicate the 25th and 75th percentiles. Whiskers extend to 5th and 95th percentile (Altman). Dots indicate outliers. Open circles represent data points. *p < 0.05.
Electron microscopy.
For electron microscopy, animals were perfused through the left ventricle of the heart with 1.25% glutaraldehyde, 2% PFA in 0.1 m sodium cacodylate, pH 7.4, after an initial flush with 0.1 m sodium cacodylate, pH 7.4. Tissue was then processed at the Electron Microscope Core facilities, Gladstone Institutes (San Francisco) or at the electron microscopy core at University of California–Berkeley. Tissue was postfixed in 2% osmium tetroxide in the same buffer, then block stained with 2% aqueous uranyl acetate, dehydrated in acetone, infiltrated, and embedded in LX-112 resin (Ladd Research Industries). Samples were ultrathin sectioned on a Reichert Ultracut S ultramicrotome and counterstained with 0.8% lead citrate. Grids were examined on a JEOL JEM-1230 transmission electron microscope (JEOL) and photographed with the Gatan Ultrascan 1000 digital camera (Gatan). G-ratios of myelinated fibers were calculated as the ratio of the diameter of the axon to the diameter of the axon with the myelin sheath, measured using ImageJ software.
Results
MD increases oligodendrogenesis in the OT
RGC axons that synapse onto LGN neurons in the thalamus constitute the retinogeniculate white matter tract, which can be divided in two main regions, the ON and the OT. Retinal axons from one eye run along the ON before entering the brain at the level of the optic chiasm where they partially cross to the contralateral hemisphere forming the OT (Fig. 1a). Myelination is the culmination of a process that involves proliferation and differentiation of OPCs into mature oligodendrocytes and formation of compact myelin around axons. Developmental analysis of differentiated oligodendrocytes and myelination in the ON and OT (Fig. 1b,c) display a similar stereotyped developmental progression in both pathways, where OPC differentiation and myelination initiate during the first postnatal week, followed by an active period of myelination to approximately postnatal day 30 (P30). After eye opening at P14, the retinogeniculate pathway is still undergoing profound changes in myelination. To investigate whether visual experience impacts this ongoing developmental oligodendrogenesis, we performed long-term MD from P15 to P32. Unexpectedly, the density of CC1+ mature oligodendrocytes after MD increased by 15% in the contralateral deprived OT compared with the control ipsilateral open eye tract, suggesting that oligodendrogenesis is enhanced by visual deprivation (Fig. 1d). This observation was not limited to the OT as the number of OLs in the deprived ON was also significantly increased compared with control nerves (Fig. 1e). To determine whether this increase is due to an increase in OPC proliferation or an increase in differentiation, we performed cumulative BrdU experiments during the deprivation period (Fig. 1f). After long-term MD, the majority of BrdU+ cells were Olig2+ oligodendroglial lineage cells in both the deprived and control OTs (∼90%). Newly formed mature OLs comprised 34% of BrdU+ cells in controls, but 48% were newly formed BrdU+, CC1+ OLs in the deprived OT. Together with an increase in new OLs, we observed a decrease in newly formed OPCs (BrdU+, PDGFRα+), suggesting that visual deprivation increases the differentiation of OPCs into OLs without altering proliferation.
Visual experience does not change the number of myelinated axons or myelin thickness
If visual deprivation increases the number of oligodendrocytes, what are the effects of visual experience on myelination? To answer this question, we performed electron microscopic analysis of visually deprived and control open eye ONs at P32 (Fig. 2a). Myelination of the ON was nearly complete in both control (87.9 ± 1.17% myelinated axons) and deprived nerves (86.9 ± 0.97% myelinated axons; Fig. 2b). These results demonstrate that myelination of deprived RGC axons proceeds at the same rate as control axons subjected to normal visual experience. Changes in the thickness of myelin in relation to axonal diameter (g-ratio) can modulate fiber conduction velocity and are widely used as a functional and structural index of optimal axonal myelination. We did not observe changes on myelin thickness in deprived nerves compared with control (Fig. 2c). In addition, analysis of the EM images did not display a change in the density of axons (CTL = 0.81 ± 0.027; MD = 0.8 ± 0.028 axons/μm2) or the distribution of axon diameters due to deprivation (Fig. 2d). Thus, increased oligodendrogenesis is not related to changes in the number of myelinated axons, myelin thickness, or changes in the total number or size of target axons.
MD reduces the length of myelin internodes
Oligodendrocytes have the capacity to myelinate multiple axons and exhibit great variability in the length and number of myelin internodes throughout the CNS (Chong et al., 2012). To explore the possibility that visual experience regulates internode length (IL), we sparsely labeled oligodendrocytes and their myelin internodes during the deprivation period (Fig. 3a). Tamoxifen injection in the NG2-creERT2:tau-mGFP mouse stimulates cre-recombination in OPCs that upon differentiation express mGFP, revealing myelin morphology (Young et al., 2013). MD was performed on NG2-creERT2:tau-mGFP mice (at P15), tamoxifen was administered at P19 and ONs from the open and closed eyes were analyzed at P32. mGFP-expressing cells colocalized with CC1 confirming the utility of the oligodendrocyte reporter (Fig. 3a). The mean GFP fluorescence intensity in control and deprived nerves was not significantly different (CTL = 20.1 ± 1.8 a.u.; MD = 17.8 ± 0.3 a.u.; paired t test = 0.34), suggesting that the overall extent of myelin generated in both conditions was the same. To identify single myelin internodes, tissue was immunostained with the paranodal marker Caspr, and myelin internodes were traced and measured based on the presence of Caspr staining at both ends of the GFP+ myelin segments (Fig. 3a,b). Myelin internodes in both open eye and closed eye nerves showed high variability in length (CTL = 9.7–185; MD = 4.4–222; Fig. 3b,d), but we measured a higher proportion of short myelin internodes in the deprived nerve compared with controls (Fig. 3b). The IL for OLs generated in the deprived ON compared with the open eye nerve was significantly shorter, with a median IL of 62.2 μm versus 74.4 μm, respectively (Fig. 3d). These results suggest that MD alters the pattern of internodal length on RGC axons and suggest that visual experience may fine-tune the structure of myelinated fibers.
Myelination of individual axons is sensitive to the function of surrounding axons
Each OT contains ∼90% of contralateral retinal axons from one eye and 10% of ipsilateral-projecting fibers from the other eye (Fig. 4a). Therefore, it is possible to trace and examine axons from a single eye that project to both ipsilateral and contralateral hemispheres. This arrangement of distinct axonal pathways is ideally suited for the investigation of the specificity between neuronal changes (via visual stimuli) and the changes in myelination. We exploited the ability of the tracer cholera toxin B (conjugated with AlexaFluor, CTB-488) to label distinctively contralateral and ipsilateral RGC axons (Fig. 4b) and accumulate in the paranodal regions of RGC axons after injection into the eye (Fig. 4c). The axonal membrane at the limits of myelin segments contains characteristic molecules, such as the contactin-associated protein Caspr, which can be used to identify paranodes. The CTB tracer colocalizes with Caspr in RGC axons (Fig. 4c), allowing to specifically measure the number of nodes in contralateral- and ipsilateral-projecting RGC axons. We reasoned that, if visual deprivation decreases the length of myelin segments, the number of nodes of Ranvier and paranodes would increase after deprivation. We injected CTB-488 in monocular deprived (from P15 to P32) or normally reared mice (NR) and analyzed the paranodes in the contralateral OT (Fig. 4d). Confirming the IL measurement results in the ON, the average number of CTB-488-labeled paranodes along the deprived contralateral tract after monocular eye closure increased by 22% compared with control littermates. We next set out to determine whether we could detect changes in myelination in the ipsilateral-projecting deprived axons that run parallel to the contralateral axons from the open eye. The number of paranodes on ipsilateral-projecting axons in monocular deprived mice increased by 20% compared with normally reared mice (Fig. 4d). These results suggest that decreased visual input increases the number of nodes and that a small population of deprived axons (the ipsilateral-projecting axons) show increased paranodes despite being surrounded by a much larger population of contralateral axons receiving normal visual input. Are the changes in the number of nodes specific to the deprived axons? To answer this question, mice were subjected to MD as described before, and CTB-488 was injected into the open eye instead of the deprived eye (Fig. 4d). The number of paranodes in the contralateral open eye axons was indistinguishable from the normally reared mice; but surprisingly, we found a significant increase in paranodes in the ipsilateral axons projecting from the open eye, that run in parallel to the deprived axons; this finding was similar to the increased paranodes observed on deprived ipsilateral axons. Therefore, changes in myelination are not specific to the manipulated axons, suggesting that myelination of individual axons is sensitive to the function of surrounding axons.
Visual experience modulates action potential conduction properties
As MD results in significantly shorter myelin internodes and increased number of nodes of Ranvier, we hypothesized that this would lead to functional changes reflected by decreased action potential conduction velocity measurements. We measured CAPs, the sum of the firing of action potentials from individual axons, from isolated ONs associated with MD and CTL eyes (Fig. 5). All of the CAP responses that we observed contained a large peak, which was identified based on latency and the shape of the evoked response (Devaux et al., 2002; Chang et al., 2014). Consistent with our hypothesis, we found that MD resulted in a 22.1% reduction in the conduction velocity compared with CTL (Fig. 5a,b). We also noticed that the width of the CAP response was 56.8% wider in MD nerves compared with CTL (Fig. 5c), suggesting that changes in IL not only slow down conduction but also alter the range of conduction velocities in the nerve. To test for possible effects on CAP refractory periods, we also performed paired-pulse experiments and did not observe significant differences in the recovery from inactivation between deprived and nondeprived nerves (Fig. 5d). These findings suggest that visual experience modulates conduction velocity of ON fibers and that this modulation might be caused by changes in myelin internode length.
Genetic attenuation of glutamate neurotransmission from RGCs increases the number of nodes and reduces the length of myelin internodes
For visual experience to modulate myelin sheath structure and conduction velocity, oligodendroglial cells must sense some aspect of neuronal activity. We hypothesized that synaptic neurotransmitter signaling from axons to oligodendroglial cells is well suited to convey changes in visual experience and regulates several aspects of myelination. To test this hypothesis, we conditionally ablated the vglut2 gene from RGCs using cre-recombinase driven by the Islet1 promoter, expressed in sensory neurons (VGlut2KO; Fig. 6). VGlut2 is responsible for glutamate uptake into synaptic vesicles, and glutamate is the main neurotransmitter used by RGCs. The expression of cre-recombinase driven by the Islet1 promoter was analyzed using a floxed-tdtomato reporter confirming recombination of most retinal neurons (Fig. 6a). Immunostaining of VGlut2 at the level of the LGN displayed a significant decrease in the expression of VGlut2 in retinogeniculate terminals without eliciting compensatory overexpression of VGlut1 (Fig. 6b). To determine whether synaptic transmission is reduced in the VGlut2KO, we recorded postsynaptic responses of LGN neurons to OT stimulation (Fig. 6c). Both AMPA- and NMDA-mediated response amplitudes of LGN neurons in VGlut2KO mice slices were reduced compared with control littermates. Once confident that the VGlut2KO mice display all of the phenotypic signs expected for decreased glutamatergic synaptic neurotransmission from retinal axons, we assessed the effects on oligodendrogenesis by measuring the density of mature oligodendrocytes in control and KO adult mice (P40) OTs. Decreased neurotransmission led to increased numbers of mature CC1+ OLs, consistent with our findings from the MD (Fig. 6d). We next asked whether knockdown of VGlut2 impacts the number of paranodes in the OT of adult mice by injecting CTB-488 tracer unilaterally (Fig. 6e). The results display a significant increase in the number of paranodes in both contralateral and ispsilateral axons of the VGlut2KO mice compared with control littermates. To analyze myelin and the axonal ultrastructure, electron microscopic images from control and KO ONs were analyzed (Fig. 6f,g). The percentage of myelinated axons in control P14 nerves was 45.7 ± 1.9, compared with 52.4 ± 1.5 in VGlut2KO nerves (t test = 0.09). We also found no changes in the average g-ratio, indicating that the thickness of myelin did not change with decreased glutamate neurotransmission. Importantly, axon diameter distribution and axon density (CTL = 0.86 ± 0.05; MD = 0.83 ± 0.03 axons/μm2) were normal in the KO mice, indicating that the oligodendrocyte and paranodal changes observed are not due to changes in axon density or size. To investigate whether the change in the number of nodes is due to changes in internode length as seen after MD, we used a conditional KO mouse where a small percentage of RGC axons were sparsely labeled and their glutamate synaptic release specifically altered (Fig. 7). Sparse labeling and knockdown were achieved using the ET33 SERT promoter that expressed cre-recombinase specifically in ipsilateral-projecting RGCs (Koch et al., 2011). The glutamatergic synaptic transmission in the ET33-cre:VGlut2fl/fl mice has been previously reported to be selectively and dramatically reduced in the ipsilateral retinogeniculate pathway (Koch et al., 2011). To be able to measure internodal lengths, we injected the CTB tracer that specifically labels axonal paranodes (Fig. 4c) and analyze the ipsilateral OT at P40. This approach allows for the double genetic and tracing labeling of ipsilateral RGC axons as demonstrated by the colocalization of tdtomato and CTB-488 in the axon terminals in the ipsilateral LGN (Fig. 7a). The distance between nodes of Ranvier was quantified as stretches of tdtomato+ axons between two CTB+ nodes of Ranvier in control and VGlut2KO RGC axons (Fig. 7b). As previously observed in the overall population of RGC axons (Fig. 4), internodal lengths vary greatly in ipsilateral-projecting RGCs (from 12 to 170 μm). Axons with reduced glutamate neurotransmission also displayed a wide range of ILs, but the median internode length in the KO mice was shorter compared with controls (49.8 ± 4.07 μm vs 61.9 ± 3.4 μm). These results phenocopy the changes that we previously observed after MD and suggest that activity-dependent glutamate neurotransmission may modulate myelin internode lengths.
Discussion
Our results provide further support to the concept that myelination is modulated in an activity-dependent, albeit in a non–cell-autonomous manner, and are the first to functionally demonstrate that the conduction of myelinated fibers is fine-tuned by sensory experience.
Sensory experience and myelination
There is some evidence that both oligodendrocytes and the myelination process itself might be sensitive to visual experience, but the effects and conclusions differ among the studies. Early work in the ON showed that dark rearing resulted in reduced myelination (Gyllensten and Malmfors, 1963) and, conversely, premature eyelid opening accelerated the onset of myelination (Tauber et al., 1980). Intravitreal injection of TTX in the mouse to block RGC electrical activity at P4 affected the onset of myelination, whereas TTX injection at P5 did not have any effects (Demerens et al., 1996). Other studies found an increased number of myelinated axons in the ON after long-term dark rearing (Fukui et al., 1991) or no relationship between early visual experience and myelination (Moore et al., 1976). We have manipulated visual experience by long-term unilateral eyelid closure (P15-P32) and analyzed the consequences on the myelin deposited along the deprived and open eye RGC axons. Our results suggest that the morphogenesis of myelinated fibers during this developmental window is dependent on environmental experience. The changes that we observe are restricted to the spacing between nodes of Ranvier (internode length) without altering overall myelin levels or myelin thickness (Figs. 2–4). Surprisingly, after MD we also observed an increase in oligodendrogenesis that is due to an increase in differentiation (Fig. 1). Conversely, early social isolation studies report a reduction in the thickness of myelin in the prefrontal cortex without affecting the number of oligodendrocytes (Liu et al., 2012; Makinodan et al., 2012). In the barrel cortex, whisker trimming has also been reported to reduce oligodendrogenesis (Hill et al., 2014). Increasing neuronal activity with optogenetic manipulation of neurons from the premotor cortex increased oligodendrogenesis and myelin thickness (Gibson et al., 2014). The differences between these studies and our results are probably due to the different brain regions analyzed. The intricate neuronal connections in the cortex preclude straightforward conclusions about the causes that underlie the changes on myelination. MD abolishes visually evoked responses without affecting RGC spontaneous activity. It is unclear what specific changes in the pattern of activity produced by MD in RGC neurons (i.e., changes in firing rate, frequency, degree of correlative firing between neighboring axons) are responsible for the effects that we observe on myelination. Different visual manipulations have very different effects in the firing pattern of postsynaptic neurons that lead to different behavioral outcomes. Both retinal inactivation and MD do not change the mean firing rate of postsynaptic LGN neurons, but the absence of visual stimuli in MD decreases correlative firing in postsynaptic LGN neurons, whereas retinal inactivation causes an increase in thalamic bursting (Linden et al., 2009). As a consequence, MD causes long-term synaptic depression of deprived-eye responsiveness, whereas retinal inactivation has no effect on deprived-eye responsiveness. Manipulations that alter activity in different ways may also produce diverse effects on myelination and oligodendroglial cell physiology.
The role of activity-dependent synaptic vesicular glutamate release in myelination
Glutamate alters the proliferation, migration, and differentiation of OPCs as well as the myelinogenic potential of OLs in vitro (Gallo et al., 1996; Yuan et al., 1998; Gudz et al., 2006; Wake et al., 2011, 2015); however, direct functional in vivo evidence of the role of glutamate and the underlying myelin changes is lacking. Conditional deletion of VGlut2, which encodes the protein that loads glutamate into vesicles in RGCs, altered myelin internode lengths without changing the total myelin coverage. Thus, our results suggest that synaptic glutamate might fine-tune myelin profiles in vivo without being a major driver of the myelination program. Oligodendroglial cells express a wide repertoire of neurotransmitter receptors, including ionotropic and metabotropic glutamate receptors. In all brain regions examined, neurons and OPCs communicate via classic chemical glutamatergic synapses that elicit AMPAR-mediated postsynaptic currents in OPCs (Kukley et al., 2007; Ziskin et al., 2007; De Biase et al., 2010). This axon-OPC signaling is uniquely positioned to monitor the firing patterns of surrounding neurons and mediate activity- and experience-dependent fine-tuning of myelination. It is possible that initial synaptic contacts between OPCs and axons could regulate the initial positioning of oligodendroglial cells along the axon and determine the structure of the subsequent transformation into myelin sheaths (Almeida and Lyons, 2014). Blockade of neuronal activity and AMPAR reduces OPC process extension and branching in vitro (Fannon et al., 2015). Both OPCs and OLs express functional NMDA receptors (Káradóttir et al., 2005; Ziskin et al., 2007) that could allow oligodendroglial cells to sense fluctuations in ambient glutamate levels and respond to extrasynaptic release or spillover from nearby neuronal synapses. In vitro, NMDARs switch myelination to an activity-dependent program in the presence of growth factors (Lundgaard et al., 2013), but in vivo studies indicate that they are not required for normal OPC physiology and myelination (De Biase et al., 2011; Guo et al., 2012). Vesicular glutamate can be released from axons by both synaptic and nonsynaptic mechanisms. In vitro, glutamate vesicle fusion from axonal swellings (varicosities) that lack identifying features of synapses induces Ca2+ increases in OPCs and may serve to promote myelination (Wake et al., 2015). Because this mode of communication can be functional in the absence of neuronal activity (Wake et al., 2015), it could represent an oligodendroglial-axonal recognition tool for myelination. In our studies, deletion of VGlut2 decreased AMPA- and NMDA-mediated synaptic transmission in postsynaptic LGN neurons, but we have not directly measured whether extrasynaptic secretion of glutamate is also reduced; therefore, we cannot exclude the possibility that nonsynaptic glutamate communication in vivo regulates other properties of myelination not described here.
How is myelin internode length along axons established?
Oligodendrocytes have the capacity to myelinate multiple axons and exhibit great variability in the number and lengths of myelin internodes throughout the CNS (Chong et al., 2012). Our findings suggest that visual experience modulates myelin sheath length and that activity-dependent synaptic vesicular glutamate release may provide spatial cues for the placement of myelin internodes of different lengths. Both MD and attenuation of synaptic neurotransmitter release only moderately change ILs, suggesting that other control mechanisms must exist. Early ultrastructural investigation demonstrated that myelinated fibers in the PNS develop stereotyped ratios between axon caliber, myelin thickness, and internodal distances. With increasing axon calibers, myelin internodes are proportionally thicker and longer (Rushton, 1951). Oligodendroglial cells are indeed sensitive to passive geometric properties of axons. OPCs in culture can myelinate plastic nanofibers but only ensheath fibers above a minimum threshold (Lee et al., 2012). Furthermore, a recent elegant paper demonstrated that oligodendrocytes have an intrinsic property to respond to fiber diameter without molecular instruction from axons (Bechler et al., 2015). Surprisingly, oligodendrocytes from different brain regions are programmed to generate sheath lengths that reflect their in vivo origin. The dimensional correlations between internode length and axon diameter seem to apply to large myelinated fibers, but small CNS axons show large variation from the predicted values, even in the same brain areas (Ibrahim et al., 1995; Perrot et al., 2007; Lasiene et al., 2008). We hypothesize that default intrinsic and biophysical mechanisms interplay with activity-dependent neurotransmission to provide the spatial cues that establish the final IL. A series of recent studies in zebrafish do not report changes in internode length when neuronal activity or vesicular release is completely blocked (Hines et al., 2015; Mensch et al., 2015), but interestingly, shorter internodes were observed when vesicular release was blocked in sparse axons or when activity was increased (Hines et al., 2015). The authors suggest that competition-based mechanisms control sheath length and thus are influenced by neighboring axons. Our findings also suggest that, rather than absolute changes, the relative difference in neuronal activity of neighboring axons might shape myelination. The changes that we observe after MD are not restricted to deprived axons; ipsilateral-projecting RGC axons from the open eye that run in parallel to deprived contralateral axons also display an increase in the number of nodes of Ranvier (Fig. 4d). This result suggests that activity modulates internode length in a non–cell-autonomous manner. It has been postulated that oligodendroglial cells might integrate functional information from multiple axons, just as neurons integrate information from multiple presynaptic inputs and myelinate accordingly (Mangin and Gallo, 2011).
Control of internodal length to adjust conduction velocity
Myelination can have a dramatic impact on axonal conduction with specific structural factors, such as myelin thickness and internode length, further modulating final conduction velocity values of axons. It has been hypothesized that neuronal activity-driven changes in the extent and structure of myelination would lead to conduction velocity changes of the underlying circuits, but there are no direct experimental measurements confirming the structure–function relationship in myelinated fibers in the CNS. Theoretical modeling and measurements in the PNS suggest that conduction velocities increase when IL increases between 200 and 600 μm (Court et al., 2004), but CV is not significantly altered when IL varies over larger values (Wu et al., 2012; Simpson et al., 2013). Our findings demonstrate that a 13% reduction in myelin internodes during MD (Fig. 3) is associated with a 22% reduction in axonal conduction velocity of the deprived ONs (Fig. 5). We also noticed that the width of the CAP response is wider after MD (Fig. 5c), suggesting that myelin internode length changes not only slow down axonal conduction but also alter the distribution of conduction velocities in the nerve. The ON has multiple conduction latency groups of fibers that could be important in conveying certain aspects of visual information (Gao et al., 2010). Therefore, changes in internodal length might not only impact conduction speed but also coding of visual information. Together, our results show that the quality of sensory experience during early postnatal life has a crucial role in the development of myelinated axons and the subsequent conduction velocity, suggesting the possibility of dynamically modifying action potential propagation of neural circuits in the context of a changing environment.
Footnotes
This work was supported by National Multiple Sclerosis Harry Weaver Neuroscience Scholar Award JF 2142-A-2, National Institutes of Health/National Institute of Neurological Disorders and Stroke NS062796, Rachleff Family Endowment to J.R.C., the National Institutes of Health T32 Training Grant EY007120 to D.Q.D., and the Walt and Lilly Disney Amblyopia Research Award to E.M.U. We thank C. de la Cruz for advice on retinal injections; J.S. Espinosa for advice on MD experiments; M.L. Wong for ultrathin sectioning for electron microscopy analysis at the W.M. Keck Foundation Advanced Microscopy Laboratory at University of California–San Francisco, and R. Zalpuri for assistance with the electron microscopy at University of California Berkeley.
The authors declare no competing financial interests.
References
- Almeida RG, Lyons DA. On the resemblance of synapse formation and CNS myelination. Neuroscience. 2014;276:98–108. doi: 10.1016/j.neuroscience.2013.08.062. [DOI] [PubMed] [Google Scholar]
- Barres BA, Raff MC. Proliferation of oligodendrocyte precursor cells depends on electrical activity in axons. Nature. 1993;361:258–260. doi: 10.1038/361258a0. [DOI] [PubMed] [Google Scholar]
- Bechler ME, Byrne L, Ffrench-Constant C. CNS myelin sheath lengths are an intrinsic property of oligodendrocytes. Curr Biol. 2015;25:2411–2416. doi: 10.1016/j.cub.2015.07.056. [DOI] [PMC free article] [PubMed] [Google Scholar]
- Chang KJ, Zollinger DR, Susuki K, Sherman DL, Makara MA, Brophy PJ, Cooper EC, Bennett V, Mohler PJ, Rasband MN. Glial ankyrins facilitate paranodal axoglial junction assembly. Nat Neurosci. 2014;17:1673–1681. doi: 10.1038/nn.3858. [DOI] [PMC free article] [PubMed] [Google Scholar]
- Chen C, Regehr WG. Developmental remodeling of the retinogeniculate synapse. Neuron. 2000;28:955–966. doi: 10.1016/S0896-6273(00)00166-5. [DOI] [PubMed] [Google Scholar]
- Chong SYC, Rosenberg SS, Fancy SPJ, Zhao C, Shen YA, Hahn AT, McGee AW, Xu X, Zheng B, Zhang LI, Rowitch DH, Franklin RJM, Lu QR, Chan JR. Neurite outgrowth inhibitor Nogo-A establishes spatial segregation and extent of oligodendrocyte myelination. Proc Natl Acad Sci U S A. 2012;109:1299–1304. doi: 10.1073/pnas.1113540109. [DOI] [PMC free article] [PubMed] [Google Scholar]
- Court FA, Sherman DL, Pratt T, Garry EM, Ribchester RR, Cottrell DF, Fleetwood-Walker SM, Brophy PJ. Restricted growth of Schwann cells lacking Cajal bands slows conduction in myelinated nerves. Nature. 2004;431:191–195. doi: 10.1038/nature02841. [DOI] [PubMed] [Google Scholar]
- De Biase LM, Nishiyama A, Bergles DE. Excitability and synaptic communication within the oligodendrocyte lineage. J Neurosci. 2010;30:3600–3611. doi: 10.1523/JNEUROSCI.6000-09.2010. [DOI] [PMC free article] [PubMed] [Google Scholar]
- De Biase LM, Kang SH, Baxi EG, Fukaya M, Pucak ML, Mishina M, Calabresi PA, Bergles DE. NMDA receptor signaling in oligodendrocyte progenitors is not required for oligodendrogenesis and myelination. J Neurosci. 2011;31:12650–12662. doi: 10.1523/JNEUROSCI.2455-11.2011. [DOI] [PMC free article] [PubMed] [Google Scholar]
- Demerens C, Stankoff B, Logak M, Anglade P, Allinquant B, Couraud F, Zalc B, Lubetzki C. Induction of myelination in the central nervous system by electrical activity. Proc Natl Acad Sci USA. 1996;93:9887–9892. doi: 10.1073/pnas.93.18.9887. [DOI] [PMC free article] [PubMed] [Google Scholar]
- Devaux J, Gola M, Jacquet G, Crest M. Effects of K+ channel blockers on developing rat myelinated CNS axons: identification of four types of K+ channels. J Neurophysiol. 2002;87:1376–1385. doi: 10.1152/jn.00646.2001. [DOI] [PubMed] [Google Scholar]
- Fannon J, Tarmier W, Fulton D. Neuronal activity and AMPA-type glutamate receptor activation regulates the morphological development of oligodendrocyte precursor cells. Glia. 2015;63:1021–1035. doi: 10.1002/glia.22799. [DOI] [PubMed] [Google Scholar]
- Fukui Y, Hayasaka S, Bedi KS, Ozaki HS, Takeuchi Y. Quantitative study of the development of the optic nerve in rats reared in the dark during early postnatal life. J Anat. 1991;174:37–47. [PMC free article] [PubMed] [Google Scholar]
- Gallo V, Zhou JM, McBain CJ, Wright P, Knutson PL, Armstrong RC. Oligodendrocyte progenitor cell proliferation and lineage progression are regulated by glutamate receptor-mediated K+ channel block. J Neurosci. 1996;16:2659–2670. doi: 10.1523/JNEUROSCI.16-08-02659.1996. [DOI] [PMC free article] [PubMed] [Google Scholar]
- Gao E, DeAngelis GC, Burkhalter A. Parallel input channels to mouse primary visual cortex. J Neurosci. 2010;30:5912–5926. doi: 10.1523/JNEUROSCI.6456-09.2010. [DOI] [PMC free article] [PubMed] [Google Scholar]
- Gibson EM, Purger D, Mount CW, Goldstein AK, Lin GL, Wood LS, Inema I, Miller SE, Bieri G, Zuchero JB, Barres BA, Woo PJ, Vogel H, Monje M. Neuronal activity promotes oligodendrogenesis and adaptive myelination in the mammalian brain. Science. 2014;344:6183. doi: 10.1126/science.1252304. [DOI] [PMC free article] [PubMed] [Google Scholar]
- Gudz TI, Komuro H, Macklin WB. Glutamate stimulates oligodendrocyte progenitor migration mediated via an alphav integrin/myelin proteolipid protein complex. J Neurosci. 2006;26:2458–2466. doi: 10.1523/JNEUROSCI.4054-05.2006. [DOI] [PMC free article] [PubMed] [Google Scholar]
- Guo F, Maeda Y, Ko EM, Delgado M, Horiuchi M, Soulika A, Miers L, Burns T, Itoh T, Shen H, Lee E, Sohn J, Pleasure D. Disruption of NMDA receptors in oligodendroglial lineage cells does not alter their susceptibility to experimental autoimmune encephalomyelitis or their normal development. J Neurosci. 2012;32:639–645. doi: 10.1523/JNEUROSCI.4073-11.2012. [DOI] [PMC free article] [PubMed] [Google Scholar]
- Hill RA, Patel KD, Goncalves CM, Grutzendler J, Nishiyama A. Modulation of oligodendrocyte generation during a critical temporal window after NG2 cell division. Nat Neurosci. 2014;17:1518–1527. doi: 10.1038/nn.3815. [DOI] [PMC free article] [PubMed] [Google Scholar]
- Hines JH, Ravanelli AM, Schwindt R, Scott EK, Appel B. Neuronal activity biases axon selection for myelination in vivo. Nat Neurosci. 2015;18:683–689. doi: 10.1038/nn.3992. [DOI] [PMC free article] [PubMed] [Google Scholar]
- Hnasko TS, Chuhma N, Zhang H, Goh GY, Sulzer D, Palmiter RD, Rayport S, and Edwards RH. Vesicular glutamate transport promotes dopamine storage and glutamate corelease in vivo. Neuron. 2010;65:643–656. doi: 10.1016/j.neuron.2010.02.012. [DOI] [PMC free article] [PubMed] [Google Scholar]
- Ibrahim M, Butt AM, Berry M. Relationship between myelin sheath diameter and internodal length in axons of the anterior medullary velum of the adult rat. J Neurol Sci. 1995;133:119–127. doi: 10.1016/0022-510X(95)00174-Z. [DOI] [PubMed] [Google Scholar]
- Káradóttir R, Cavelier P, Bergersen LH, Attwell D. NMDA receptors are expressed in oligodendrocytes and activated in ischaemia. Nature. 2005;438:1162–1166. doi: 10.1038/nature04302. [DOI] [PMC free article] [PubMed] [Google Scholar]
- Koch SM, Dela Cruz CG, Hnasko TS, Edwards RH, Huberman AD, Ullian EM. Pathway-specific genetic attenuation of glutamate release alters select features of competition-based visual circuit refinement. Neuron. 2011;71:235–242. doi: 10.1016/j.neuron.2011.05.045. [DOI] [PMC free article] [PubMed] [Google Scholar]
- Kukley M, Capetillo-Zarate E, Dietrich D. Vesicular glutamate release from axons in white matter. Nat Neurosci. 2007;10:311–320. doi: 10.1038/nn1850. [DOI] [PubMed] [Google Scholar]
- Lasiene J, Shupe L, Perlmutter S, Horner P. No evidence for chronic demyelination in spared axons after spinal cord injury in a mouse. J Neurosci. 2008;28:3887–3896. doi: 10.1523/JNEUROSCI.4756-07.2008. [DOI] [PMC free article] [PubMed] [Google Scholar]
- Lee S, Leach MK, Redmond SA, Chong SY, Mellon SH, Tuck SJ, Feng ZQ, Corey JM, Chan JR. A culture system to study oligodendrocyte myelination processes using engineered nanofibers. Nat Methods. 2012;9:917–922. doi: 10.1038/nmeth.2105. [DOI] [PMC free article] [PubMed] [Google Scholar]
- Linden ML, Heynen AJ, Haslinger RH, Bear MF. Thalamic activity that drives visual cortical plasticity. Nat Neurosci. 2009;12:390–392. doi: 10.1038/nn.2284. [DOI] [PMC free article] [PubMed] [Google Scholar]
- Liu J, Dietz K, DeLoyht JM, Pedre X, Kelkar D, Kaur J, Vialou V, Lobo MK, Dietz DM, Nestler EJ, Dupree J, Casaccia P. Impaired adult myelination in the prefrontal cortex of socially isolated mice. Nat Neurosci. 2012;15:1621–1623. doi: 10.1038/nn.3263. [DOI] [PMC free article] [PubMed] [Google Scholar]
- Lundgaard I, Luzhynskaya A, Stockley JH, Wang Z, Evans KA, Swire M, Volbracht K, Gautier HO, Franklin RJ, Attwell D, Káradóttir RT. Neuregulin and BDNF induce a switch to NMDA receptor-dependent myelination by oligodendrocytes. PLoS Biol. 2013;11:e1001743. doi: 10.1371/journal.pbio.1001743. [DOI] [PMC free article] [PubMed] [Google Scholar]
- Madisen L, Zwingman TA, Sunkin SM, Oh SW, Zariwala HA, Gu H, Ng LL, Palmiter RD, Hawrylycz MJ, Jones AR, et al. A robust and high-throughput Cre reporting and characterization system for the whole mouse brain. Nat. Neurosci. 2010;13:133–140. doi: 10.1038/nn.2467. [DOI] [PMC free article] [PubMed] [Google Scholar]
- Maffei A, Nataraj K, Nelson SB, Turrigiano GG. Potentiation of cortical inhibition by visual deprivation. Nature. 2006;443:81–84. doi: 10.1038/nature05079. [DOI] [PubMed] [Google Scholar]
- Makinodan M, Rosen KM, Ito S, Corfas G. A critical period for social experience-dependent oligodendrocyte maturation and myelination. Science. 2012;337:1357–1360. doi: 10.1126/science.1220845. [DOI] [PMC free article] [PubMed] [Google Scholar]
- Mangin JM, Gallo V. The curious case of NG2 cells: transient trend or game changer? ASN Neuro. 2011;3:e00052. doi: 10.1042/AN20110001. [DOI] [PMC free article] [PubMed] [Google Scholar]
- Mangin JM, Kunze A, Chittajallu R, Gallo V. Satellite NG2 progenitor cells share common glutamatergic inputs with associated interneurons in the mouse dentate gyrus. J Neurosci. 2008;28:7610–7623. doi: 10.1523/JNEUROSCI.1355-08.2008. [DOI] [PMC free article] [PubMed] [Google Scholar]
- McKenzie IA, Ohayon D, Li H, Paes de Faria JP, Emery B, Tohyama K, Richardson WD. Motor skill learning requires active central myelination. Science. 2014;346:318–322. doi: 10.1126/science.1254960. [DOI] [PMC free article] [PubMed] [Google Scholar]
- Mensch S, Baraban M, Almeida R, Czopka T, Ausborn J, El Manira A, Lyons DA. Synaptic vesicle release regulates myelin sheath number of individual oligodendrocytes in vivo. Nat Neurosci. 2015;18:628–630. doi: 10.1038/nn.3991. [DOI] [PMC free article] [PubMed] [Google Scholar]
- Moore CL, Kalil R, Richards W. Development of myelination in optic tract of the cat. J Comp Neurol. 1976;165:125–136. doi: 10.1002/cne.901650202. [DOI] [PubMed] [Google Scholar]
- Perrot R, Lonchampt P, Peterson AC, Eyer J. Axonal neurofilaments control multiple fiber properties but do not influence structure or spacing of nodes of Ranvier. J Neurosci. 2007;27:9573–9584. doi: 10.1523/JNEUROSCI.1224-07.2007. [DOI] [PMC free article] [PubMed] [Google Scholar]
- Rosenberg SS, Kelland EE, Tokar E, De la Torre AR, Chan JR. The geometric and spatial constraints of the microenvironment induce oligodendrocyte differentiation. Proc Natl Acad Sci U S A. 2008;105:14662–14667. doi: 10.1073/pnas.0805640105. [DOI] [PMC free article] [PubMed] [Google Scholar]
- Rushton WA. A theory of the effects of fibre size in medullated nerve. J Physiol. 1951;115:101–122. doi: 10.1113/jphysiol.1951.sp004655. [DOI] [PMC free article] [PubMed] [Google Scholar]
- Simpson AH, Gillingwater TH, Anderson H, Cottrell D, Sherman DL, Ribchester RR, Brophy PJ. Effect of limb lengthening on internodal length and conduction velocity of peripheral nerve. J Neurosci. 2013;33:4536–4539. doi: 10.1523/JNEUROSCI.4176-12.2013. [DOI] [PMC free article] [PubMed] [Google Scholar]
- Srinivas S, Watanabe T, Lin CS, William CM, Tanabe Y, Jessell TM, Costantini F. Cre reporter strains produced by targeted insertion of EYFP and ECFP into the ROSA26 locus. BMC Dev Biol. 2001;1:4. doi: 10.1186/1471-213X-1-4. [DOI] [PMC free article] [PubMed] [Google Scholar]
- Tauber H, Waehneldt TV, Neuhoff V. Myelination in rabbit optic nerves is accelerated by artificial eye opening. Neurosci Lett. 1980;16:235–238. doi: 10.1016/0304-3940(80)90003-8. [DOI] [PubMed] [Google Scholar]
- Tomassy GS, Berger DR, Chen HH, Kasthuri N, Hayworth KJ, Vercelli A, Seung HS, Lichtman JW, Arlotta P. Distinct profiles of myelin distribution along single axons of pyramidal neurons in the neocortex. Science. 2014;344:319–324. doi: 10.1126/science.1249766. [DOI] [PMC free article] [PubMed] [Google Scholar]
- Turner JP, Salt TE. Characterization of sensory and corticothalamic excitatory. J Physiol 510. 1998;3:829–843. doi: 10.1111/j.1469-7793.1998.829bj.x. [DOI] [PMC free article] [PubMed] [Google Scholar]
- Wake H, Lee PR, Fields RD. Control of local protein synthesis and initial events in myelination by action potentials. Science. 2011;333:1647–1651. doi: 10.1126/science.1206998. [DOI] [PMC free article] [PubMed] [Google Scholar]
- Wake H, Ortiz FC, Woo DH, Lee PR, Angulo MC, Fields RD. Nonsynaptic junctions on myelinating glia promote preferential myelination of electrically active axons. Nat Commun. 2015;6:7844. doi: 10.1038/ncomms8844. [DOI] [PMC free article] [PubMed] [Google Scholar]
- Wu LM, Williams A, Delaney A, Sherman DL, Brophy PJ. Increasing internodal distance in myelinated nerves accelerates nerve conduction to a flat maximum. Curr Biol. 2012;22:1957–1961. doi: 10.1016/j.cub.2012.08.025. [DOI] [PMC free article] [PubMed] [Google Scholar]
- Young KM, Psachoulia K, Tripathi RB, Dunn SJ, Cossell L, Attwell D, Tohyama K, Richardson WD. Oligodendrocyte dynamics in the healthy adult CNS: evidence for myelin remodeling. Neuron. 2013;77:873–885. doi: 10.1016/j.neuron.2013.01.006. [DOI] [PMC free article] [PubMed] [Google Scholar]
- Yuan X, Eisen AM, McBain CJ, Gallo V. A role for glutamate and its receptors in the regulation of oligodendrocyte development in cerebellar tissue slices. Development. 1998;125:2901–2914. doi: 10.1242/dev.125.15.2901. [DOI] [PubMed] [Google Scholar]
- Ziskin JL, Nishiyama A, Rubio M, Fukaya M, Bergles DE. Vesicular release of glutamate from unmyelinated axons in white matter. Nat Neurosci. 2007;10:321–330. doi: 10.1038/nn1854. [DOI] [PMC free article] [PubMed] [Google Scholar]