

Abstract
Purpose
Aerobic exercise training in sedentary individuals improves physical fitness and various cardiovascular (CV) risk factors. Prior reports suggest that exercise training may adversely affect some risk factors in a small segment of the population. The purpose of this study was to investigate whether clinically significant worsening of CV risk variables was as or more prevalent among individuals randomized to a supervised endurance training program as compared to those randomized to a control condition.
Methods
Baseline and end of study measurements of resting systolic blood pressure (SBP) and fasting insulin (FI), triglycerides (TG), and HDL-cholesterol (HDL-C) and were obtained on 1188 healthy sedentary subjects from the following studies: DREW (N=464), INFLAME (N=162), University of Jyvaskyla study (N=140), and STRRIDE (N=422). Each study randomized subjects to 4- to 6-month supervised aerobic exercise programs or to a control group of no supervised exercise training. For our analyses, the respective control and exercise groups for each study were combined to create one control group (N=345) and one exercise group (n=843). For each of the 4 CV risk variables, we calculated the respective proportions of control and exercise group subjects whose baseline-to-followup changes were greater than or equal to prespecified adverse change (AC) thresholds (ref). Those thresholds were increases of ≥ 24 pmol/L for FI, ≥ 0.42 mmol/L for TG, ≥ 10 mm Hg for SBP, and a decrease of ≥ 0.12 mmol/L for HDL-C
Results
The respective proportions of subjects meeting the AC threshold in the control and exercise groups were 15.2% vs. 9.6% (p=0.02) for FI, 14.9% vs. 13.1% (p=0.37) for TG, 28.6% vs. 22.5% (p=0.03) for HDL-C, and 16.9% vs. 15.8% (p=0.52) for SBP. The mean changes in the control and exercise groups were 1.8 vs. −6.5 pmol/L (p < 0.0001) for FI, −0.03 vs. −0.11 mmol/L (p=0.02) for TG, −0.03 vs. 0.00 mmol/L (p=0.02) for HDL-C, and −1.9 vs. −2.0 mm Hg (p=0.36) for SBP.
Conclusion
Compared to control subjects, exercise subjects were not at an increased risk for meeting the AC thresholds for SBP, FI, TG, or HDL-C and significantly fewer exercise subjects met AC thresholds for FI, and HDL. Exercise subjects also had significantly more favorable mean changes in FI, TG, and HDL-C than control subjects. These findings do not support the concept that aerobic exercise training increases the risk of adverse changes in CV risk factors. and that, with respect to group responses
INTRODUCTION
Current public health recommendations are for adults to be physically active at a moderate intensity for ≥150 minutes per week, at a vigorous intensity for ≥75 minutes per week or a combination thereof (HHS 2008 Physical Activity Guidelines). These recommendations are based on studies showing that exercise training improves various cardiovascular, metabolic, and psychological measures (Boule; Bateman; Church references). However, due to individual heterogeneity, there is the possibility that physical activity can adversely affect one or more of these measures in some individuals. (PLOS ONE 2012) If so, it would be important to accurately identify and quantify such responses as this has become a controversial area in the field of lifestyle medicine.
In 6 pooled studies of sedentary subjects undergoing 4 to 6 months of aerobic exercise training, Bouchard et al. (PLOS ONE 2012) reported 8% to 13% adverse change (AC, defined precisely in the Methods below) rates from baseline to follow-up in resting systolic blood pressure (SBP), fasting insulin (FI), triglycerides (TG), and HDL-cholesterol (HDL-C). Bouchard et al. used data from the Dose Response to Exercise in Women (DREW) study; the Inflammation and Exercise (INFLAME) study; Studies of a Targeted Risk Reduction Intervention through Defined Exercise (STRRIDE); the University of Jyväskyä study; the Health, Risk Factors, Exercise Training And Genetics Family study (HERITAGE); and the University of Maryland Gene Exercise Research study (DREW, INFLAME STRRIDE, JYASKYLA, Univ of Maryland references). The first four studies included a group of control subjects who did not receive the exercise intervention while the latter two studies did not.
Bouchard et al. restricted their analyses to the subjects who received the exercise intervention and did not make comparisons to subjects who did not receive the intervention. This strategy can be problematic since in the absence of a control group who did not receive the intervention, it is difficult to discern the extent to which observed changes in the exercise group were due to factors independent of the exercise intervention, including day-to-day biological variation, technical variation associated with laboratory testing, and physiological change unrelated to exercise (e.g., stress, illness, or changes in diet). To address this issue, we compared the rates of AC between the exercise and control groups for the four studies that included a control group, restricting our analysis to the DREW, INFLAME, STRRIDE, and Jyaskyla cohorts.
METHODS
Data were obtained from 1188 healthy sedentary individuals enrolled in one of the following four studies: DREW, INFLAME, University of Jyvaskyla, and STRRIDE, that are. briefly described below.
Dose Response to Exercise in Women (DREW) Study
The DREW trial enrolled 464 sedentary, postmenopausal overweight or obese women with normal-to-high systolic blood pressure and randomized them to either to a non-exercise control group (N=102) or to one of three endurance exercise groups (N=362) which expended 4 kcal/kg, 8 kcal/kg, or 12 kcal/kg per week, respectively (Morss et al. MSSE 2004). Exercising women participated in 3 or 4 supervised training sessions each week for 6 months with target training intensity at the heart rate associated with 50% of each woman’s peak relative oxygen consumption (VO2peak).
Inflammation and Exercise (INFLAME) Study
The INFLAME study randomized 162 sedentary men and women with elevated C-reactive protein (≥ 2.0 mg/L but < 10.0 mg/L) to a nonexercise control group (N=82) or an endurance exercise group (N=80) that trained for 4 months (Thompson et al. Cont. Clin. Trials 2008). The exercise group trained in a supervised exercise laboratory and had a target exercise dose of 16 kcal/kg per week which roughly corresponds to 150–210 minutes of 60%–80% VO2peak activity. The supervised exercise was divided into 3 to 5 sessions per week.
University of Jyvaskyla Study
The University of Jyvaskyla (Karavirta et al. MSSE 2011) study randomized 175 previously untrained volunteers to a nonexercise control group (N=35) or a 21-week supervised period of either strength training (S) twice a week (n=), endurance training (E) twice a week (n=), or their combination (ES, n=) four times per week. Endurance training included 30 to 90 minutes of indoor cycling per session of moderate to vigorous intensity. Since our analysis focuses on aerobic exercise, we only include in our exercise group the 105 subjects who were in the E or ES groups.
Studies of a Targeted Risk Reduction Intervention through Defined Exercise (STRRIDE)
STRRIDE includes two studies. STRRIDE 1 was composed of 40 to 65 year-old, sedentary dyslipidemic men and women with BMI 25–35 kg/m2. Subjects were randomized to either a non-exercise control group (N=28) or one of three aerobic exercise groups (N=166) which exercised for 8 months. STRRIDE 1 also included N=33 crossover subjects who had a non-exercise control period followed by an aerobic exercise period. In our analysis, we used only the crossover subjects in our control group and used only their control period data. Thus STRRIDE 1 contributed (N=28+33) 61 subjects to our control group and N=166 subjects to our exercise group. STRRIDE 2 enrolled subjects that were similar to those in STRRIDE 1. However, all STRRIDE 2 subjects had a non-exercise control period followed by an exercise period of aerobic and/or resistance training. We included in our control group the control period data of the N=65 STRRIDE 2 subjects who underwent resistance, but no aerobic training. We included in our exercise group the exercise period data of the N=130 STRRIDE 2 who underwent aerobic training with or without resistance training.
Adverse change threshold
FI, TG, SBP, and HDL-C measurements were measured at baseline and at the end of the study. For each of the respective 4 cardiovascular risk biomarkers, we analyzed all subjects who had baseline and end-of-study data by their randomized group, that is, by intention-to-treat. We used the same AC thresholds that were defined by Bouchard et al. for FI, TG, SBP, and HDL-C. Those AC thresholds are baseline to end-of-study increases of ≥ 24 pmol/L for FI, ≥ 0.42 mmol/L for TG, ≥ 10 mm Hg for SBP, and a decrease of ≥ 0.12 mmol/L for HDL-C. The purpose of the AC thresholds was to account for within-subject measurement variability for each of the four variables. Such measurement variability arises from day-to-day biological variation, technical variation associated with laboratory testing, and physiological change unrelated to exercise (e.g., stress, illness, or changes in diet). Bouchard et al. obtained these thresholds by measuring each variable three times (except twice for FI) in sixty HERITAGE subjects before exercise training over a period of 3 weeks. The AC threshold corresponded to twice the within-subject standard deviation. Other HERITAGE data and observations from the literature were used to obtain the within-subject standard deviation.
Our four primary comparisons tested whether the AC rates for FI, TG, HDL-C, and SBP differed between the control and exercise subjects. These analyses were performed stratifying for each of the four studies. A permutation version of the Mantel-Haenszel statistic was used to account for small sample sizes for some of the strata. We also tested whether the control and exercise groups differed in the number of adverse responses per subject, using a permutation of the Wilcoxon rank sum test stratified by study. We also examined whether the baseline characteristics age, gender, race/ethnicity, BMI, and peak VO2 (mL/kg/min) affected the probability that an AC differed between the control and exercise groups. These analyses were performed using logistic regression where the log odds of an AC was modeled as a linear function of the randomization assignment, study, baseline characteristic, and randomization assignment-by-baseline characteristic interaction. Significance was determined using the Wald statistic for the randomization assignment-by-baseline characteristic interaction.
To examine the robustness of our results with respect to the choice of the AC threshold, we also compared the control and exercise groups using the control group’s 5th percentile for baseline-to-follow-up change as the AC threshold. Those AC thresholds corresponded to baseline-to-follow-up increases of ≥ 21 mm Hg for SBP, ≥ 0.95 mmol/L for TG, and ≥ 39 pmol/L for FI and a baseline-to-follow-up decrease of ≥ 0.36 mmol/L for HDL-C. Since the control group was used for setting the AC threshold, the p-value computation is based on the negative hypergeometric distribution (Gumbel EJ, von Schelling H., 1950; Randles and Wolfe, 1979; Proschan and Nason, 2009).
Finally we tested whether the mean changes for each of the four CV variables differed between the control and exercise groups, using an analysis of covariance with study as an adjustment factor. We used Levene’s test adjusted for study to assess whether the standard deviation of the changes for each of the 4 CV variables differed between the control and exercise groups.
We tested each of the four primary comparisons at the Bonferroni corrected 0.0125 = 0.05/4 two-sided significance level. Since the remaining analyses were exploratory, we used a 0.05 two-sided nominal significance level. Analyses were performed using R version 3.1.1 including the “rms” and “coin” packages (R Core Team (2014). R: A language and environment for statistical computing. R Foundation for Statistical Computing and SAS software version 9.3 (SAS Institute Inc, Cary, North Carolina).
RESULTS
Table 1 gives the baseline characteristics for our each study in our analysis as well as the total sample overall. Table 2 reports the respective AC thresholds for each of the four variables as well as the proportions of subjects in the control and exercise groups meeting those thresholds. Whereas there was no significant difference between control and exercise groups at the Bonferroni 0.0125 level, it is noteworthy that the control AC rate was larger than the exercise AC rate for all four variables. This is reflected in Table 3, which reports the number of ACs per subject among the 651 (55%) subjects who had baseline and follow-up data for all four CV variables. Among those subjects captured in Table 3, there were significantly more ACs per subject among controls than exercise subjects (p=0.02). Tables 4 through 7 report the control versus exercise by baseline characteristic interaction p-values for adverse changes. None of those p-values were significant. For age and BMI, the median (10th percentile, 90th percentile) were virtually the same for all four exercise versus control and AC versus non-AC subgroups. For baseline peak VO2, the exercise group had a non-significantly lower median than the control group (19.3 vs. 20.6 mL/kg/min, Wilcoxon p=0.23) that was reflected in both the AC and non-AC subjects. For each categorical characteristic (gender and race/ethnicity) subgroup, the exercise group AC rate was not significantly higher than in controls.
Table 1.
Baseline characteristics
| Overall n=1188 |
DREW n=464 |
INFLAME n=162 |
Jyvaskyla n=140 |
STRRIDE n=422 |
|
|---|---|---|---|---|---|
| Female (%) | 73 | 100 | 73 | 49 | 48 |
| Agea | 54 (41–64) | 56 (50–66) | 50 (35–64) | 52 (43–64) | 51 (39–62) |
| Ethnicity/race (%) Caucasian African American Hispanic or other |
74 21 5 |
64 29 7 |
65 23 12 |
100 0 0 |
80 18 2 |
| BMI (kg/m2) | 30 (25–36) | 32 (27–37) | 32 (27–37) | 25 (21–29) | 30 (26–34) |
| Peak VO2 (mL·kg−1·min−1) | 19.6 (12.9–33.5) |
15.1 (11.5–19.2) |
17.7 (12.5–27.3) |
30.1 (21.9–37.7) |
27.2 (20.2–36.0) |
| Triglycerides (mmol/L) | 1.32 (0.70–2.41) |
1.37 (0.70–2.41) |
1.25 (0.63–2.01) |
1.00 (0.56–1.87) |
1.45 (0.84–2.66) |
| Insulin (pmol/L) | 58 (26–125) | 63 (31–127) | 77 (42–158) | 28 (15–49) | 53 (26–112) |
| HDL-C (mmol/L) | 1.29 (0.91–1.86) |
1.42 (1.07–1.97) |
1.35 (1.01–1.91) |
1.27 (0.85–1.84) |
1.11 (0.83–1.68) |
| SBP (mm Hg) | 133 (112–153) |
140 (123–156) |
131 (107–156) |
131 (113–149) |
118 (104–136) |
Continuous variables are reported as: median (10th percentile, 90th percentile)
Table 2.
Adverse change thresholds for the baseline-to-follow-up differences for the four metabolic variables.
| AC threshold | Controls meeting AC threshold | Exercisers meeting AC threshold | p-valuea | |
|---|---|---|---|---|
| Insulin | ≥ 24 pmol/L | 44/289 (15.2%) | 65/676 (9.6%) | 0.02 |
| Trigylcerides | ≥ 0.42 mmol/L | 47/315 (14.9%) | 99/754 (13.1%) | 0.37 |
| HDL-C | ≥ − 0.12 mmol/L | 90/315 (28.6%) | 170/755 (22.5%) | 0.03 |
| SBP | ≥ 10 mm Hg | 41/243 (16.9%) | 89/562 (15.8%) | 0.52 |
Two-tailed permuted Cochran-Mantel-Haenszel test stratified on study
Table 3.
Number (and percent of total) of adverse changes per subjecta
| Number (%) of Adverse Changes | |||||
|---|---|---|---|---|---|
| 0 | 1 | 2 | 3 | 4 | |
| Control | 78 (39.6) | 90 (45.7) | 20 (10.2) | 9 (4.6) | 0 (0) |
| Exercise | 232 (51.1) | 158 (34.8) | 56 (12.3) | 7 (1.5) | 1 (0) |
Includes the 651 (55%) subjects who had baseline and follow-up data for all four cardiometabolic variables. Two-tailed p-value = 0.02 using permutation Wilcoxon rank sum test stratified by study.
Table 4.
Insulin adverse change (AC) rates. Interactions with baseline characteristics.
| Control | Exercise | Interaction p-value | |
|---|---|---|---|
|
| |||
| Agea: AC | 53 (35–64) | 53 (44–63) | 0.85 |
| Non-AC | 54 (41–66) | 54 (45–64) | |
|
| |||
| Gender: | 0.92 | ||
| AC female | 11.4% | 7.7% | |
| AC male | 16.0% | 7.8% | |
|
| |||
| Race/ethnicity: | 0.76 | ||
| AC Caucasian | 12.0% | 6.5% | |
| AC Afr-Amer | 15.0% | 12.6% | |
| AC Hispanic/other | 13.6% | 5.7% | |
|
| |||
| BMI: AC | 32 (26–37) | 32 (28–36) | 0.56 |
| Non-AC | 30 (25–38) | 30 (25–36) | |
|
| |||
| Peak VO2: AC | 17.9 (12.8–33.4) | 16.8 (12.7–33.5) | 0.95 |
| Non-AC | 21.0 (13.4–33.7) | 19.2 (12.9–34.0) | |
Continuous variables are reported as: median (10th percentile, 90th percentile)
Table 7.
SBP-C adverse change (AC) rates. Interactions with baseline characteristics
| Control | Exercise | Interaction p-value | |
|---|---|---|---|
|
| |||
| Agea: AC | 56 (40–66) | 54 (45–66) | 0.20 |
| Non-AC | 54 (38–64) | 55 (45–65) | |
|
| |||
| Gender: | |||
| AC female | 13.5% | 12.5% | 0.99 |
| AC male | 8.0% | 5.0% | |
|
| |||
| Race/ethnicity: | |||
| AC Caucasian | 10.8% | 10.1% | 0.83 |
| AC Afr-Amer | 13.7% | 12.6% | |
| AC Hisanic/other | 18.1% | 8.5% | |
|
| |||
| BMI: AC | 31 (26–36) | 31 (26–36) | 0.93 |
| Non-AC | 30 (25–36) | 30 (25–36) | |
|
| |||
| Peak VO2: AC | 16.6 (13.0–27.5) | 16.6 (12.6–31.4) | 0.40 |
| Non-AC | 19.3 (12.8–32.2) | 17.0 (12.6–31.5) | |
Continuous variables are reported as: median (10th percentile, 90th percentile)
Table 8 shows the AC rates according to the control group’s 5th percentile AC thresholds. The 5th percentile corresponds to approximately rather than exactly 5% of the control subjects due to ties in the baseline-to-follow-up changes in the control group and that the number of controls is not a multiple of 20 since 0.05 = 1/20. There were no significant differences between the exercise and control group AC rates for any of the CV variables.
Table 8.
Adverse change (AC) thresholds based on the control group’s approximate 5th percentile.
| AC thresholda | Controls meeting proposed AC threshold | Exercisers meeting proposed AC threshold | p-valueb | |
|---|---|---|---|---|
| Insulin | ≥ 39 pmol/L | 12/289 (4.2%) | 30/676 (4.4%) | 0.40 |
| Triglycerides | ≥ 0.95 mg/dL | 15/315 (4.8%) | 22/754 (2.9%) | 0.16 |
| HDL-C | ≥ 0.36 mmol/L | 13/315 (4.1%) | 25/755 (3.3%) | 0.56 |
| SBP | ≥ 21 mm Hg | 12/243 (4.9%) | 21/562 (3.7%) | 0.46 |
The AC thresholds correspond to the upper 5th percentile in the adverse direction of the control group’s observed changes. The 5th percentile corresponds to approximately and not exactly 5% of the control subjects due to there being ties in the baseline-to-follow-up changes in the control group and the fact that the number of control subjects is not a multiple of 20 since 0.05 = 1/20.
Negative hypergeometric distribution two-sided p-value that the exercise group AC rate is different from the control group AC rate.
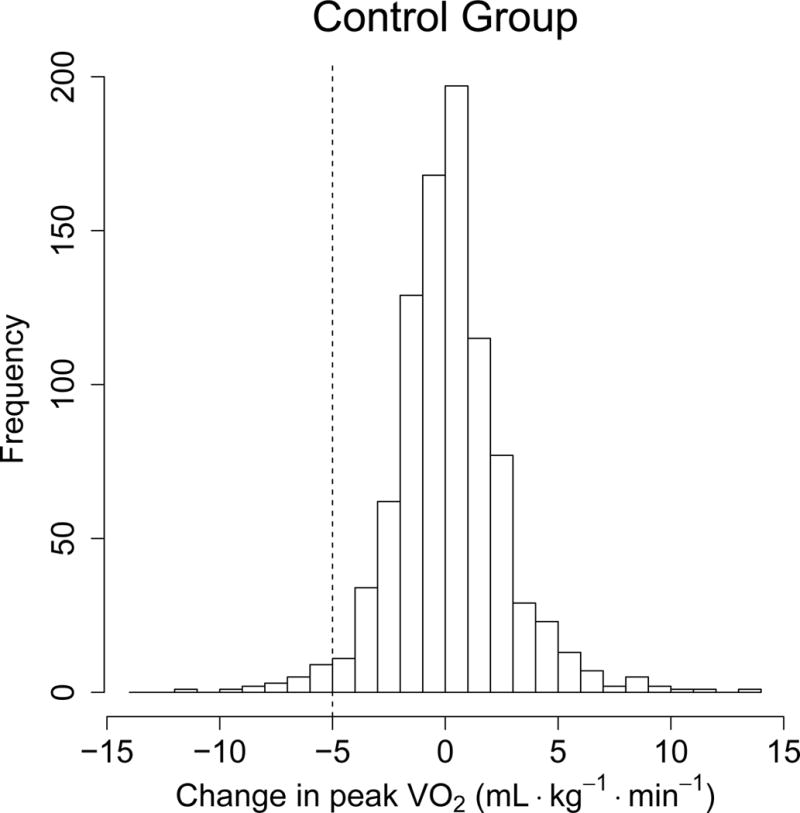
Finally, histograms of baseline-to-follow-up changes for each of the four variables are displayed in Figures 1 – 4 according to randomized group. As can be seen for each variable, the control and exercise groups’ histograms are quite similar. In particular, for each variable, the standard deviations are nearly the same for the control and exercise groups. This is important since if there were actual adverse changes in the exercise group, we would have expected to see a larger standard deviation in that group as well as a larger histogram tail in the adverse direction (Obrazanek et al. Hypertension 2003). Nevertheless, exercise group subjects had significantly more favorable mean changes than control subjects in fasting FI (−0.03 vs, −0.11 mmol/L, p=0.02), TG (−0.03 vs, −0.11 mmol/L (p=0.02), and HDL-C (−0.03 vs. 0.00 mmol/L, p=0.02) with no significant difference for SBP (−1.9 vs. −2.0 mm Hg, p=0.36). One should note that there is a significant variability in adverse and favorable responses for each variable.
Figure 1.
a and b: Histograms of the control group’s baseline-to-follow-up fasting insulin changes (mean = 1.8, SD = 28 pmol/L) and exercise group’s changes (mean = −6.5, SD = 29 pmol/L); p-value for mean difference < 0.0001; p-value for SD difference = 0.73.
Figure 4.

a and b: Histograms of the control group’s baseline-to-follow-up SBP changes (mean = −1.9, SD = 13.1 mm Hg) and exercise group’s changes (mean = −2.0, SD = 12.8 mm Hg); p-value for mean difference = 0.36; p-value for SD difference = 0.93.
DISCUSSION
Bouchard et al. defined AC thresholds for FI, TG, HDL-C, and SBP in subjects undergoing aerobic exercise training. The current analyses showed that for each of those four CV risk variables in the 1188 subjects comprising four aerobic exercise training studies, the observed AC rate for the exercise group was lower than that for the control group. Using a Bonferroni-corrected 0.0125 significance level, there was a trend towards significance for FI (p=0.02) and HDL-C (p=0.03). The lower AC rates in the exercise group were reflected in the 651 subjects who had complete baseline and follow-up data for all four cardiometabolic risk biomarkers. Among those subjects, there were more ACs per subject among controls than exercise subjects (p=0.02). Nevertheless, with respect to AC rates, there were no significant interactions between randomized group and the respective baseline characteristics of age, gender, race/ethnicity, BMI, and peak VO2 (mL/kg/min). Finally, the mean changes in FI, TG, and HDL-C reflected the expected benefit of exercise training. Thus, the current findings do not suggest that 4 to 6 months of aerobic exercise training is associated with a higher likelihood of adverse response in these variables than in non-exercising individuals.
It is important to note that different AC thresholds could have been used than the ones defined by Bouchard et al. The AC thresholds from that analysis were based on the within-subject standard deviation from an ancillary study of HERITAGE in conjunction with observations from the literature. We used the those AC thresholds to make our results directly comparable with theirs. A criticism of such an approach is that within-subject standard deviation from a single study might not be applicable to a cohort of subjects from other studies. This suggests using the control subjects in the current cohort to set the AC threshold since it is this control group that is the direct comparator to this cohort’s exercise group. The AC threshold could also be set at some percentile (e.g., 5th or 10th) of the control group’s baseline-to-follow-up changes. The choice of percentile is subjective and should correspond to a reasonable degree the natural biological and technical variation in the control group.
To examine the robustness our results, we used the control group’s 5th percentile for the AC threshold which corresponded to baseline-to-follow-up increases of ≥ 21 mm Hg for SBP, ≥ 0.95 mmol/L for TG, and ≥ 39 pmol/L for FI and a baseline-to-follow-up decrease of ≥ 0.36 mmol/L for HDL-C. At first glance, these thresholds may seem extreme and are substantially larger than the primary analysis thresholds in Table 1. Nevertheless, as these are the control group’s 5th percentiles, then by definition approximately 5% of control subjects exceeded each threshold. Thus in the control group, there was substantial natural biological variability over the 4- to 6-month follow-up period. By randomization, it is reasonable to assume such natural variability also existed in the exercise group. Using these more extreme AC thresholds, there were also no significant differences between the exercise and control group AC rates for any of the cardiometabolic variables.
Regardless of the choice of AC threshold, we obtained similarly shaped histograms of baseline-to-follow-up changes for the control and exercise groups. In particular, the standard deviations of the baseline-to-follow-up changes were very similar. This is important since if adverse changes were more prevalent in the exercise group in conjunction with less favorable mean changes in that group, we would have expected to see a larger histogram tail in the adverse direction of the exercise group as compared to controls as well as a larger standard deviation. We observed neither phenomenon. It should be noted that there is a marked individual variability of response to exercise therapy for any given risk factor, and there are a significant number of adverse responders for each cardiometabolic risk marker, although there are few individuals who respond unfavorably for the majority of markers.
Our study has the following limitations: First, our analysis is limited to generally healthy middle aged subjects studied over 4 to 6 months of aerobic training. Thus, these findings cannot necessarily be extrapolated to older individuals or those with overt CV disease or to other forms of exercise training. Next, our findings apply only to the four cardiometabolic variables measured. In addition, it is possible although unlikely that some of the control group subjects exercised regularly. This would have increased the similarity between the control and exercise groups, making it more difficult to detect a difference in the AC rates. Perhaps most importantly, the parallel arm study design makes it virtually impossible to identify specific individuals as having an adverse response to exercise. Indeed, a subject would need to participate in a multi-period crossover design to definitively determine whether he/she consistently responds adversely to exercise. Such a design would require several periods under the exercise and control conditions in random order (Senn BMJ 2004). Our parallel arm design only allows us to set a reasonable threshold that is suggestive of an adverse change and to compare the respective proportions of control and exercise subjects who met that threshold. Nevertheless, the exercise group was closely monitored for adherence to the intervention, and we did not observe an excess of exercise subjects than controls who met the AC thresholds.
In conclusion, the current data do not support the concept that aerobic exercise training confers increased risk for an adverse response to the common cardiometabolic variables studied compared to non-exercising individuals. Thus, current guidelines to participate in moderate intensity exercise programs are reasonable for the general population without significant concerns of adverse responses in these variables. However, monitoring of individuals’ responses remains important as for any given risk marker, including those for which exercise therapy might be recommended, there is a significant variability of response and the possibility of adverse change.
Supplementary Material
Figure 2.
a and b: Histograms of the control group’s baseline-to-follow-up fasting triglycerides changes (mean = −0.03, SD = 0.56 mmol/L) and exercise group’s changes (mean = −0.11, SD = 0.56 mmol/L); p-value for mean difference = 0.03; p-value for SD difference =0.72.
Figure 3.

a and b: Histograms of the control group’s baseline-to-follow-up fasting HDL-C changes (mean = −0.03, SD = 0.20 mmol/L) and exercise group’s changes (mean = 0.00, SD = 0.19 mmol/L); p-value for mean difference = 0.02; p-value for SD difference = 0.33.
Table 5.
Triglycerides adverse change (AC) rates. Interactions with baseline characteristics
| Control | Exercise | Interaction p-value | |
|---|---|---|---|
|
| |||
| Agea: AC | 55 (41–64) | 55 (45–63) | 0.71 |
| Non-AC | 53 (40–65) | 54 (44–64) | |
|
| |||
| Gender: | 0.16 | ||
| AC female | 11.4% | 12.0% | |
| AC male | 19.0% | 11.0% | |
|
| |||
| Race/ethnicity: | 0.30 | ||
| AC Caucasian | 14.8% | 12.0% | |
| AC Afr-Amer | 8.2% | 11.4% | |
| AC Hispanic/other | 18.2% | 8.6% | |
|
| |||
| BMI: AC | 30 (26–36) | 30 (26–36) | 0.89 |
| Non-AC | 30 (26–36) | 30 (25–36) | |
|
| |||
| Peak VO2: AC | 21.2 (13.4–31.8) | 17.2 (13.2–36.1) | 0.68 |
| Non-AC | 20.7 (13.0–34.2) | 19.5 (12.8–33.2) | |
Continuous variables are reported as: median (10th percentile, 90th percentile)
Table 6.
HDL-C adverse change (AC) rates. Interactions with baseline characteristics
| Control | Exercise | Interaction p-value | |
|---|---|---|---|
|
| |||
| Agea: AC | 54 (41–65) | 54 (45–64) | 0.12 |
| Non-AC | 53 (40–64) | 54 (44–64) | |
|
| |||
| Gender: | 0.68 | ||
| AC female | 28% | 22% | |
| AC male | 21% | 16% | |
|
| |||
| Race/ethnicity: | |||
| AC Caucasian | 28.0% | 19.4% | 0.12 |
| AC Afr-Amer | 20.5% | 23.4% | |
| AC Hisanic/other | 22.7% | 17.1% | |
|
| |||
| BMI: AC | 30 (25–36) | 30 (25–35) | 0.66 |
| Non-AC | 30 (26–36) | 30 (25–36) | |
|
| |||
| Peak VO2: AC | 21.2 (13.0–30.7) | 17.5 (13.7–32.7) | 0.70 |
| Non-AC | 21.0 (13.4–35.0) | 19.8 (12.8–33.7) | |
Continuous variables are reported as: median (10th percentile, 90th percentile)
References
- Bateman LA, Slentz CA, Willis LH, et al. Comparison of aerobic versus resistance exercise training effects on metabolic syndrome (from the Studies of a Targeted Risk Reduction Intervention Through Defined Exercise-STRRIDE-AT/RT) Am J Cardio. 2011;108:838–844. doi: 10.1016/j.amjcard.2011.04.037. [DOI] [PMC free article] [PubMed] [Google Scholar]
- Bland JM, Altman DG. Statistics notes: measurement error. BMJ. 1996;312:1654. doi: 10.1136/bmj.312.7047.1654. [DOI] [PMC free article] [PubMed] [Google Scholar]
- Bouchard C, Blair CN, Church TS, et al. Adverse response to regular exercise: is it a rare or common occurrence? PLoS ONE [Internet] 2012;7(5):e37887. doi: 10.1371/journal.pone.0037887. [cited 2012 May 30] Available from http://www.plosone.org/article/info%3Adoi%2F10.1371%2Fjournal.pone.0037887doi:10.1371/journal.pone.0037887. [DOI] [PMC free article] [PubMed] [Google Scholar]
- Bouchard D, Leon AS, Rao DC, et al. The HERITAGE family study. Aims, design, and measurement protocol. Med Sci Sports Exerc. 1995;27:721–729. [PubMed] [Google Scholar]
- Boule NG, Weisnagel SJ, Lakka TA, et al. Effects of exercise training on glucose homeostasis: The HERITAGE Family Study. Diabetes Care. 2005;28:108–114. doi: 10.2337/diacare.28.1.108. [DOI] [PubMed] [Google Scholar]
- Church TS, Earnest CP, Skinner JS, Blair SN. Effects of different doses of physical activity on cardiorespiratory fitness among sedentary, overweight, or obese postmenopausal women with elevated blood pressure: a randomized controlled trial. JAMA. 2007;297(19):2081–2091. doi: 10.1001/jama.297.19.2081. [DOI] [PubMed] [Google Scholar]
- Church TS, Earnest CP, Thompson EL, et al. Exercise without weight loss does not reduce C-reactive protein: the INFLAME study. Med Sci Sports Exerc. 2010;42(4):708–716. doi: 10.1249/MSS.0b013e3181c03a43. [DOI] [PMC free article] [PubMed] [Google Scholar]
- Daw EW, Province MA, Gagnon J, et al. Reproducibility of the HERITAGE family study intervention protocol: drift over time. Ann Epidemiol. 1997;7:452–462. doi: 10.1016/s1047-2797(97)00082-3. [DOI] [PubMed] [Google Scholar]
- Gumbel EJ, von Schelling H. The distribution of the number of exceedances. Annals of Mathematical Statistics. 1950;21:247–262. [Google Scholar]
- Karavirta L, Hakkinen K, Kauhanen A, et al. Individual responses to combined endurance and strength training in older adults. Med Sci Sports Exerc. 2011;43:484–490. doi: 10.1249/MSS.0b013e3181f1bf0d. [DOI] [PubMed] [Google Scholar]
- Kraus WE, Torgan CE, Duscha BD, et al. Studies of a targeted risk reduction intervention through defined exercise (STRRIDE) Med Sci Sprts Exerc. 2001;33:1774–1784. doi: 10.1097/00005768-200110000-00025. [DOI] [PubMed] [Google Scholar]
- Morss GM, Jordan AN, Skinner JS, et al. Dose Response to Exercise in Women aged 45–75 yr (DREW): design and rationale. Med Sci Sports Exerc. 2004;36:336–344. doi: 10.1249/01.MSS.0000113738.06267.E5. [DOI] [PubMed] [Google Scholar]
- Obarzanek E, Proschan MA, Vollmer WM, et al. Individual blood pressure responses to changes in salt intake: results from the DASH-sodium trial. Hypertension. 2003;42:459–467. doi: 10.1161/01.HYP.0000091267.39066.72. [DOI] [PubMed] [Google Scholar]
- Physical Activity Guidelines Advisory Committee Physical Activity Guidelines Advisory Committee report. Washington, DC: U.S. Department of Health and Human Services; 2008. [DOI] [PubMed] [Google Scholar]
- Proschan MA, Nason M. Conditioning in 2 × 2 tables. Biometrics. 2009;65:316–322. doi: 10.1111/j.1541-0420.2008.01053.x. [DOI] [PubMed] [Google Scholar]
- Randles RH, Wolfe DA. Introduction to the Theory of Nonparametric Statistics. Krieger Publishing Company; Florida: 1979. [Google Scholar]
- Senn S. Individual response to treatment: is it a valid assumption? BMJ. 2004;329:966–968. doi: 10.1136/bmj.329.7472.966. [DOI] [PMC free article] [PubMed] [Google Scholar]
- Thompson AM, Mikus CR, Rodarte RQ, Distefano B, Priest EL, et al. Inflammation and exercise (INFLAME): study rationale, design, and methods. Contemp Clin Trials. 2008;29:418–427. doi: 10.1016/j.cct.2007.09.009. [DOI] [PMC free article] [PubMed] [Google Scholar]
- Wilund KR, Colvin PL, Phares D, et al. The effect of endurance exercise training on plasma lipoprotein AI and liproprotein AI:AII concentrations in sedentary adults. Metabolism. 2002:1053–1060. doi: 10.1053/meta.2002.33356. [DOI] [PubMed] [Google Scholar]
- R Core Team. R: A language and environment for statistical computing. R Foundation for Statistical Computing; 2014. Vienna, Austria. URL http://www.R-project.org/ [Google Scholar]
Associated Data
This section collects any data citations, data availability statements, or supplementary materials included in this article.