

Abstract
Background: Plasma membrane organization is a mechanistic target of n–3 (ω-3) polyunsaturated fatty acids. Previous studies show that eicosapentaenoic acid (EPA; 20:5n–3) and docosahexaenoic acid (DHA; 22:6n–3) differentially disrupt plasma membrane molecular order to enhance the frequency and function of B lymphocytes. However, it is not known whether EPA and DHA affect the plasma membrane organization of B lymphomas differently to influence their function.
Objective: We tested whether EPA and DHA had different effects on membrane order in B lymphomas and liposomes and studied their effects on B-lymphoma growth.
Methods: B lymphomas were treated with 25 μmol EPA, DHA, or serum albumin control/L for 24 h. Membrane order was measured with fluorescence polarization, and cellular fatty acids (FAs) were analyzed with GC. Growth was quantified with a viability assay. 2H nuclear magnetic resonance (NMR) studies were conducted on deuterated phospholipid bilayers.
Results: Treating Raji, Ramos, and RPMI lymphomas for 24 h with 25 μmol EPA or DHA/L lowered plasma membrane order by 10–40% relative to the control. There were no differences between EPA and DHA on membrane order for the 3 cell lines. FA analyses revealed complex changes in response to EPA or DHA treatment and a large fraction of EPA was converted to docosapentaenoic acid (DPA; 22:5n–3). NMR studies, which were used to understand why EPA and DHA had similiar membrane effects, showed that phospholipids containing DPA, similar to DHA, were more ordered than those containing EPA. Finally, treating B lymphomas with 25 μmol EPA or DHA/L did not increase the frequency of B lymphomas compared with controls.
Conclusions: The results establish that 25 μmol EPA and DHA/L equally disrupt membrane order and do not promote B lymphoma growth. The data open a new area of investigation, which is how EPA’s conversion to DPA substantially moderates its influence on membrane properties.
Keywords: plasma membrane, n–3 PUFA, lipid chain order, FA composition, growth
Introduction
The long-chain n–3 PUFAs EPA (20:5n–3) and DHA (22:6n–3) are routinely consumed as dietary supplements (1). Furthermore, they have potential clinical applications for specific populations such as those suffering from rheumatoid arthritis, metabolic disorders, or cognitive defects (2–6). Establishing the mechanistic and cellular actions of EPA and DHA is critical for making the appropriate recommendations on n–3 PUFAs, particularly for treating select diseases. Moreover, discriminating differences between EPA and DHA is necessary because the 2 FAs are neither structurally nor functionally equivalent (7–9).
The plasma membrane is a central molecular target of n–3 PUFAs that controls many downstream events essential for cellular function (10–12). Molecular differences between EPA and DHA are not well delineated with regard to plasma membrane organization. On the one hand, biophysical experiments on model membranes have shown that EPA creates a slightly more disordered environment than DHA in heteroacid phospholipids (7, 13). Membrane order is a key parameter of membrane organization that regulates the formation of lipid microdomains and protein activity (14). On the other hand, DHA is more effective than EPA in diminishing the formation of signaling lipid microdomains (15–17). Thus, there is no clear consensus on how EPA and DHA differ in their ability to influence lateral organization and membrane order, which warrants further study in this area.
Recent studies have shown that EPA and DHA differentially target the molecular composition and physical organization of B-lymphocyte plasma membranes (16, 18). In turn, EPA and DHA to different extents enhance naïve B-lymphocyte activation and antibody production. These results raise the possibility that n–3 PUFAs or their derived mediators could be used to boost immune responses in conditions such as obesity and infection (19–21). However, a major gap in knowledge has emerged from the aforementioned studies. That is, if EPA and DHA target the molecular organization of B-lymphocyte plasma membranes, could they also target the molecular organization of B-lymphoma plasma membranes? Therefore, in this study, we focused on the effects of EPA and DHA on B-lymphoma plasma membrane molecular order.
Methods
Cell lines.
Raji, Ramos, and RPMI 8866 human B lymphomas were grown and treated with FAs in RPMI 1640 1× (Mediatech) supplemented with 5% heat-inactivated FBS (Hyclone), 2 mmol l-glutamine/L (Corning Cellgrow), and 1% penicillin/streptomycin (Corning Cellgrow). The lipid composition of the FBS was as previously described (22). Cells were incubated in a 5% CO2 incubator at 37°C and maintained at low passages.
FA treatment.
Lymphomas were treated with BSA as a control. EPA or DHA treatments relied on FA stocks that were complexed to FA-free BSA (Roche Biochemicals) at a ratio of 1.5:1 (22). The complexing of FAs was conducted under stringent conditions (i.e., low-light conditions and under a gentle stream of nitrogen gas) to prevent oxidation, as previously described (22). The experiments used a 25-μmol dose/L for 24 h, which allowed us to compare the results from this study to our previous studies on membrane organization (22, 23). Growth studies relied on EPA and DHA treatment for 24 and 48 h.
Fluorescence polarization measurements.
Steady-state fluorescence polarization experiments were conducted as previously described (24). Briefly, after 24 h of FA treatment, 1 × 10⁶ B lymphomas were washed twice with HBSS (Mediatech) and loaded with 1 μmol/L 1,6-diphenylhexatriene (DPH)7 for 5 min. Cells were then washed again with HBSS, and steady-state fluorescence anisotropy,  , was measured with the use of a Thermo Bowman II spectrometer equipped with an Aminco Bowman Auto Polarizer Series 2 instrument and with DPH excitation set to 355 nm and emission to 425 nm. Fluorescence anisotropy was determined according to
  and related to polarization values via
 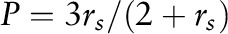 , where IVV and IVH are the intensities measured for the fluorescent signal emitted, respectively, parallel (vertical-vertical) and perpendicular (vertical-horizontal) to the direction of polarization for the incident beam, and G is an instrumentation correction factor defined as
  . Order parameters for DPH (SDPH) were determined from anisotropy values on the basis of a previously derived relation (25):
 |
FA analyses.
Lipids were extracted from cells and analyzed with a Shimadzu GC-2010 as previously reported (26). The major analyzed peaks were identified by their retention times relative to commercial standards (Nu-Check Prep and Restek). Areas of peaks were summed, and each peak area was expressed in arbitrary units as % total peak area for BSA-, EPA-, and DHA-treated cells (15). Changes in FA profiles were confirmed in a few select studies with the use of an internal C19:0 FA (Avanti Polar Lipids).
Growth assays.
B cells treated with 25 μmol EPA or DHA/L were plated at 250,000 cells/mL. The growth of B cells as a function of time was determined by counting live cells in duplicate or triplicate with a hemacytometer as previously described (23). Dead cells were accounted for with Trypan blue (HyClone; Fisher Scientific) staining. BSA treatment served as a control.
Phospholipids and preparation of multilamellar vesicles.
The perdeuterated lipids 1-[2H35]stearoyl-2-oleoylphosphatidylcholine, 1-[2H35]stearoyl-2-eicosapentaenoylphosphatidylcholine, 1-[2H35]stearoyl-2-docosapentaenoylphosphatidylcholine, and 1-[2H35]stearoyl-2-docosahexaenoylphosphatidylcholine were purchased as a stock item or custom synthesis from Avanti Polar Lipids. Lipids (25 mg) were dried down in chloroform under a gentle stream of argon gas (nitrogen gas for 1-[2H35]stearoyl-2-oleoylphosphatidylcholine) followed by vacuum pumping overnight to remove any residual organic solvent. Samples were then hydrated in degassed 50 wt% 50 mmol Tris buffer/L, mixed, and adjusted to a pH of 7.5. Samples were then lyophilized 3 times with deuterium-depleted water (Cambridge Isotope Laboratories) to remove trace amounts of heavy water. Samples were then rehydrated to 50 wt% deuterium-depleted water before 3 cycles of freezing and thawing (27). Samples were transferred to 5 mm NMR tubes and stored at −80°C. Precautions were taken throughout the procedure to minimize oxidation of the samples containing PUFAs, including limiting exposure to light (with aluminum foil and reduced lighting) and using a glove box purged with argon gas during manipulations (28).
Solid-state 2H NMR spectroscopy.
2H NMR spectra were acquired, and data were analyzed on a home-built spectrometer operating at 46.0 MHz with a 7.05-T superconducting magnet (Oxford Instruments) as previously described (7). Briefly, pulse programming was accomplished with an in-house assembled programmable pulse generator, while signals were obtained in quadrature with the use of a dual-channel digital oscilloscope (R1200 M; Rapid Systems). The experimental temperature was monitored to ±0.1°C. To eliminate spectral distortion caused by receiver recovery time, a phase-alternated quadrupolar echo sequence (90°x-τ-90°y-acquire-delay)n was implemented. The parameters were as follows: 90° pulse width, 3.6 μs; separation between pulses, τ = 50 μs; delay between pulse sequences, 1.5 s; sweep width, ±100 kHz; data set, 2 K; and number of transients, ∼15,000. First moments  , average order parameters
  , and acyl chain length were calculated from spectra with the use of standard equations (7, 29).
Statistical analyses.
Data were analyzed with GraphPad Prism 5.0c. Order parameters from DPH studies were plotted as a function of total concentrations of select FAs and were fit with the use of linear regression analysis. For membrane microviscosity studies, statistical analyses were conducted with a 1-factor ANOVA followed by a Bonferroni multiple comparisons t test. For FA analyses, statistical analyses were conducted with a 1-factor ANOVA followed by a Bonferroni posttest compared with the BSA control. For growth data, statistical analyses were conducted with a repeated measures 2-factor ANOVA (time and treatment as variables) followed by a Bonferroni posttest. The aforementioned parametric statistics were used based on our previous studies that showed that polarization and cell growth measurements have normal distributions (23, 30). P < 0.05 was considered statistically significant. A reproducibility of ±1–2% applies to the first moment and average order parameter that were obtained from spectra collected with multiple acquisitions in single 2H NMR experiments (7).
Results
EPA and DHA exert similar effects on DPH polarization in B lymphomas.
Treating Raji B cells with EPA and DHA lowered polarization values by 10–20% compared with the BSA control (Figure 1A). EPA and DHA treatment lowered DPH polarization values for Ramos cells by 15–20% relative to BSA treatment (Figure 1B). With the RPMI cells, EPA and DHA treatment lowered DPH polarization by 10–13% compared with BSA. For all 3 cell lines, there were no significant differences between EPA and DHA treatment (P ≥ 0.05).
FIGURE 1.
EPA and DHA exert similar effects on the plasma membrane order of B lymphomas. DPH polarization values for (A) Raji, (B) Ramos, and (C) RPMI B cells. Cells were treated for 24 h with 25 μmol FAs/L complexed to BSA. Data are means ± SEMs from 3 to 5 independent experiments for Raji and Ramos cells and 7 independent experiments for RPMI cells. Means without a common letter differ, P < 0.05. DPH, 1,6-diphenylhexatriene.
We also calculated DPH order parameters (SDPH) from the raw anisotropy data. The SDPH values (Table 1) represent a structural parameter that is determined by the order of the acyl chains surrounding the DPH molecule. EPA treatment of Raji B cells with EPA tended to lower SDPH values by ∼21% (P = 0.08), and DHA treatment robustly lowered SDPH values by ∼38% (P < 0.05). The opposite effect was observed with Ramos cells. EPA treatment lowered SDPH values by ∼30% (P < 0.05), and DHA treatment tended to lower SDPH values by ∼12% (P = 0.08). With RPMI B cells, EPA and DHA exerted very similar effects. Both FAs lowered SDPH values modestly by ∼9–11% (P < 0.05). The changes in SDPH qualitatively mirror those in polarization.
TABLE 1.
Order parameters for DPH (SDPH) in Raji, Ramos, and RPMI B cells upon treatment with BSA, EPA, and DHA1
| Cell line | BSA | EPA | DHA |
| Raji | 0.43 ± 0.02a | 0.34 ± 0.02a | 0.26 ± 0.04b |
| Ramos | 0.49 ± 0.02a | 0.35 ± 0.01b | 0.43 ± 0.03a |
| RPMI | 0.59 ± 0.02a | 0.54 ± 0.02b | 0.53 ± 0.02b |
B cells were treated with BSA (control) or 25 μmol EPA or DHA/L for 24 h. Values are means ± SEMs from 3 to 5 independent experiments for Raji and Ramos cells and 7 independent experiments for RPMI cells. Means in a row without a common superscript letter differ, P < 0.05. DPH, 1,6-diphenylhexatriene.
FA analyses of B lymphomas show an important conversion of EPA to docosapentaenoic acid.
FA analysis of Raji B cells (Table 2) showed that EPA treatment decreased the concentrations of 16:0, 18:0, cis 18:1, 18:2n–6, and 20:4n–6 and increased the concentrations of 20:5n–3 and its elongation product 22:5n–3. DHA treatment lowered the concentrations of 18:0, cis 18:1, 18:2n–6, 20:4n–6, and 22:5n–3 and increased 22:6n–3. With Ramos cells (Table 3), EPA treatment lowered 18:0, cis 18:1, 18:2n–6, and 20:4 concentrations and increased the relative proportion of 20:5n–3 and 22:5n–3. DHA treatment with the same cell line lowered the concentrations of 18:0, cis 18:1, 18:2n–6, and 20:4 and increased 22:6n–3. With RPMI cells (Table 4), EPA treatment lowered 18:0 and 20:4 concentrations and increased 20:5n–3 and 22:5n–3. The elongation of 20:5n–3 to 22:5n–3 was particularly marked in this case. DHA treatment reduced the concentrations of 18:0 and 20:4 and increased 22:6n–3.
TABLE 2.
FA analysis of Raji B cells1
| FAs | BSA | EPA | DHA |
| 14:0 | 0.6 ± 0.4 | 0.8 ± 0.1 | 1.1 ± 0.1 |
| 16:0 | 19.4 ± 1.5 | 14.4 ± 0.7* | 17.7 ± 0.4 |
| 16:1 | 3.3 ± 0.5 | 2.6 ± 0.1 | 2.5 ± 0.0 |
| 18:0 | 16.7 ± 1.0 | 13.0 ± 0.2** | 1.1 ± 0.1** |
| cis 18:1 | 38.1 ± 1.5 | 23.1 ± 1.5*** | 22.2 ± 1.0*** |
| 18:2(n–6) | 3.6 ± 0.2 | 2.3 ± 0.0*** | 2.2 ± 0.1*** |
| 20:4(n–6) | 9.3 ± 0.9 | 5.4 ± 0.1** | 5.3 ± 0.3** |
| 20:5(n–3) | 0.6 ± 0.0 | 25.1 ± 0.7*** | 1.1 ± 0.2 |
| 22:5(n–3) | 4.0 ± 0.4 | 12.3 ± 0.6*** | 2.0 ± 0.1* |
| 22:6(n–3) | 4.4 ± 0.4 | 2.2 ± 0.1 | 33.0 ± 1.1*** |
| ∑ SFAs | 36.7 ± 1.3 | 26.9 ± 1.0*** | 31.7 ± 0.3* |
| ∑ MUFAs | 41.4 ± 1.8 | 25.8 ± 1.5*** | 24.7 ± 1.0*** |
| ∑ (n–3) PUFAs | 8.9 ± 0.9 | 39.5 ± 0.8*** | 36.1 ± 1.0*** |
| ∑ (n–6) PUFAs | 12.9 ± 1.1 | 7.8 ± 0.1** | 7.5 ± 0.3** |
B cells were treated with BSA or 25 μmol EPA or DHA/L for 24 h. Data are means ± SEMs from 5 independent experiments. Values (arbitrary units) are percentage of total FAs. Asterisks indicate statistical significance relative to the BSA control: *P < 0.05, **P < 0.01, and ***P < 0.001.
TABLE 3.
FA analysis of Ramos B cells1
| FAs | BSA | EPA | DHA |
| 14:0 | 0.6 ± 0.6 | 0.3 ± 0.3 | 0.2 ± 0.3 |
| 16:0 | 17.6 ± 5.4 | 11.0 ± 3.6 | 13.2 ± 3.1 |
| 16:1 | 2.1 ± 1.0 | 1.3 ± 0.6 | 1.4 ± 0.5 |
| 18:0 | 18.1 ± 1.0 | 9.6 ± 0.6*** | 10.8 ± 0.6*** |
| cis 18:1 | 26.2 ± 1.2 | 13.8 ± 0.3*** | 16.3 ± 0.3*** |
| 18:2(n–6) | 3.5 ± 0.1 | 2.3 ± 0.1*** | 2.6 ± 0.1*** |
| 20:4(n–6) | 16.4 ± 2.0 | 7.3 ± 0.7** | 8.6 ± 0.4** |
| 20:5(n–3) | 0.9 ± 0.1 | 38.6 ± 3.5*** | 0.9 ± 0.1 |
| 22:5(n–3) | 6.8 ± 1.1 | 13.0 ± 1.1* | 3.2 ± 0.3 |
| 22:6(n–3) | 7.8 ± 2.1 | 2.7 ± 0.4 | 42.7 ± 2.5*** |
| ∑ SFAs | 40.3 ± 5.7 | 21.0 ± 3.9* | 26.8 ± 3.0 |
| ∑ MUFAs | 28.0 ± 0.2 | 15.1 ± 0.5* | 17.9 ± 0.3* |
| ∑ (n–3) PUFAs | 13.9 ± 3.7 | 54.3 ± 3.9*** | 44.4 ± 2.9** |
| ∑ (n–6) PUFAs | 17.8 ± 1.8 | 9.6 ± 0.7*** | 10.1 ± 0.4* |
B cells were treated with BSA or 25 μmol EPA or DHA/L for 24 h. Data are means ± SEMs from 5 independent experiments. Values (arbitrary units) are percentage of total FAs. Asterisks indicate statistical significance relative to the BSA control: *P < 0.05, **P < 0.01, ***P < 0.001.
TABLE 4.
FA analysis of RPMI B cells1
| FAs | BSA | EPA | DHA |
| 14:0 | 0.9 ± 0.6 | 0.5 ± 0.5 | 0.6 ± 0.3 |
| 16:0 | 23.2 ± 1.4 | 16.0 ± 2.8 | 20.3 ± 1.3 |
| 16:1 | 4.0 ± 0.5 | 2.4 ± 0.8 | 3.1 ± 0.2 |
| 18:0 | 19.4 ± 0.4 | 15.9 ± 0.4** | 17.1 ± 0.4* |
| cis 18:1 | 24.6 ± 3.4 | 17.5 ± 0.2 | 19.4 ± 0.2 |
| 18:2(n–6) | 1.8 ± 0.1 | 1.8 ± 0.1 | 1.8 ± 0.1 |
| 20:4(n–6) | 16.9 ± 3.9 | 7.2 ± 0.8* | 9.0 ± 0.3* |
| 20:5(n–3) | 0.4 ± 0.1 | 9.4 ± 0.3*** | 0.6 ± 0.1 |
| 22:5(n–3) | 4.7 ± 0.6 | 26.3 ± 2.3*** | 2.9 ± 0.1 |
| 22:6(n–3) | 4.0 ± 1.0 | 2.8 ± 0.4 | 25.0 ± 1.2*** |
| ∑ SFAs | 43.5 ± 1.7 | 32.4 ± 2.9* | 23.0 ± 1.2 |
| ∑ MUFAs | 28.8 ± 3.9 | 20.0 ± 0.6 | 22.6 ± 0.1 |
| ∑ (n–3) PUFAs | 9.0 ± 1.6 | 38.5 ± 2.7*** | 28.5 ± 1.1*** |
| ∑ (n–6) PUFAs | 18.7 ± 3.8 | 9.1 ± 0.8* | 10.8 ± 0.3 |
B cells were treated with BSA or 25 μmol EPA or DHA/L for 24 h. Data are means ± SEMs from 5 independent experiments. Values (arbitrary units) are percentage of total FAs. Asterisks indicate statistical significance relative to the BSA control: *P < 0.05, **P < 0.01, and ***P < 0.001.
We then analyzed correlations between polarization or SDPH values and select FAs. SDPH values for BSA-treated cells plotted as a function of the total concentrations of SFAs showed a linear relation (Supplemental Figure 1). We also analyzed the absolute change in SDPH relative to the BSA for several of the FAs listed in Tables 2–4. The only strong correlation to emerge was for EPA-treated cells, in which we observed a linear relation in which higher concentrations of EPA, corresponding to proportionately less elongation of EPA to DPA (docosapentaenoic acid; 22:5n–3) correlated with a larger reduction in SDPH (data not shown). Overall, it was difficult to tease apart differences between EPA and DHA given that there were numerous changes in other FAs upon EPA and DHA treatment, including changes in SFAs, MUFAs, and PUFAs, all of which can influence membrane order.
Phospholipids containing DPA are more ordered than DHA and EPA.
The complex changes in FAs in all 3 cell types led us to initiate studies in a more controlled model system. We used liposomes of defined composition to tease apart differences in molecular order between EPA, its elongation product DPA, and DHA with the use of solid-state NMR spectroscopy. Phosphatidylcholine phospholipids were selected based on previous data that showed a substantial uptake of EPA and DHA into the phosphatidylcholines of EL4 lymphomas (15). Figure 2A shows 2H NMR spectra for analogues of phosphatidylcholines containing perdeuterated stearic acid in the sn-1 position and either oleic acid (OA), EPA, DPA, or DHA in the sn-2 position. Monounsaturated OA was selected as an additional control for these studies. An analysis of the first moment (Table 5) calculated from the spectra in terms of average order parameters, defined as the mean for all the C-D bonds in the perdeuterated sn-1 chain (Figure 2B), showed that the OA-containing phospholipid bilayer has the highest order, followed by the DPA- and DHA-containing phospholipid bilayers. The EPA-containing phospholipid bilayer has the lowest first moment (Table 5) and average order parameter (Figure 2B), which demonstrates that it is the most disordered.
FIGURE 2.

Heteroacid phosphatidylcholines containing esterified DPA are more ordered than those containing EPA. (A) Sample 2H NMR spectra for phosphatidylcholines containing perdeuterated stearic acid in the sn-1 position and either OA, EPA, DPA, or DHA in the sn-2 position. (B) Average order parameters calculated from NMR spectra. Spectra were acquired at 25°C and 35°C and are representative of multiple acquisitions. A reproducibility of ±1–2% applies to the average order parameters that were obtained from spectra collected with multiple acquisitions in single 2H NMR experiments. DPA, docosapentaenoic acid; OA, oleic acid.
TABLE 5.
First-moment analysis of 2H NMR spectra of phosphatidylcholines containing varying degrees of unsaturation1
| FAs | M1 at 25°C, 103s−1 | M1 at 35°C, 103s−1 |
| OA | 46.6 ± 0.5 | 44.6 ± 0.5 |
| EPA | 40.0 ± 0.4 | 39.6 ± 0.4 |
| DPA | 42.4 ± 0.4 | 41.0 ± 0.4 |
| DHA | 41.8 ± 0.4 | 41.1 ± 0.4 |
Values are means ± SEMs. First moments calculated from NMR spectra of phosphatidylcholines with perdeuterated stearic acid in the sn-1 position and containing OA, EPA, DPA, or DHA in the sn-2 position. DPA, docosapentaenoic acid; M1, first moment; OA, oleic acid.
We then calculated the mean length of the sn-1 chain in the control OA- and n–3 PUFA-containing bilayers from the average order parameters obtained by analyzing the 2H NMR spectroscopy data. These values, which approximate the thickness of a monolayer, appraise the correspondence between disorder and thinning of the bilayer. At 25°C, the mean acyl chain length for the OA-containing phospholipid was the longest at 1.41 nm, and the EPA-containing phospholipid was shortest at 1.36 nm. Both the DPA- and DHA-containing phospholipids had a chain length of 1.38 nm. The error in these calculations was ±1–2%.
EPA and DHA do not promote the growth of B lymphomas.
We finally sought to determine whether EPA and DHA treatment had any influence on the growth of the 3 B cell lines that could confound the polarization measurements (Supplemental Figure 2). Two-factor ANOVA analysis revealed a significant effect of time (24 compared with 48 h for each treatment; P < 0.001), but there was no interaction effect (time and treatment as variables). An analysis of the number of cells after either 24 or 48 h of treatment with 25 μmol EPA and DHA/L, relative to the BSA control, showed no effect (P ≥ 0.05) on Raji (Supplemental Figure 2A), Ramos (Supplemental Figure 2B), or RPMI cells (Supplemental Figure 2C).
Discussion
A central mechanism of action by which EPA and DHA exert their effects on cellular activity is by remodeling the composition of the plasma membrane (11). This in turn influences events that are downstream of the membrane such as signaling cascades, bioavailability of FA substrates for enzymatic activity, and activation of transcription factors (31). Therefore, understanding the molecular organization of the plasma membrane in response to EPA and DHA has broad implications. Furthermore, discriminating differences between EPA and DHA is critical given that supplements range widely in the ratios of these 2 long-chain n–3 PUFAs, which influence physiological responses.
Phospholipids containing DPA are more ordered than EPA.
EPA and DHA have different molecular structures that control the physical properties of the plasma membrane (13). In a series of studies, we and others have established that EPA and DHA differentially disrupt the molecular organization of plasma membrane lipid rafts (15, 18). We have shown that treating EL4 cells with DHA but not EPA diminished lipid raft clustering induced by cholera toxin subunit b crosslinking (22). Subsequent work in a murine obesity model showed that EPA but not DHA ethyl esters promoted B cell microdomain packing after short-term dietary administration (18). Similarly, Gurzell et al. (16) demonstrated that a DHA-enriched fish oil diet was more robust than an EPA-enriched diet in diminishing B-cell cholera toxin-induced rafts. Differences between EPA and DHA have also been suggested to influence the formation of the immunological synapse and thereby CD4+ T activation (32).
The aforementioned studies led us to tackle a simple but essential question that to our knowledge has been poorly studied in the field. How do EPA and DHA differ in terms of their influence on plasma membrane ordering? We focused on membrane ordering given that order regulates numerous biophysical properties of the membrane, and changes in this parameter are likely linked to functional outcomes (33, 34). Our results showed no difference between EPA and DHA on membrane order in 3 B lymphomas at 25 μmol/L. Although we did not test for the effects of other FAs, our previous work has consistently shown no effect of other FAs, including in EL4 lymphomas (15, 22).
The FA analyses revealed complex differences that led to studies with NMR spectroscopy. Model membranes were used to study the physical effects of EPA/DPA/DHA that could not have been achieved in a cell culture model. These studies revealed that although EPA causes greater disordering than DHA, DPA does not. The reduction in average order parameter relative to the OA-containing phospholipid bilayer was 14% and 10% with EPA and DHA, respectively. A slightly smaller reduction in average order parameter was measured for the DPA- than the DHA-containing bilayer (9% compared with 10%), but the difference is less than experimental uncertainty. Mechanistically, EPA’s greater disorder was because of its shorter chain length compared with DPA and DHA.
The motion of DPH within a membrane is anisotropic so that the steady-state polarization reflects both viscosity (rate of motion) and order (degree of anisotropy of motion) that are combined in the term fluidity. Because the latter contribution dominates, a smaller polarization value implies a more disordered membrane (25). The relation between absolute order and DPH anisotropy values is not linear; therefore, our reported changes in DPH polarization do not reflect the exact amount of change in the molecular order of the B-lymphoma plasma membrane upon EPA or DHA treatment. To put our reported changes in the context of the literature, a 50% loss of cholesterol in erythrocytes (from 60 to 30 mmol/L) decreased anisotropy values by ∼12% (from 0.25 to 0.22) (35). Thus, the measured values suggest fairly large changes in order with EPA and DHA treatment.
The DPH probe does not detect whether EPA and DHA had an influence on the packing of rafts and nonrafts. We did conduct a select imaging study with the fluorescent probe di-4-ANEPPDHQ, which is more selective in probing for packing within ordered and disordered domains (15). We found that there was no major spectral blue shift in the emission of di-4-ANEPPDHQ upon EPA and DHA treatment, suggesting no specific change in the order of raft-like domains (data not shown). These results were highly similar to our previous data with EL4 lymphomas that showed that EPA and DHA do not have an effect on rafts in the absence of raft cross-linking (15).
The result that a DHA-containing phospholipid is more ordered than one containing EPA is consistent with previous work (7, 13). Presumably, an EPA-containing phospholipid is less ordered than DHA or DPA because of the shorter chain length of the PUFA. The implication is that the elongation of EPA to DPA will diminish the reduction in order seen in cells after treatment with EPA. Of course, we cannot attribute the elongation of EPA to DPA as the only reason why EPA and DHA had a similar effect on order. The FA analyses showed complex changes such as the loss of stearic and arachidonic acids, which will also influence membrane order (36). The unusually high concentrations of DPA in the cell lines were not caused by contamination of our EPA stocks. We also observed high concentrations of DPA upon EPA administration in EL4 lymphomas (15). This suggests potential high enzymatic activity in elongating EPA to DPA.
GC analysis was for the entire cell, so there may be changes that occur in the plasma membrane that are slightly different than the entire cell. We relied on whole-cell analyses for comparisons to our previous work and to account for any potential uptake of DPH into endomembranes (15, 24). Future studies will need to address EPA and DHA concentrations of isolated plasma membranes. Nevertheless, to the best of our knowledge, our data open a new area of investigation, which is the role of DPA in plasma membrane organization.
We focused on B-lymphoma growth as a functional endpoint based on our previous studies (23). With B lymphocytes in mouse models, EPA and DHA enhanced the steady-state frequency of B lymphocytes, raising concerns that EPA and DHA could enhance the growth of B lymphomas (19). Generally, n–3 PUFAs do not promote the growth of cancer cells, although there is some evidence questioning the utility of n–3 PUFAs in either preventing or suppressing tumor growth in vivo (37). Several studies have shown that EPA and DHA have potential clinical utility for suppressing cancer growth and progression (38–40). For instance, n–3 PUFAs promote the death of breast cancer cells in cell cultures and animals (41, 42). A recent study (43) demonstrated that dietary supplementation with EPA and DHA decreased breast tumor growth in obese mice, suggesting that these FAs may play a role in preventing some of the procancer effects of obesity. On the other hand, there is evidence that n–3 PUFAs, potentially in a complex interplay with other dietary factors, could have detrimental effects on select cancers (44, 45). For example, Mannini et al. (46) showed that n–3 PUFAs promoted metastases of S11 T-lymphomas transplanted into a murine model. Therefore, it was essential for the field to establish whether n–3 PUFAs would enhance B-lymphoma growth.
At the level of cell culture, our data show that EPA and DHA do not promote B-lymphoma growth and thereby are unlikely to be cancer-promoting agents in the context of B lymphomas. Future studies need to address a dose response with EPA and DHA on B-lymphoma growth because we simply used 25 μmol/L with the intent of comparing the mechanistic effects on B lymphomas to our previous work (15, 22).
There is very little information to our knowledge about how EPA and DHA affect B lymphomas. Verlengia et al. (47) showed that EPA and DHA at low concentrations enhanced Raji B cell proliferation. Our results are difficult to compare to this study because Verlengia et al. compared EPA with DHA and did not have a FA-free condition for their growth studies. In another study (48), DHA promoted toxicity with Raji B cells compared to more short-chain FAs. In preliminary studies, we have also observed that Raji B cell growth was suppressed with 50 μmol DHA treatment/L after 48 h of treatment (data not shown). Future studies need to address how DHA in vivo can mechanistically target B-lymphoma growth, which may be linked to changes in lipid rafts (41).
The lack of effect of EPA and DHA on Ramos and RMPI cells shows that even within B lymphomas there are differences in cellular metabolism. Moreover, the mechanisms by which n–3 PUFAs enhance the frequency of B lymphocytes, including transitional 1/2, follicular, and marginal zone cells, are clearly distinct from the mechanisms by which n–3 PUFAs target B lymphomas. This is consistent with the notion that cancer cell metabolism is widely different than the metabolism of primary lymphocytes (49).
In conclusion, our data demonstrate that the treatment with EPA and DHA has similar effects on membrane order in B lymphomas at 25 μmol/L. Order parameters measured from NMR spectra recorded with model membranes show that this is in part driven by the elongation of the highly disordered EPA to the relatively more ordered DPA. These data open the door to an area of new study, which is the role of DPA in regulating plasma membrane organization and function. Furthermore, the results show that neither FA promotes B lymphoma growth, providing evidence that n–3 PUFAs do not promote cancer cell growth, at least at 25 μmol/L.
Acknowledgments
We thank Joe Chalovich for assisting with the fluorescence polarization experiments and Lance Bridges for providing the human B lymphoma lines. MH designed the research, conducted all B-cell experiments, analyzed the data, and wrote the paper; JJK designed the research, conducted the NMR experiments, and analyzed the data; RK conducted the studies on B-cell membrane organization and wrote parts of the manuscript; XL designed the research and conducted the NMR experiments; SRW designed the research, analyzed the data, and wrote the paper; and SRS designed the research, analyzed the data, wrote the paper, and has primary responsibility for the final content. All authors have read and approved the final manuscript.
Footnotes
Abbreviations used: DPA, docosapentaenoic acid; DPH, 1,6-diphenylhexatriene; OA, oleic acid.
References
- 1.Turchini GM, Nichols PD, Barrow C, Sinclair AJ. Jumping on the omega-3 bandwagon: distinguishing the role of long-chain and short-chain omega-3 fatty acids. Crit Rev Food Sci Nutr 2012;52:795–803. [DOI] [PubMed] [Google Scholar]
- 2.Miles EA, Calder PC. Influence of marine n-3 polyunsaturated fatty acids on immune function and a systematic review of their effects on clinical outcomes in rheumatoid arthritis. Br J Nutr 2012;107 (Suppl 2):S171–84. [DOI] [PubMed] [Google Scholar]
- 3.Kalupahana NS, Claycombe KJ, Moustaid-Moussa N. (n-3) Fatty acids alleviate adipose tissue inflammation and insulin resistance: mechanistic insights. Adv Nutr 2011;2:304–16. [DOI] [PMC free article] [PubMed] [Google Scholar]
- 4.Bazinet RP, Laye S. Polyunsaturated fatty acids and their metabolites in brain function and disease. Nat Rev Neurosci 2014;15:771–85. [DOI] [PubMed] [Google Scholar]
- 5.Salem N Jr, Vandal M, Calon F. The benefit of docosahexaenoic acid for the adult brain in aging and dementia. Prostaglandins Leukot Essent Fatty Acids 2015;92:15–22. [DOI] [PubMed] [Google Scholar]
- 6.Afshordel S, Hagl S, Werner D, Röhner N, Kögel D, Bazan NG, Eckert GP. Omega-3 polyunsaturated fatty acids improve mitochondrial dysfunction in brain aging—impact of Bcl-2 and NPD-1 like metabolites. Prostaglandins Leukot Essent Fatty Acids 2015;92:23–31. [DOI] [PubMed] [Google Scholar]
- 7.Williams JA, Batten SE, Harris M, Rockett BD, Shaikh SR, Stillwell W, Wassall SR. Docosahexaenoic and eicosapentaenoic acids segregate differently between raft and nonraft domains. Biophys J 2012;103:228–37. [DOI] [PMC free article] [PubMed] [Google Scholar]
- 8.Shaikh SR, Kinnun JJ, Leng X, Williams JA, Wassall SR. How polyunsaturated fatty acids modify molecular organization in membranes: insight from NMR studies of model systems. Biochim Biophys Acta 2015;1848:211–9. [DOI] [PubMed] [Google Scholar]
- 9.Mozaffarian D, Wu JHY. (n-3) Fatty acids and cardiovascular health: are effects of EPA and DHA shared or complementary? J Nutr 2012;142:614S–25S. [DOI] [PMC free article] [PubMed] [Google Scholar]
- 10.Shaikh SR, Jolly CA, Chapkin RS. n-3 Polyunsaturated fatty acids exert immunomodulatory effects on lymphocytes by targeting plasma membrane molecular organization. Mol Aspects Med 2012;33:46–54. [DOI] [PMC free article] [PubMed] [Google Scholar]
- 11.Calder PC. Mechanisms of action of (n-3) fatty acids. J Nutr 2012;142:592S–9S. [DOI] [PubMed] [Google Scholar]
- 12.Kusumi A, Fujiwara TK, Chadda R, Xie M, Tsunoyama TA, Kalay Z, Kasai RS, Suzuki KGN. Dynamic organizing principles of the plasma membrane that regulate signal transduction: commemorating the fortieth anniversary of singer and nicolson’s fluid-mosaic model. Annu Rev Cell Dev Biol 2012;28:215–50. [DOI] [PubMed] [Google Scholar]
- 13.Holte LL, Peter SA, Sinnwell TM, Gawrisch K. 2H nuclear magnetic resonance order parameter profiles suggest a change of molecular shape for phosphatidylcholines containing a polyunsaturated acyl chain. Biophys J 1995;68:2396–403. [DOI] [PMC free article] [PubMed] [Google Scholar]
- 14.Stillwell W, Wassall SR. Docosahexaenoic acid: membrane properties of a unique fatty acid. Chem Phys Lipids 2003;126:1–27. [DOI] [PubMed] [Google Scholar]
- 15.Rockett BD, Teague H, Harris M, Melton M, Williams J, Wassall SR, Shaikh SR. Fish oil increases raft size and membrane order of B cells accompanied by differential effects on function. J Lipid Res 2012;53:674–85. [DOI] [PMC free article] [PubMed] [Google Scholar]
- 16.Gurzell EA, Teague H, Duriancik D, Clinthorne J, Harris M, Shaikh SR, Fenton JI. Marine fish oils are not equivalent with respect to B-cell membrane organization and activation. J Nutr Biochem 2015;26:369–77. [DOI] [PMC free article] [PubMed] [Google Scholar]
- 17.Gurzell EA, Teague H, Harris M, Clinthorne J, Shaikh SR, Fenton JI. DHA-enriched fish oil targets B cell lipid microdomains and enhances ex vivo and in vivo B cell function. J Leukoc Biol 2013;93:463–70. [DOI] [PMC free article] [PubMed] [Google Scholar]
- 18.Teague H, Harris M, Fenton J, Lallemand P, Shewchuk B, Shaikh SR. Eicosapentaenoic and docosahexaenoic acid ethyl esters differentially enhance B-cell activity in murine obesity. J Lipid Res 2014;55:1420–33. [DOI] [PMC free article] [PubMed] [Google Scholar]
- 19.Teague H, Fhaner CJ, Harris M, Duriancik DM, Reid GE, Shaikh SR. n-3 PUFAs enhance the frequency of murine B-cell subsets and restore the impairment of antibody production to a T-independent antigen in obesity. J Lipid Res 2013;54:3130–8. [DOI] [PMC free article] [PubMed] [Google Scholar]
- 20.Shaikh SR, Haas KM, Beck MA, Teague H. The effects of diet-induced obesity on B cell function. Clin Exp Immunol 2015;179:90–9. [DOI] [PMC free article] [PubMed] [Google Scholar]
- 21.López-Vicario C, Rius B, Alcaraz-Quiles J, García-Alonso V, Lopategi A, Titos E, Clària J. Pro-resolving mediators produced from EPA and DHA: overview of the pathways involved and their mechanisms in metabolic syndrome and related liver diseases. Eur J Pharmacol 2015. May 15 (Epub ahead of print; DOI:10.1016/j.ejphar.2015.03.02). [DOI] [PubMed] [Google Scholar]
- 22.Shaikh SR, Rockett BD, Salameh M, Carraway K. Docosahexaenoic acid modifies the clustering and size of lipid rafts and the lateral organization and surface expression of MHC class I of EL4 cells. J Nutr 2009;139:1632–9. [DOI] [PubMed] [Google Scholar]
- 23.Rockett BD, Franklin A, Harris M, Teague H, Rockett A, Shaikh SR. Membrane raft organization is more sensitive to disruption by (n-3) PUFA than nonraft organization in EL4 and B cells. J Nutr 2011;141:1041–8. [DOI] [PMC free article] [PubMed] [Google Scholar]
- 24.Shaikh SR, Edidin M. Immunosuppressive effects of polyunsaturated fatty acids on antigen presentation by human leukocyte antigen class I molecules. J Lipid Res 2007;48:127–38. [DOI] [PubMed] [Google Scholar]
- 25.Wassall SR, McCabe RC, Ehringer WD, Stillwell W. Effects of dietary fish oil on plasma high density lipoprotein. Electron spin resonance and fluorescence polarization studies of lipid ordering and dynamics. J Biol Chem 1992;267:8168–74. [PubMed] [Google Scholar]
- 26.Rockett BD, Salameh M, Carraway K, Morrison K, Shaikh SR. n-3 PUFA improves fatty acid composition, prevents palmitate-induced apoptosis, and differentially modifies B cell cytokine secretion in vitro and ex vivo. J Lipid Res 2010;51:1284–97. [DOI] [PMC free article] [PubMed] [Google Scholar]
- 27.Shaikh SR, Cherezov V, Caffrey M, Stillwell W, Wassall SR. Interaction of cholesterol with a docosahexaenoic acid-containing phosphatidylethanolamine: trigger for microdomain/raft formation? Biochemistry 2003;42:12028–37. [DOI] [PubMed] [Google Scholar]
- 28.Shaikh SR, Brzustowicz MR, Gustafson N, Stillwell W, Wassall SR. Monounsaturated PE does not phase-separate from the lipid raft molecules sphingomyelin and cholesterol: Role for polyunsaturation? Biochemistry 2002;41:10593–602. [DOI] [PubMed] [Google Scholar]
- 29.Petrache HI, Dodd SW, Brown MF. Area per lipid and acyl length distributions in fluid phosphatidylcholines determined by 2H NMR spectroscopy. Biophys J 2000;79:3172–92. [DOI] [PMC free article] [PubMed] [Google Scholar]
- 30.Shaikh SR, Mitchell D, Carroll E, Li M, Schneck J, Edidin M. Differential effects of a saturated and a monounsaturated fatty acid on MHC class I antigen presentation. Scand J Immunol 2008;68:30–42. [DOI] [PMC free article] [PubMed] [Google Scholar]
- 31.Calder PC. Marine omega-3 fatty acids and inflammatory processes: effects, mechanisms and clinical relevance. Biochim Biophys Acta 2015;1851:469–84. [DOI] [PubMed] [Google Scholar]
- 32.Kim W, Barhoumi R, McMurray DN, Chapkin RS. Dietary fish oil and DHA down-regulate antigen-activated CD4+ T-cells while promoting the formation of liquid-ordered mesodomains. Br J Nutr 2013;111:254–60. [DOI] [PMC free article] [PubMed] [Google Scholar]
- 33.Huber LA, Xu Q-B, Jürgens G, Böck G, Bühler E, Fred Gey K, Schönitzer D, Traill KN, Wick G. Correlation of lymphocyte lipid composition membrane microviscosity and mitogen response in the aged. Eur J Immunol 1991;21:2761–5. [DOI] [PubMed] [Google Scholar]
- 34.Miguel L, Owen DM, Lim C, Liebig C, Evans J, Magee AI, Jury EC. Primary human CD4+ T cells have diverse levels of membrane lipid order that correlate with their function. J Immunol 2011;186:3505–16. [DOI] [PubMed] [Google Scholar]
- 35.Stott BM, Vu MP, McLemore CO, Lund MS, Gibbons E, Brueseke TJ, Wilson-Ashworth HA, Bell JD. Use of fluorescence to determine the effects of cholesterol on lipid behavior in sphingomyelin liposomes and erythrocyte membranes. J Lipid Res 2008;49:1202–15. [DOI] [PMC free article] [PubMed] [Google Scholar]
- 36.Rajamoorthi K, Petrache HI, McIntosh TJ, Brown MF. Packing and viscoelasticity of polyunsaturated omega-3 and omega-6 lipid bilayers as seen by (2)H NMR and X-ray diffraction. J Am Chem Soc 2005;127:1576–88. [DOI] [PubMed] [Google Scholar]
- 37.Fenton JI, Hord NG, Ghosh S, Gurzell EA. Immunomodulation by dietary long chain omega-3 fatty acids and the potential for adverse health outcomes. Prostaglandins Leukot Essent Fatty Acids 2013;89:379–90. [DOI] [PMC free article] [PubMed] [Google Scholar]
- 38.Abel S, Riedel S, Gelderblom WCA. Dietary PUFA and cancer. Proc Nutr Soc 2014;73:361–7. [DOI] [PubMed] [Google Scholar]
- 39.Pettersen K, Monsen VT, Hakvåg Pettersen CH, Overland HB, Pettersen G, Samdal H, Tesfahun AN, Lundemo AG, Bjørkøy G, Schønberg SA. DHA-induced stress response in human colon cancer cells—focus on oxidative stress and autophagy. Free Radic Biol Med 2016;90:158–72. [DOI] [PubMed] [Google Scholar]
- 40.Wang X, Breeze A, Kulka M. N-3 polyunsaturated fatty acids inhibit IFN-gamma-induced IL-18 binding protein production by prostate cancer cells. Cancer Immunol Immunother 2015;64:249–58. [DOI] [PMC free article] [PubMed] [Google Scholar]
- 41.Schley PD, Brindley DN, Field CJ. (n-3) PUFA alter raft lipid composition and decrease epidermal growth factor receptor levels in lipid rafts of human breast cancer cells. J Nutr 2007;137:548–53. [DOI] [PubMed] [Google Scholar]
- 42.Altenburg JD, Siddiqui RA. Omega-3 polyunsaturated fatty acids down-modulate CXCR4 expression and function in MDA-MB-231 breast cancer cells. Mol Cancer Res 2009;7:1013–20. [DOI] [PubMed] [Google Scholar]
- 43.Ford NA, Rossi EL, Barnett K, Yang P, Bowers LW, Hideka B, Kimler BF, Carlson SE, Shureiqi I, deGraffenried LA, et al. . Omega-3-acid ethyl esters block the protumorigenic effects of obesity in mouse models of postmenopausal basal-like and claudin low breast cancer. Cancer Prev Res (Phila) 2015;8:796–806. [DOI] [PMC free article] [PubMed] [Google Scholar]
- 44.Kraja B, Muka T, Ruiter R, de Keyser C, Hofman A, Franco OH, Stricker BH, Kiefte-de Jong JC. Dietary fiber intake modifies the positive association between n–3 PUFA intake and colorectal cancer risk in a caucasian population. J Nutr 2015;145:1709–16. [DOI] [PubMed] [Google Scholar]
- 45.Woodworth HL, McCaskey SJ, Duriancik DM, Clinthorne JF, Langohr IM, Gardner EM, Fenton JI. Dietary fish oil alters T lymphocyte cell populations and exacerbates disease in a mouse model of inflammatory colitis. Cancer Res 2010;70:7960–9. [DOI] [PubMed] [Google Scholar]
- 46.Mannini A, Kerstin N, Calorini L, Mugnai G, Ruggieri S. Dietary n-3 polyunsaturated fatty acids enhance metastatic dissemination of murine T lymphoma cells. Br J Nutr 2009;102:958–61. [DOI] [PubMed] [Google Scholar]
- 47.Verlengia R, Gorjao R, Kanunfre CC, Bordin S, de Lima TM, Martins EF, Newsholme P, Curi R. Effects of EPA and DHA on proliferation, cytokine production, and gene expression in Raji cells. Lipids 2004;39:857–64. [DOI] [PubMed] [Google Scholar]
- 48.Anel A, Naval J, Desportes P, Gonzalez B, Uriel J, Pineiro A. Increased cytotoxicity of polyunsaturated fatty acids on human tumoral B and T-cell lines compared with normal lymphocytes. Leukemia 1992;6:680–8. [PubMed] [Google Scholar]
- 49.Zhao Y, Butler EB, Tan M. Targeting cellular metabolism to improve cancer therapeutics. Cell Death Dis 2013;4:e532. [DOI] [PMC free article] [PubMed] [Google Scholar]