

Hsiung et al. tracked Pol II occupancy genome-wide in mammalian cells progressing from mitosis through late G1. During the earliest rounds of transcription at the mitosis–G1 transition, ∼50% of active genes and distal enhancers exhibit a spike in transcription, exceeding levels observed later in G1 phase. The transcriptional spike occurs heterogeneously and propagates to cell-to-cell differences in mature mRNA expression.
Keywords: chromatin, epigenetics, mitosis, transcription
Abstract
During mitosis, RNA polymerase II (Pol II) and many transcription factors dissociate from chromatin, and transcription ceases globally. Transcription is known to restart in bulk by telophase, but whether de novo transcription at the mitosis–G1 transition is in any way distinct from later in interphase remains unknown. We tracked Pol II occupancy genome-wide in mammalian cells progressing from mitosis through late G1. Unexpectedly, during the earliest rounds of transcription at the mitosis–G1 transition, ∼50% of active genes and distal enhancers exhibit a spike in transcription, exceeding levels observed later in G1 phase. Enhancer–promoter chromatin contacts are depleted during mitosis and restored rapidly upon G1 entry but do not spike. Of the chromatin-associated features examined, histone H3 Lys27 acetylation levels at individual loci in mitosis best predict the mitosis–G1 transcriptional spike. Single-molecule RNA imaging supports that the mitosis–G1 transcriptional spike can constitute the maximum transcriptional activity per DNA copy throughout the cell division cycle. The transcriptional spike occurs heterogeneously and propagates to cell-to-cell differences in mature mRNA expression. Our results raise the possibility that passage through the mitosis–G1 transition might predispose cells to diverge in gene expression states.
Mitosis is accompanied by a dramatic interruption of nuclear processes. In metazoans, the nucleus is disassembled, and bulk RNA synthesis ceases (Prescott and Bender 1962). RNA polymerase II (Pol II) and other components of the eukaryotic transcriptional machinery dissociate from chromatin (Gottesfeld and Forbes 1997; Akoulitchev and Reinberg 1998; Prasanth et al. 2003) in part due to mitosis-specific post-translational modifications (Gottesfeld and Forbes 1997; Rizkallah et al. 2011). By late telophase, Pol II is known to re-enter the newborn nuclei in bulk and restore global RNA synthesis (Prasanth et al. 2003). However, we lack general principles of how individual genes reactivate transcription at the mitosis–G1 transition.
Many other interphase nuclear processes are also altered globally to varying extents during mitosis. Studies have described such alterations for the recruitment of transcriptional regulators (Raff et al. 1994; Martínez-Balbás et al. 1995; Dey et al. 2000; Christova and Oelgeschläger 2001; Kruhlak et al. 2001; Zaidi et al. 2003; Young et al. 2007; Yang et al. 2008, 2013; Blobel et al. 2009; Kadauke et al. 2012; Caravaca et al. 2013; Poleshko et al. 2013; Lake et al. 2014; Lodhi et al. 2014), deposition of histone variants and modifications (Kruhlak et al. 2001; Kelly et al. 2010; Varier et al. 2010; Wang and Higgins 2012), chromatin structure (Kuo et al. 1982; Michelotti et al. 1997; Kelly et al. 2010; Kadauke et al. 2012; Hsiung et al. 2014), long-range genome folding (Naumova et al. 2013; Dileep et al. 2015), lamina-associated genomic domains (Kind et al. 2013), and chromosome territories (Walter 2003). Details related to the kinetics, order, and fidelity with which such structures and processes are re-established during the mitosis–G1 transition are largely unknown, except a few examples for factor localization (Prasanth et al. 2003; Poleshko et al. 2013), lamina-associated domains (Kind et al. 2013), and long-range chromosome interactions (Dileep et al. 2015).
Given these uncertainties in the gene regulatory milieu at the mitosis–G1 transition, might there be altered transcriptional output during this cell cycle phase? A microarray-based study identified ∼200 mature mRNAs that fluctuate during early G1 in mammalian cells (Beyrouthy et al. 2008), but it is unknown to what extent changes in transcriptional activity versus post-transcriptional modulation are responsible for these fluctuations. Several studies have directly quantified transcriptional activity over time in cells transitioning from mitosis to interphase (Blobel et al. 2009; Dey et al. 2009; Muramoto et al. 2010; Zhao et al. 2011; Fukuoka et al. 2012; Kadauke et al. 2012; Caravaca et al. 2013) using RT-qPCR of primary transcripts of candidate genes (Blobel et al. 2009; Dey et al. 2009; Fukuoka et al. 2012; Kadauke et al. 2012; Caravaca et al. 2013), live-cell imaging of transcription of act-5 in Dictyostelium (Muramoto et al. 2010) and a multicopy reporter locus in a human cell line (Zhao et al. 2011), and microarray-based measurements of nascent transcripts (Fukuoka et al. 2012). Several of these studies suggest or assume that transcriptional output early after mitosis starts off low and rises monotonically with G1 progression at varying kinetics (Blobel et al. 2009; Zhao et al. 2011; Fukuoka et al. 2012; Kadauke et al. 2012; Caravaca et al. 2013). However, some genes show nonmonotonic changes in transcriptional output with cell cycle progression after mitosis, but no explanations for these observations have been proposed (Dey et al. 2009; Muramoto et al. 2010; Fukuoka et al. 2012; Caravaca et al. 2013). It remains unclear which transcriptional pattern represents the general rule, as these previous approaches lacked genome-wide extraction of the most prominent patterns. Moreover, some of these studies are difficult to compare due to incongruencies in their temporal coverage of transcriptional measurements and did not define a clear time frame for the occurrence of the first transcriptional cycle at the mitosis–G1 transition. Major questions remain unresolved. Genome-wide, when does de novo transcription upon reversal of mitotic silencing occur? Does the transcriptional program immediately after mitosis deviate significantly from later in interphase, and how might the mitosis–G1 transition influence the fidelity of transcriptional control?
To address these questions, we quantified transcriptional activity from mitosis through G1 phase using three independent methods: chromatin immunoprecipitation (ChIP) combined with high-throughput sequencing (ChIP-seq) of Pol II, RT-qPCR of primary transcripts, and simultaneous imaging of nascent and mature mRNA in single cells by single-molecule RNA fluorescence in situ hybridization (FISH). The temporal and genomic resolution of our strategy enabled visualization of the pioneering round of transcription at many genes upon reversal of mitotic silencing. We found that, during the earliest rounds of transcription, most active genes and intergenic enhancers are transcribed at a higher level than later in G1. This observation counters the prevailing assumption of generally lower initial transcriptional outputs immediately after reversal of mitotic silencing. Notably, the mitosis–G1 transcriptional spike does not scale with the frequency of enhancer–promoter chromatin contacts but is correlated with and preceded by higher levels of histone H3 Lys27 acetylation (H3K27ac) in mitosis. Single-molecule RNA FISH demonstrates that the early G1 transcriptional spike can constitute the maximum transcriptional activity in the entire cell cycle and propagate to cell-to-cell heterogeneity in mature mRNA levels. We discuss potential contributions of the mitosis–G1 spike in transcriptional compensation for changes in DNA copy number in the cell division cycle and as a source of gene expression heterogeneity.
Results
Pol II ChIP-seq on synchronized and purified cell populations reveals the pioneering round of gene transcription at the mitosis–G1 transition
We performed Pol II ChIP-seq during mitotic exit in murine erythroblast cells (G1E) that lack the hematopoietic transcription factor GATA1 (Weiss et al. 1997). We used a well-characterized subline (G1E GATA1-ER) that expresses a GATA1-estrogen receptor (ER) fusion protein, enabling study of transcriptional control in the context of estradiol-inducible gene activation and repression (Weiss et al. 1997). Tracking Pol II occupancy by ChIP-seq during brief cell cycle phases requires isolating a large number of cells specifically from the desired stages (Fig. 1A). To accomplish this, we arrested G1E GATA1-ER cells (induced with estradiol for 13 h) in prometaphase by nocodazole treatment followed by release into nocodazole-free medium for 40–360 min. To minimize contamination with cells from undesired stages of the cell cycle, we purified cells from specific cell cycle phases at specified time points using a fluorescence-activated cell sorting (FACS) strategy (Fig. 1A). This approach is based on a reporter (Kadauke et al. 2012) that consists of YFP fused to a mitotic degradation domain (MD), which confers degradation at the metaphase–anaphase transition (live-cell fluorescence microscopy in Supplemental Movie 1; Glotzer et al. 1991; Holloway et al. 1993). The combination of synchronization coupled with FACS based on YFP-MD and DNA content enabled isolation of populations highly enriched for cells in prometaphase, between anaphase and cytokinesis, in early G1, and in late G1 (Fig. 1A). One critical benefit of this strategy is that the G1 samples (sorted for 2N DNA content) are devoid of residual mitotic cells (4N) that might be delayed in their release from nocodazole arrest. Such contamination with transcriptionally silent mitotic cells would lead to an underestimate of the early G1 transcriptional activity in an ensemble assay.
Figure 1.

Pioneering round of gene transcription at the mitosis–G1 transition revealed by Pol II ChIP-seq. (A) Schematic of an experimental strategy that combines nocodazole arrest–release with FACS on the cell cycle reporter YFP-MD (degraded at the metaphase–anaphase transition) and DAPI signals to obtain relatively pure populations from desired cell cycle stages spanning prometaphase through late G1. Purple boxes demarcate the subpopulations sorted. This strategy ensures that the sorted early G1 sample is devoid of contaminating mitotic cells that are delayed in their release from nocodazole arrest, which could cause an underestimate of transcriptional activity when measured in bulk. (B) Sorted cell populations from A were used for ChIP-seq of total Pol II in biological triplicates, and reads were pooled across replicates. Shown are genome browser track views at illustrative loci to highlight the 5′–3′ progression of the pioneering round of transcription. The Y-axes for browser tracks are normalized by library size to enable comparison across time points for each locus, but the Y-axes across loci are not meant to be compared in this view. Below the browser tracks, we quantify mean Pol II binding across three biological replicates over the time course for the 2.5-kb regions at the 5′ and 3′ ends of each gene, with error bars indicating SEM. Quantification is also shown for the internal promoter of Runx1. All quantifications of Pol II binding in this study are based on library size-normalized read densities (reads per kilobases per million total reads [RPKM]).
We used these synchronized and sorted populations for ChIP-seq of total Pol II in three biological replicates. Examination of individual loci showed that the Pol II ChIP signal is eliminated in prometaphase (Fig. 1B), with minimal residual signal attributable to contamination of this particular sample by ∼10% G2-phase cells (Supplemental Fig. S1), which are also 4N and high YFP-MD. This contamination of the 0-h sample does not affect the subsequent time points in our FACS purification strategy (Fig. 1A). Our approach enabled the capture of the pioneering round of transcription, which is apparent as a synchronous wave of 5′-to-3′ Pol II progression that initiates between anaphase and cytokinesis (4N and low YFP-MD) at 40 min after release (Fig. 1B). This leading edge of Pol II ChIP signal represents a population-averaged position of the first polymerases to travel down a given gene over time, reaching the 3′ end of genes at time points consistent with gene lengths, as shown for illustrative loci in Figure 1B. The partial progression of the Pol II leading edge can be seen for genes >50 kb at individual loci (Fig. 1B) and as a Pol II-binding profile averaged across all such genes (Supplemental Fig. S2). Shorter genes appear to have already completed the first transcriptional cycle or the first several cycles sometime between the 40- and 60-min time points. Thus, the onset of transcriptional reactivation occurs within a narrow window between anaphase and cytokinesis (40–60 min after release from nocodazole arrest).
In addition to the progression of Pol II along the gene body, the amount of Pol II initiating transcription changes in gene-specific patterns over time. For example, at Chchd3, Zeb2, and Runx1, Pol II occupancy reaches maximum at the 60- to 90-min time points at the 5′ region of these genes followed by a decline through the remainder of G1 phase (Fig. 1B). We refer specifically to this pattern of a sharp increase followed by sustained decrease as a “spike.” Importantly, at genes with this particular pattern, the increase in Pol II binding at the 5′ region propagates through the full gene length, visible as a spike in occupancy at the 3′ region with a time delay consistent with gene length. The downward-sloping part of the spike indicates that this spike in activity is diminished shortly after the completion of the initial transcriptional cycles. Because the spike in Pol II binding at the 3′ end follows that at the 5′ end in time (exemplified by Chchd3, Zeb2, and Runx1 in Fig. 1B), these Pol II-binding patterns reflect a spike in full-length gene transcription rather than just an increase of paused Pol II at the 5′ end. Not all genes display a transcriptional spike; for example, at Asb1, Pol II binding plateaus after ∼90 min of release (Fig. 1B), whereas, at Mavs, Pol II binding rises continuously over a period of 360 min following release (Fig. 1B).
A spike in gene transcription at the mitosis–G1 transition is prevalent across the genome
To examine global distributions of Pol II occupancy over these time points, we measured Pol II occupancy at the 5′ regions of the 4309 nonoverlapping genes with above-background binding in at least one time point, as determined by a peak caller (Zhang et al. 2008). Globally, Pol II binding reaches substantial levels above background even prior to the completion of the first round of transcription for many genes at 60 min after release (Fig. 2A). In terms of the rise in absolute Pol II binding prior to the 60-min time point, the onset of transcription occurs globally with minimal gene-to-gene differences in kinetics within the limits of our temporal resolution. Pol II binding at the 60- and 90-min time points overall overshoots that of the 360-min time point (Fig. 2A; individual replicates shown in Supplemental Fig. S5). By 240 min, the distribution returns to roughly the same as 360 min (Fig. 2A). Thus, contrary to prior expectations of transcriptional reactivation post-mitosis starting off with generally lower initial output, transient transcriptional hyperactivity is a widespread phenomenon associated with the earliest rounds of transcription upon reversal of mitotic silencing.
Figure 2.

A spike in gene transcription is prevalent across the genome at the mitosis–G1 transition. (A) Replicate-averaged Pol II binding at the 5′ 2.5-kb region of 4309 genes active in at least one time point is plotted for each time point against the 360-min time point. Runx1 and Mavs, two genes with distinct temporal patterns shown in Figure 1B, are highlighted. Plots for individual replicates are shown in Supplemental Figure S5B. (B) For the same 4309 genes as in A, we performed principal component analysis on Pol II binding (RPKM), normalized by total Pol II binding for each gene over all time points, at the 5′ 2.5-kb region of each gene. For this analysis, only G1 time points (60, 90, 180, 240, and 360 min) were used. The temporal “shapes” of Pol II binding (eigenvector) of the first principal component is shown. Genes were ranked by their degree of match to (projection onto) the first principal component, and all of their gene-normalized RPKMs at the 5′ 2.5-kb regions were plotted in a heat map for all time points. Threshold for “early spike” is defined as the inflection of projection onto the first principal component from positive to negative. The threshold for separating “late plateau” and “late up-regulated” were chosen manually based on the appearance of the heat map. Four-hundred-thirty-four early spike genes and 432 late up-regulation genes meet the significance threshold (P < 0.05, determined by bootstrapping) for their projections onto the first principal component (Supplemental Fig. S5A). The positions of several genes in the heat map are shown at the right, together with their RPKMs for both the 5′ 2.5-kb and 3′ 2.5-kb regions. (C) Pol II ChIP-seq binding profiles (error bars denote SEM; n = 3) are shown together with quantification of primary transcripts by RT-qPCR using primers flanking the intron–exon junction (error bars denote SEM; n = 5–6). Pol II ChIP profiles from Runx1 and Mavs from Figure 1B are reproduced here for ease of comparison. In addition to these genes, profiles for Gata2, Kit, Hbb-b1, and Hba-a1 are shown in A for Pol II ChIP and in Figure 3D for primary transcript RT-qPCR.
In general, comparisons of factor occupancy across ChIP-seq samples in the context of global changes in binding require that changes in normalized read counts accurately reflect absolute changes in binding. This important property holds true in our data due to the presence of a relatively large proportion of reads mapping to intergenic regions that represent nonspecific background (Supplemental Fig. S3). This background serves as an internal calibration across sequencing libraries, enabling inferences of changes in Pol II occupancy on an absolute scale (Supplemental Fig. S3). We also confirmed patterns observed by Pol II ChIP-seq at individual loci by Pol II ChIP-qPCR (Supplemental Fig. S4), further indicating that sequencing read counts reflect quantitation by qPCR.
While transcriptional hyperactivity upon reversal of mitotic silencing is a prevalent trend, individual genes can exhibit a variety of distinct temporal profiles of transcription, indicating a degree of gene specificity for such patterns (Fig. 1B). To stratify Pol II-binding patterns at individual genes in an unbiased manner, we performed principal component analysis on Pol II binding at the 5′ region of genes at G1-phase time points (60–360 min). For this analysis, we first normalized Pol II binding at each time point by the sum of Pol II binding across all time points to remove gene-to-gene differences in transcriptional activity unrelated to cell cycle progression. The first principal component accounts for the most (47.2%) gene-to-gene variance and represents temporal shapes that fall along a continuum of early G1 spike versus late G1 up-regulation in Pol II binding (Fig. 2B). The temporal shapes of individual genes, as defined by the projection onto the first principal component, is highly concordant across the three biological replicates (R = 0.8–0.9) (Supplemental Fig. S6). Lower-ranking principal components are less clearly distinguishable from noise (Supplemental Fig. S6). Ranking genes based on the degree of match to the first principal component (projection of each gene onto this principal component) reveals that ∼50% of genes exhibit an early spike, 38% of genes exhibit a late plateau, and 12% of genes exhibit late up-regulation in Pol II binding, although these patterns are not discrete clusters (Fig. 2B). Among the 50% of genes exhibiting some degree of match to the early spike pattern, the magnitude of the spike at the 90-min time point is, on average, 1.4-fold and can reach up to 4.3-fold—higher than the 360-min time point (Supplemental Fig. S7). Here we refer to the early G1 spike as a trait defined quantitatively by the degree of match in the positive orientation of the first principal component, as shown in Figure 2B.
We found no association between the early G1 spike and the traveling ratio of Pol II, indicating that the occurrence of the early transcriptional spike does not involve a difference in the rate of Pol II promoter escape (Supplemental Fig. S8). Pol II binding at the 3′ regions of genes often mirrors the temporal shape for the corresponding 5′ regions (Fig. 2B panels on right, and Fig. 2C top row), and very similar principal components were obtained from applying the analysis to Pol II binding at the 3′ region of genes (analysis not shown). Thus, these temporal changes in Pol II binding reflect full-length gene transcription. Indeed, RT-qPCR of primary transcripts using primers flanking intron–exon junctions for a subset of genes demonstrate that the temporal patterns of Pol II binding at individual loci are well reflected at the level of RNA synthesis (Fig. 2C, bottom row).
The early G1 transcriptional spike pattern encompasses genes with functions general to many cell types (e.g., Tbp) (Fig. 2C) as well as genes involved in developmental regulation relevant to hematopoietic cells, such as Gata2, Myc, Kit, and Runx1 (Fig. 2B,C), with an enrichment for genes in p53 signaling pathways (Supplemental Fig. S9). The late up-regulation pattern enriches for gene ontology terms related to plasma membrane proteins (Supplemental Fig. S9) and, of relevance to erythroid biology, includes both α-globin (Hba-a1) and β-globin (Hbb-b1) genes. Note that the late up-regulation category does not necessarily represent delayed transcriptional reactivation on an absolute level; rather, these include genes that tend to reach similarly high levels of Pol II binding at the 60- to 90-min time points and then exhibit further sustained up-regulation through the remainder of G1, as exemplified by absolute Pol II binding for Mavs (Fig. 1B) and Hbb-b1 (Fig. 2B).
To test whether the early G1 spike versus late G1 up-regulation patterns are cell type-specific, we performed nocodazole-mediated mitotic arrest–release in a murine embryonal carcinoma cell line (F9) (Alonso et al. 1991) and measured transcription by primary transcript RT-qPCR. Of 13 genes examined that are expressed in both G1E GATA1-ER and F9 cells, 10 showed similar G1 transcriptional patterns in both cell types, indicating that the G1-phase modulation of transcription that we uncovered in G1E GATA1-ER cells can be found across developmentally distinct murine cell types (Supplemental Fig. S10).
The mitosis–G1 transcriptional spike also occurs at intergenic enhancers, but restoration of enhancer–promoter chromatin contacts after mitosis does not spike
Pol II is known to transcribe not only genes but also enhancers. Do enhancers display transcriptional outputs similar to that of genes at the mitosis–G1 transition? We identified enhancers in G1E GATA1-ER cells based largely on the presence of DNase-sensitive sites (Hsiung et al. 2014) that coincide with the relative absence of H3K4me3 (Wu et al. 2011) and do not overlap known transcriptional start sites. We quantified the level of Pol II binding at enhancers in the mitosis–G1 time course of G1E GATA1-ER cells from this study. We restricted our analysis to a set of 809 active enhancers with above-background Pol II binding that are located away from genes (>3 kb from the 5′ end and >20 kb from the 3′ end of gene annotations) to avoid confusion with the signal arising from Pol II occupancy at genes, which can extend several kilobases beyond the 3′ end of the gene. Principal component analysis performed on Pol II binding at these intergenic enhancers showed that the top principal component (R = 0.78–0.88) (Fig. 3A; replicate concordance analysis in Supplemental Fig. S11) reflects temporal shapes similar to that obtained from the analysis of genes in Figure 2B. Analogous to our analysis for genes in Figure 2B, we stratified Pol II-binding patterns at enhancers into early spiking, late plateau, and late up-regulated patterns based on the degree of match to the first principal component (Fig. 3A). Approximately half of all examined enhancers display an early spike in Pol II occupancy.
Figure 3.

Pol II binding at enhancers, but not enhancer–promoter contacts, also spikes at the mitosis–G1 transition. (A) For 809 intergenic enhancers, we performed principal component analysis on Pol II binding in the same fashion as that detailed for genes in Figure 2B. Shown are the results outlined in a fashion analogous to Figure 2B. For the enhancers that we highlight at the right of the heat map, we also show the raw RPKM of Pol II binding at the nearest gene. (B) Capture-C (a multiplexed derivative of chromosome conformation capture) analysis of chromatin contacts in a nocodazole arrest–release experiment using the Myc promoter as the anchor. The Y-axis of browser tracks are read counts of ligation products normalized to total number of ligation products in the library. We highlight a likely enhancer at the +211-kb region (resides within the transcribed region of noncoding RNA Pvt1, which is omitted in the graph for clarity) and a known enhancer at the +1.7-Mb region (Shi et al. 2013). (C, left) Quantification of Capture-C read densities for the Myc +211-kb and +1.7-Mb enhancers. The Y-axis denotes read counts reflecting ligation products between the enhancer region and the anchor, normalized to total number of ligation products in the library. Error bars denote SEM, with n = 3 sequencing libraries encompassing two separate ligation libraries and three separate oligo captures. (Right) Pol II ChIP-seq read densities at the Myc gene (5′ 2.5 kb and 3′ 2.5 kb, duplicated from Fig. 2 for ease of comparison) and at the +211-kb and +1.7-Mb enhancers. (D) Quantification of enhancer–promoter contacts using Capture-C anchors at the promoters of early G1 transcriptional spike genes (Cd47 and Kit) and late G1 up-regulated genes (Hba-a1 and Hbb-b1). See Supplemental Figure S14 for browser tracks. These enhancers were described in prior studies: Cd47 −20 kb was described in Dogan et al. (2015), Kit −114 kb was described in Jing et al. (2008) and Lee et al. (2015), the Hba-a1 −34-kb R2 region was described in Hughes et al. (2005), and the Hbb-b1 +32.5-kb locus control region was described in Bender et al. (2000). The Y-axis is the normalized Capture-C contact frequency as described in C. Error bars and the number of replicates are as described in C, except for Hbb-b1, which represents n = 2 separate ligation libraries.
How do Pol II-binding patterns at enhancers relate to those of nearby genes? At some loci, such as the Cd47 locus, the enhancer and its nearest gene exhibit the early spike pattern (Fig. 3A). However, some loci exhibit a transcriptional spike for the gene without appreciable spiking of Pol II binding at its known enhancer (Fig. 3A; Supplemental Fig. S12A). When examined in an unbiased manner across the 809 intergenic enhancers, the correlation with the degree of early G1 Pol II spiking at the nearest gene is mild (R = 0.34) (Supplemental Fig. S13) and hence difficult to interpret. We note that assigning each enhancer to its nearest gene does not account for enhancers that regulate distant genes and that there is not necessarily a one-to-one pairing of enhancers and genes.
As another proxy for enhancer activity, we measured enhancer–promoter chromatin contacts using Capture-C (Hughes et al. 2014), a multiplexed derivative of chromosome conformation capture, in a mitotic arrest–release time course with anchors located at promoters of three early spike genes (Cd47, Kit, and Myc) and two late up-regulation genes (Hba-a1 and Hbb-b1). Enhancers are known to preferentially lose chromatin accessibility during mitosis (Hsiung et al. 2014), but it is unknown whether enhancer–promoter chromatin contacts can be maintained during mitosis. We found that all of the enhancer–promoter pairs examined showed depletion of contacts during mitosis (Fig. 3B–D, Supplemental Figs. S12B, S14). These results demonstrate that mitotic disruption of long-range genome folding—previously shown for replication timing domains (Dileep et al. 2015), chromosome compartments, and topologically associating domains (Naumova et al. 2013)—is a general rule that includes enhancer–promoter contacts.
Upon G1 entry, the enhancer–promoter contacts increase sharply by 60–90 min and show no significant change by 360 min regardless of whether the gene transcriptional pattern is categorized as early spike or late up-regulated (Fig. 3B–D). We conclude that the frequency of enhancer–promoter contacts does not necessarily scale quantitatively with the early G1 spike or late G1 up-regulation of transcription. Whether enhancer–promoter contacts are required to initiate an early G1 transcriptional spike at genes remains an open question.
Mitotic H3K27ac levels predict mitosis–G1 transcriptional spiking at genes and intergenic enhancers
What mechanism might underlie the mitosis–G1 transcriptional spike at genes and enhancers? We hypothesized that chromatin-associated features, especially those during mitosis, at genes and enhancers may predict differences among loci in their G1 transcriptional patterns. We performed correlative analysis of the following data: (1) Pol II ChIP-seq in asynchronous cells (data generated in this study), (2) DNase sequencing (DNase-seq) in mitotic and asynchronous cells (from Hsiung et al. 2014), (3) transcription factor GATA1 ChIP-seq in mitotic and asynchronous cells (from Kadauke et al. 2012), (4) H3K27ac ChIP-seq in mitotic and asynchronous cells (data generated in this study), and (5) ChIP-seq of histone H3 lysine methylation modifications in asynchronous cells (H3K4me3, H3K4me1, H3K27me3, and H3K9me3 data from Wu et al. 2011). Importantly, the mitosis data sets for DNase-seq and GATA1 ChIP-seq were derived from nocodazole-arrested cells subjected to purification by FACS for the mitotic epitope H3S10Ph to achieve >98% mitotic purity (Kadauke et al. 2012; Hsiung et al. 2014). Likewise, to carry out H3K27ac ChIP-seq on mitotic cells, we applied a similar procedure using a more robust and cost-effective mitosis-specific antibody (MPM2) to achieve essentially 100% mitotic purity (Campbell et al. 2014). The mitotic purity of these samples ensures that the data reflect properties of mitotic cells rather than contaminating interphase cells. H3K27ac levels in prometaphase strongly, but imperfectly, correlate with that in asynchronous cells at promoters (R = 0.72) and intergenic enhancers (R = 0.72), indicating a degree of locus specificity in the maintenance of H3K27ac in mitosis (Supplemental Fig. S15). To our knowledge, this is the first report of H3K27ac levels in mitosis measured by ChIP.
For each data set, we quantified read counts at promoters of active genes (4309 genes analyzed in Fig. 2) and intergenic enhancers (809 enhancers analyzed in Fig. 3). In Figure 4, we show the Pearson correlation coefficient between the read counts for each feature with our measure of early spike versus late up-regulation G1 transcriptional patterns (Pol II ChIP-seq degree of match to the first principal component in Figs. 2, 3), analyzing promoters and intergenic enhancers separately. Among the features examined at promoters, the early G1 transcriptional spike is most strongly correlated with H3K27ac levels in mitosis, including both prometaphase (R = 0.47) and anaphase–telophase (R = 0.53) populations. By comparison, the correlation between the early G1 transcriptional spike and promoter H3K27ac levels in asynchronous cells is less positive (R = 0.30), indicating that mitotic H3K27ac levels specifically provide some additional predictive power. Likewise, for intergenic enhancers, the H3K27ac level in mitosis (R = 0.35 for prometaphase; R = 0.46 for anaphase-telophase) is the most positively correlated with the early G1 transcriptional spike and is less positively correlated for the H3K27ac level in asynchronous cells (R = 0.12) (Fig. 4).
Figure 4.
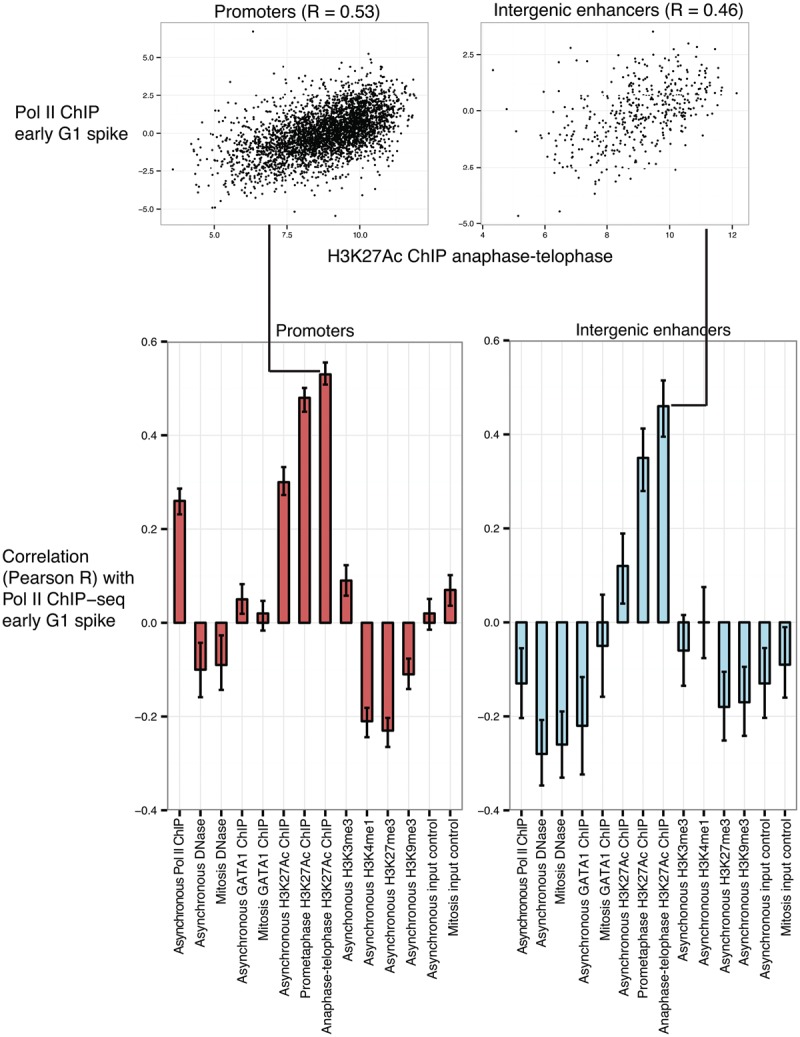
Higher levels of H3K27ac during mitosis predict the mitosis–G1 transcriptional spike at genes and intergenic enhancers. We examined the signal strength of chromatin-associated features in mitotic and/or asynchronous cells for their genome-wide correlation (Pearson R) with the early G1 transcriptional spike, defined in Figure 2B for genes and in Figure 3A for intergenic enhancers as the degree of match to the first principal component from Pol II ChIP-seq. Pol II ChIP-seq was generated in this study, DNase-seq was from Hsiung et al. (2014), GATA1 ChIP-seq was from Kadauke et al. (2012), H3K27ac ChIP-seq was generated in this study, and H3K4me1, H3K4me3, H3K9me3, H3K27me3 were from Wu et al. (2011). The mitosis H3K27ac ChIP-seq sample consisted of ∼100% mitotic purity obtained by FACS for MPM2 positivity as described in Campbell et al. (2014). Error bars denote 95% confidence intervals.
In contrast, the mitotic or asynchronous levels of two features at promoters previously shown to have locus-specific degrees of persistence in mitosis—DNase sensitivity (Hsiung et al. 2014) and GATA1 occupancy (Kadauke et al. 2012)—showed no correlation with the early G1 transcriptional spike. However, this does not rule out that there might be a minimal level of mitotic DNase sensitivity required for the early G1 transcriptional spike because the promoters of virtually all transcriptionally active genes are at least somewhat DNase-sensitive in mitosis. The early G1 transcriptional spike is also weakly correlated with promoter levels of Pol II binding (R = 0.26), suggesting a mild association with overall levels of transcriptional activity (Fig. 4). Another active promoter modification, H3K4me3, is not predictive (R = 0.09), whereas levels of repressive modifications H3K27me3 (R = −0.23) and H3K9me (R = −0.11) in asynchronous cells are weakly anti-correlated with the early G1 transcriptional spike (Fig. 4). At intergenic enhancers, levels of DNase sensitivity, GATA1 occupancy, H3K4me1, H3K4me3, H3K27me3, and H3K9me3 in mitotic and/or asynchronous cells are all either weakly anti-correlated or uncorrelated with the early G1 transcriptional spike (Fig. 4).
We conclude that the H3K27ac level specifically during mitosis exceeds other indicators of active chromatin in its predictive power of the early G1 transcriptional spike at both genes and intergenic enhancers. Since this strongest predictor precedes the mitosis–G1 transcriptional spike, the temporality of the association is consistent with the possibility that mitotic H3K27ac may be involved in causing the mitosis–G1 transcriptional spike.
The mitosis–G1 transcriptional spike propagates to cell-to-cell heterogeneity in mature mRNA expression
Our findings thus far demonstrate a spike in transcriptional activity at the mitosis–G1 transition based on measurements of cell population average. Does this transcriptional spike occur in all cells in the population or only a subset of cells, thus potentially contributing to transcriptional heterogeneity among cells? Is the mitosis–G1 transcriptional spike buffered by post-transcriptional regulation, or does the transcriptional spike propagate to elevated mature mRNA levels? To address these questions, we used single-molecule RNA FISH to simultaneously quantify nascent and mature mRNA in single cells by three-dimensional (3D) microscopy (Femino 1998; Raj et al. 2008; Levesque and Raj 2013). We imaged nascent and mature mRNAs in the same field by hybridizing fixed cells with spectrally distinguishable probes specific to introns or exons of a given gene. While the vast majority of exonic probe signals are from mature mRNAs, colocalized exonic and intronic probe signals are primary transcripts that mark active transcription sites in interphase cells (Fig. 5A). In prometaphase, cells with condensed chromosomes show no detectable signal in the intronic channel due to mitotic transcriptional silencing, whereas stable mature mRNA molecules that presumably arose prior to mitosis are detectable (Fig. 5A). Consistent with our Pol II ChIP-seq data, the earliest active transcription appears in cells between anaphase and cytokinesis (4N and low YFP-MD). This RNA synthesis occurs amid chromosomes that are still morphologically condensed, demonstrating that overt condensation does not prohibit gene transcription (Fig. 5A; Supplemental Fig. S16).
Figure 5.

The mitosis–G1 transcriptional spike can propagate to cell-to-cell heterogeneity in mature mRNA expression. (A) Images of representative cells in interphase, in prometaphase arrest by nocodazole, and between anaphase and telophase (60 min after nocodazole release, sorted for 4N and YFP-MD low) taken by 3D wide-field microscopy. A single optical plane is shown for the DAPI channel. Maximum projections are shown for the Gata2 exonic probe (coupled to Cy3) and intronic probe (coupled to Alexa 594) channels for RNA FISH, with single mature mRNA molecules and intron–exon-colocalized spots highlighted. (B) Gata2 intron and exon RNA FISH in a representative field of asynchronous cells. (C) In cells subjected to nocodazole arrest–release and FACS-purified in a manner similar to Figure 1B, we performed RNA FISH for Myc and Gata2 in the low expression state (+estradiol 13 h) and quantified the fraction of cells that contain at least one intron–exon colocalized spot, indicative of active transcription (referred to here as transcriptionally “on”). Horizontal dashed lines indicate levels from asynchronous populations in both the low expression (+estradiol 13 h) and fully activated (no estradiol) states. (D) From the same experiment as in C, we show the distributions of single-cell mature mRNA concentrations (mRNA count/cell size) of transcriptionally “on” versus “off” cells, with each dot representing a cell. The line connects the medians of the distributions, and the interquartile range is indicated. We imaged 120–262 cells for each time point. Vertical orange dotted lines demarcate the timing of the transcriptional spike as shown in C. Horizontal dotted lines mark thresholds selected based on receiver operating characteristic curves (Supplemental Fig. S19) for discriminating the low expression (+estradiol 13 h) versus fully activated (no estradiol) asynchronous populations. Additional biological replicates are shown in Supplemental Figure S17. P-values (one-sided Wilcoxon test) for the differences in distributions between the transcription “on” and “off” cells are indicated for select time points.
We focused on two genes that exhibit transcriptional spikes at the mitosis–G1 transition: Myc and Gata2 (Pol II ChIP patterns for both are in Fig. 2B). Myc and Gata2 encode for transcription factors that regulate stemness and self-renewal and whose mature mRNA half-lives are relatively short (∼15 min to 2 h for Myc [Dani et al. 1984; Watson 1988; Herrick and Ross 1994] and ∼2.8 h for Gata2 [Sharova et al. 2009]). Expression of Myc and Gata2 is down-regulated upon exposure to estradiol for 13 h through transcriptional repression by GATA1-ER (Grass et al. 2003; Rylski et al. 2003), and, at this relatively low level of expression, the mature mRNA levels among single cells can vary by >100-fold (Fig. 5C; Supplemental Fig. S19). The single-cell expression patterns of these genes allow evaluation of the degree to which mitosis–G1 transcriptional spiking of these genes can contribute to heterogeneity in mature mRNA levels.
Transcription visualized by single-cell imaging is known to occur intermittently, with intervals of active RNA synthesis interspersed with periods of inactivity (Golding et al. 2005; Chubb et al. 2006; Raj et al. 2006). When cells are fixed and viewed as a static image of single-molecule RNA FISH, this pulsatile nature of transcription manifests as a mix of transcriptionally “on” and “off” cells (Fig. 5B; Supplemental Fig. S16). Single-molecule RNA FISH shows that the early transcriptional spike that we observed as an average across cell populations (Fig. 2B) occurs by a spike in the fraction of cells actively transcribing at the mitosis–G1 transition for both Myc (45% for 4N cells at the 60-min point vs. 12.5% at the 240-min time point) (Fig. 5C left panel) and Gata2 (50% for 4N cells at the 60-min time point vs. 5% at the 240-min time point) (Fig. 5C right panel). Of note, the zenith of the transcriptional spike coincides with the time point when chromosomes are still morphologically condensed (Fig. 5A,C). In contrast, the intensity of transcription sites is relatively unchanged (Supplemental Fig. S18). Thus, the mitosis–G1 spike in averaged transcriptional output mostly arises from an increase in the probability of the gene being in a transcriptionally “on” state and not from an increase in the number of nascent transcripts synthesized during each “on” period.
How does the spike in the probability of being in a transcriptionally “on” state at the mitosis–G1 transition manifest at the level of mature mRNA in single cells? To address this, we quantified the number of mature mRNA molecules in each cell. For both Gata2 and Myc, the transcriptionally “on” cells express higher levels of mature mRNA than the transcriptionally “off” cells across all time points (Fig. 5D), confirming that the intermittent nature of transcription for these genes contributes visibly to cell-to-cell variability in mature mRNA levels. Furthermore, among the transcriptionally “on” cells, the mature mRNA levels spike at the 90- to 120-min time points, subsequent to the spike in transcription for both My (1.9-fold increase in median mature mRNA concentration from 60 to 90 min in 2N cells)c (Fig. 5D left panel) and Gata2 (1.5-fold increase in median mature mRNA) (Fig. 5D right panel). Of note, this spike is not observed for the transcriptionally “off” cells in the corresponding time points. Additional biological replicates are shown in Supplemental Figure S17. In static images, the spike in mature mRNA specifically among transcriptionally “on” cells at the 90- to 120-min time points (Fig. 5D) must have arisen from transcriptional activity prior in time; thus, the spike in mature mRNA levels at these time points is enriched for the subset of cells that previously participated in the transcriptional spike at the 60-min time point. These results support that the mitosis–G1 transcriptional spike reflects an increased probability that individual cells are in a transcriptionally “on” state and is substantial enough to produce a spike in mature mRNA levels to overcome any potential buffering by post-transcriptional regulation. While unable to directly offer mRNA expression trajectories of single cells over time, these data suggest that participation by individual cells in the transcriptional spike at the 60-min time point may predispose those cells to be in a transcriptionally “on” state in subsequent time points even when the overall fraction of the population transcribing has already declined.
Early spike and late-up-regulation G1 transcriptional patterns can be observed in the absence of cell cycle synchronization and can constitute the maximal transcriptional activity per DNA copy in the entire cell cycle
Our analyses thus far have relied on the use of cell cycle synchronization methods, as have previous studies of transcription at the mitosis–G1 transition (Blobel et al. 2009; Dey et al. 2009; Zhao et al. 2011; Fukuoka et al. 2012; Caravaca et al. 2013). While the resolution of cell cycle synchrony provided unambiguous visualization of the pioneering round of transcription upon reversal of mitotic silencing (Fig. 1B), the effects of synchronization on transcription are unknown and could potentially confound our gene expression observations. To avoid cell cycle synchronization completely, we sought to measure transcription in cells from different cell cycle stages in an asynchronous population by imaging. We used cell area as a proxy for cell cycle progression since cytokinesis, based on an empirically determined proportionality between the two variables (Supplemental Fig. S20). By tracking live cells through cell divisions using bright-field microscopy, we also demonstrated that newly divided cells in early G1 are enriched among the smallest cells (Supplemental Movie 1). Thus, combining RNA FISH with cell area provides a view of transcription with respect to approximate cell cycle progression since cytokinesis, enabling resolution within G1 phase that is difficult to achieve with other cell cycle markers. Satisfyingly, the transcriptional patterns for Gata2 and Kit (early G1 spike genes) and Hbb-b1 (a late G1 up-regulation gene) obtained by this method reflect that measured from approaches using synchronization (Fig. 6). Furthermore, after normalizing for DNA copy number changes, the early G1 spike for Gata2 and Kit constitutes the highest transcriptional activity throughout the cell cycle for those genes, whereas the maximal activity for Hbb-b1 is near the late G1/S boundary (Fig. 6). Thus, the G1-phase transcriptional patterns that we uncovered can be observed in naturally dividing cells in the absence of synchronization and can constitute periods of maximal activity in the entire cell cycle. We also note that, for both early spike genes, Gata2 and Kit, this contributes to a doubling of transcriptional activity per DNA copy when averaged across all of G1 relative to that in G2. In the Discussion, we explore the implications of this for gene dosage compensation for DNA copy changes during the cell division cycle.
Figure 6.

The mitosis–G1 transcriptional spike can be observed in the absence of synchronization and can constitute the maximum transcriptional activity per DNA copy in the entire cell cycle. Asynchronously dividing cells were imaged by 3D wide-field microscopy after performing RNA FISH for two early spike genes (Gata2 and Kit) and a late-up-regulated gene (Hbb-b1) using intronic and exonic probes. Primary transcript content is shown in a dotted line in terms of absolute primary transcript equivalents per cell and in a solid line after normalization by DNA content as a moving mean across cell area manually determined from bright-field images. Using the proportionality between cell area and DAPI intensity (Supplemental Fig. S20), we roughly estimated the G1-, S-, and G2-phase boundaries demarcated by color. Solid horizontal lines indicate the average within the entire G1 or G2 compartment. Gata2 quantification is based on images of 5702 cells pooled across four biological replicates, Kit quantification is based on images of 640 cells, and Hbb-b1 quantification is based on images of 1339 cells. The gray shading around the moving mean denotes SEM within a sliding window of cell size.
Discussion
Our results uncover previously unknown genome-wide patterns of transcriptional modulation from mitosis through late G1, observing transcriptional spiking at the mitosis–G1 transition for approximately half of all active genes and intergenic enhancers (Fig. 7). Prior to this work, an implicit expectation has been that early transcription at the mitosis–G1 transition resumes in a manner starting from initially low levels and then increases with varying kinetics to achieve maximal levels later in interphase. However, only some genes in prior studies appear to display these characteristics (Blobel et al. 2009; Zhao et al. 2011; Fukuoka et al. 2012; Kadauke et al. 2012; Caravaca et al. 2013), while others exhibit nonmonotonic patterns of transcription over time (Dey et al. 2009; Muramoto et al. 2010; Fukuoka et al. 2012; Caravaca et al. 2013). Our present results demonstrate that the initial rounds of gene transcription upon reversal of mitotic silencing exhibit higher activities across the genome compared with late G1, providing an overall context for interpreting results from prior studies. In particular, Muramoto et al. (2010) showed a spike in transcriptional activity immediately after mitosis of the act-5 gene by live-cell imaging in Dictyostelium. In light of our findings that the mitosis–G1 transcriptional spike is shared by at least two developmentally distinct murine cell lines (Supplemental Fig. S10), these results together suggest that a spike in transcriptional activity after mitosis does not reflect a peculiarity of a specific gene or cell type but is a general phenomenon of the genome that can be observed in evolutionarily distant cell types. The strength of our observation is supported by genome-wide coverage, purity of cells from the relevant cell cycle stages, extraction of prominent transcriptional patterns by unsupervised pattern discovery, and evidence that the mitosis–G1 transcriptional spike propagates to heterogeneity in single-cell mature mRNA levels.
Figure 7.

Model of transcriptional patterns in mitosis and G1 phase. We graphically summarize genome-wide transcriptional patterns during progression from mitosis through G1 phase on the population-averaged level and on the single-cell level for early spike genes. In the single-cell illustration, arrows represent likely single-cell transitions over time, with the sizes of the arrows qualitatively representing the relative probabilities of those transitions.
What might be the mechanistic underpinning of the mitosis–G1 transcriptional spike? An important consideration is the effect of mitosis on the bulk distribution of transcription regulators. For clarity of discussion, we use Pol II as an example to illustrate a likely and potentially generalizable biophysical process. Mitotic displacement of Pol II would be expected to increase the unbound fraction of Pol II that would subsequently be available to initiate transcription upon reversal of mitotic inhibition. Since transcription initiation is restricted to promoter and enhancer regions, this process would likely produce a transient increase in the ratio of effective enzyme concentration to the available DNA substrate. Upon reversal of mitotic silencing, such global shifts in factor distribution might predispose much of the genome to transcriptional spiking by mass action. Given that many general transcription factors have genomic occupancy distributions similar to Pol II during interphase and are likewise displaced from mitotic chromatin, the above scenario almost certainly applies to some factor that exists at a limiting concentration for transcriptional initiation. Such global changes in effective concentrations would be difficult to test for experimentally.
The degree of locus specificity observed for the mitosis–G1 transcriptional spike requires additional explanations. Figure 4 suggests that regions with high H3K27ac might be preferred by Pol II reinitiation, explaining their proclivity for transcriptional spiking. Numerous studies proposed or assumed that chromatin-associated molecular entities marking individual loci during mitosis would influence the subsequent reading of the genome by the transcriptional machinery at the mitosis–G1 transition. Hence, these entities are metaphorically alluded to as mitotic “bookmarks.” How is H3K27ac—now a candidate bookmark uncovered by genome-wide association—specified at individual loci during mitosis? Levels of histone acetylation in general are thought to result from the dynamic equilibrium of histone acetyltransferase versus histone deacetylase activities. Immunofluorescence microscopy previously showed that most acetylated histone H3 is globally reduced during mitosis (Kruhlak et al. 2001). This may reflect the outcome of bulk redistribution of both histone acetyltransferases—including p300 and CBP, known to be responsible for depositing H3K27ac (Tie et al. 2009)—and histone deacetylases away from chromatin in mitosis (Kruhlak et al. 2001). Thus, our observation of significant retention of H3K27ac by ChIP-seq at many loci during mitosis is likely an exception with respect to overall depletion of histone H3 acetylation and indicates that some level of histone acetyltransferase activity must remain and exert locus-specific effects during mitosis. How the activities of these enzymes are specified at individual loci during mitosis remains unexplored.
What might be the biological consequence of the mitosis–G1 transcriptional spike? It is unclear whether this phenomenon has been programmed to serve a biological function. Recent single-molecule RNA FISH studies of candidate genes in mammalian cells (Padovan-Merhar et al. 2015; Skinner et al. 2016) and genome-wide studies in Saccharomyces cerevisiae (Voichek et al. 2016) have shown that total transcriptional outputs for individual genes before and after DNA replication in S phase are equal. Our single-molecule RNA FISH measurements of per-copy gene transcription for the early G1 transcriptional spike genes Gata2 and Kit are consistent with these prior observations. Thus, on a per-DNA-copy level, transcriptional activity is twofold higher in G1 than in G2, an observation first proposed by Padovan-Merhar et al. (2015) as promoting transcriptional homeostasis in the face of increased DNA copy upon replication. This doubled transcriptional activity per DNA copy overall in G1 necessarily includes contributions from the mitosis–G1 transcriptional spike. Thus, at least a portion of the transcriptional compensation in G1 arises from an unknown mechanism that exerts the most effect at the mitosis–G1 transition rather than acting uniformly throughout G1. Such a model would not be mutually exclusive with, and could act in concert with, other potential mechanisms previously suggested to contribute to transcriptional gene dosage compensation, such as the dampening of transcriptional output upon nascent DNA synthesis in S phase (Padovan-Merhar et al. 2015; Voichek et al. 2016). To what extent a dysregulation in gene dosage compensation at the transcriptional level might influence cellular function remains an intriguing open question.
Regardless of whether the mitosis–G1 transcriptional spike serves any particular biological function, our analysis of mature mRNA expression levels in transcriptionally “on” versus “off” cells (Fig. 5) suggests that the transcriptional spike does not occur uniformly across a cell population. The differences in mature mRNA levels between the transcriptionally “on” and “off” cells (Fig. 5) appear modest (1.5-fold for Myc and 1.9-fold for Gata2) in the context of the population's overall >100-fold range in mature mRNA levels. However, our approach of imaging fixed cells cannot directly evaluate a cumulative effect size that might be extracted from observing the trajectories of mRNA production in live individual cells over multiple cell divisions. To illustrate this possibility, suppose that, upon division of a single cell, the early G1 transcriptional spike stochastically occurs in one daughter cell but not the other, perhaps, on average, resulting in a 1.9-fold difference of mature mRNA levels in those two cells. Such a difference, while moderate to begin with, might predispose one cell to a higher probability of subsequent higher expression levels. Such a scenario is consistent with, although not proven by, our indirect inferences from static images in Figure 5 and might be particularly applicable if the gene product is involved in an autoregulatory positive feedback loop. Repeated sampling of the mitosis–G1 transition over multiple cell divisions might account for at least part of the eventual substantial divergence in gene expression state among all of the progeny of the original founding cell. Consideration of the mitosis–G1 transition as a source of gene expression heterogeneity might pave the way for understanding why the probability of certain types of phenotypic transitions is modified by rapid proliferation (Smith et al. 2010) and passage through mitosis (Egli et al. 2008; Ganier et al. 2011; Halley-Stott et al. 2014) or early G1 phase (Singh et al. 2013). We envision that the mitosis–G1 transcriptional spike, on average, may promote gene expression homeostasis with respect to DNA dosage, yet its variable occurrence at the single-cell level may contribute to diversification of gene expression states.
Materials and methods
Cell culture, cell cycle synchronization, and cell sorting
G1E erythroblasts were previously derived through deletion of GATA1 in mouse embryonic stem cells followed by in vitro differentiation (Weiss et al. 1997). We cultured a subline of G1E cells, G1E-ER4, in which GATA1-ER was retrovirally transduced (referred to in the text as G1E GATA1-ER), as described previously (Weiss et al. 1997). We retrovirally transduced G1E-ER4 cells with the YFP-MD construct (Kadauke et al. 2012) and sorted for a pool of YFP-positive cells. Except where indicated in the text as uninduced, we induced cells to mature with 100 nM estradiol to activate GATA1-ER. During estradiol induction, cells were simultaneously treated with 200 ng/mL nocodazole for 7–13 h, washed once, and replated into fresh medium lacking nocodazole for varying times (40–360 min), ensuring that all samples were exposed to estradiol for the same duration of 13 h. Cells were fixed with 1% formaldehyde, stained with DAPI, and sorted on a BD FACSAria based on YFP-MD and DAPI signal. Sorting of MPM2-positive prometaphase populations and MPM2-negative interphase populations for H3K27ac ChIP-seq was carried out as described in Campbell et al. (2014).
F9 cells (Alonso et al. 1991) were cultured in plates precoated with 0.1% gelatin and grown in DMEM + 10% FBS. For mitotic arrest–release, cells were treated with 200 ng/mL nocodazole for 4 h, and a “shake-off” (gentle rinsing with medium) was performed to isolate mitotic cells followed by replating into fresh medium for varying durations of the release time course.
ChIP-seq
We performed ChIP-seq of a total of three biological replicates using N-20 antibody (Santa Cruz Biotechnology, catalog no. sc899) for the 0-, 60-, 90-, 180-, and 360-min time points; two biological replicates for the 240-min time point; and one replicate for the 40-min time point. Two replicates of input DNA at the corresponding time points were also sequenced. For ChIP-qPCR of the initiating form of Pol II, we used 8WG16 antibody (Covance, catalog no. MMS-126R). H3K27ac antibody from ActiveMotif (catalog no. 39685) was used for H3K27ac ChIP-seq. To summarize briefly, cells fixed with 1% formaldehyde and subjected to lysis in detergents, sonication, and immunoprecipitation of chromatin. Following library construction through blunt end repair and adaptor ligation using Illumina's TruSeq ChIP sample preparation kit (Illumina, catalog no. IP-202-1012), size selection with SPRIselect beads (Beckman Coulter, catalog no. B23318), and PCR amplification, libraries were multiplexed and sequenced on an Illumina HiSeq 2000. The mean fragment size was ∼330 base pairs (bp). See the Supplemental Material for details.
Bioinformatic analysis of ChIP-seq data
To summarize briefly, reads were mapped to the mouse mm9 genome using Bowtie (Langmead et al. 2009). Mapped reads were passed to MACS (Zhang et al. 2008) with a matched control (input) data set for peak calling and producing Bigwig files with reads shifted to account for fragment size. If the 5′ or 3′ 2.5-kb region of a gene overlapped at least one Pol II peak called by MACS in at least one sample (arrest–release and asynchronous samples with estradiol induction), then we deemed the gene active, arriving at 4309 nonoverlapping active genes defined by the single largest annotated transcript of each gene. We defined 809 intergenic enhancers as those DNase hot spot regions previously described to overlap H3K4me1 in the relative absence of H3K4me3 (Hsiung et al. 2014) and the Pol II MACS peak and must not overlap the 5′ −3-kb and 3′ +10-kb regions of annotated genes. “Pol II binding” or “read density” used in the context of Pol II ChIP-seq in the text refers to reads per million kilobases per million mapped reads (RPKM) from regions of interest. We performed principal component analysis on RPKMs normalized by the sum of RPKMs for each gene across the G1 time points (60, 90, 180, and 240 min for replicates 2 and 3 and 360 min) using the R package prcomp and custom scripts. Details are in the Supplemental Material, and scripts are provided as described in the “Data Access” section.
RT-qPCR of primary transcripts
We isolated RNA using TRIzol (Life Technologies) or TRIzol LS (Life Technologies). Reverse transcriptase reaction was performed with iScript (Bio-Rad). qPCR was performed with Power SYBR Green (Invitrogen). All primer sequences are in the Supplemental Material. For primary transcript measurements, primers flank intron–exon junctions. Primary transcript quantifications are normalized to Gapdh mature mRNA. Results are similar when normalized to Hprt mature mRNA (data not shown).
Capture-C
After cell fixation with 1% formaldehyde for 10 min and cell sorting as described above, Capture-C was performed with a double-capture procedure (Davies et al. 2016). Chromatin was digested using DpnII. We used biotin-labeled DNA oligos to pull down the target restriction fragments. Capture-C libraries were sequenced on Nextseq500 with paired-end sequencing (75 bp on each end). The raw reads were processed using published scripts (https:// github.com/telenius/captureC/releases). We wrote custom scripts to normalize data by the total number of reads representing fragments ligated to the anchor region in the library. Enhancer regions used for quantitation were defined by assessment of Capture-C signal by eye together with consideration of prior literature and DNase sensitivity signals from Hsiung et al. (2014).
Single-molecule RNA FISH
We performed single-molecule RNA FISH as described previously (Femino 1998; Raj et al. 2008; Raj and Tyagi 2010; Levesque and Raj 2013). In brief, we fixed cells in 1.85% formaldehyde for 10 min at room temperature and stored them in 70% ethanol at 4°C until further processing. FISH probes consisted of oligonucleotides conjugated to fluorescent dyes as follows: Myc exons to Cy5, Gata2 exons to Cy3, Myc introns to Alexa594, and Gata2 introns to Alexa 594. Oligonucleotide sequences are in the Supplemental Material. Imaging was performed on a Nikon Ti-E inverted fluorescence microscope using a 100× plan-apo objective (numerical aperture of 1.43), a cooled CCD camera (Pixis 1024B from Princeton Instruments), and filter sets SP102v1 (Chroma), SP104v2 (Chroma), and 31000v2 (Chroma) for Cy3, Cy5 and DAPI, respectively. A custom filter (Omega) was used for Alexa 594. We took optical z-sections (typically 45) at intervals of 0.35 µm, spanning the vertical extent of cells, with 1 sec of exposure time for Cy3, Cy5, and Alexa 594 and 100 msec of exposure time for DAPI.
Image analysis
We manually segmented the boundaries of cells from bright-field images and localized RNA spots using custom software written in MATLAB (Raj and Tyagi 2010). The area within segmentation borders was used for cell area. For Figure 6, we adjusted for minor systematic variations in the distributions of cell area found across imaging sessions by adding a constant to the cell area such that the medians across all biological replicates were equal. Mature mRNA concentrations per cell were quantified by the spot counts in the exon channel divided by the cell area. Primary transcripts are identified by intron and exon colocalization as detailed in the Supplemental Material. For Figure 5, actively transcribing cells are defined as those that have at least one intron–exon-colocalized spot.
Data access
All raw and processed sequencing data will be deposited at Gene Expression Omnibus (GSE83293). In addition, scripts that reproduce the majority of figures starting from processed data in tabular form (including RPKMs from ChIP-seq, spot counts and intensities from single-molecule RNA FISH, read counts from Capture-C, and Ct values from RT-qPCR) are provided and maintained in an online repository (https://chsiung@bitbucket.org/arjunrajlaboratory/hsiung_mitosisreactivation). Pol II ChIP-seq tracks can be viewed at the genome browser hosted by Pennsylvania State University (http://main.genome-browser.bx.psu.edu/cgi-bin/hgTrackUi?hgsid=206746_6ux0ZS2v9DeKCbVJzcfJ2tRchNFS&c=chr5&g=meryYfpmd).
Supplementary Material
Acknowledgments
We thank Hua-Ying Fan and Robert Lake for the generous gift of F9 cells. We thank Sarah Hsu, Katherine Palozola, Sheila Teves, and Kenneth Zaret for critical reading of the manuscript. We also thank Gautham Nair, Marshall Levesque, Jennifer Phillips-Cremins, Michael Lampson, Hua-Ying Fan, and Stephen A. Liebhaber for helpful discussions. This work was supported by National Institutes of Health T32GM008216 (to C.C.-S.H.); National Institutes of Health New Innovator Award 1DP2OD008514 (to A.R.); National Institutes of Health R33 1R33EB019767 (to A.R.), R56-DK065806 (to R.C.H. and G.A.B.), and 1U01HL129998 (to A.R. and G.A.B.); a generous donation by the DiGaetano family (to G.A.B. and P.E.); and National Institutes of Health 1RO1 HL119479 (to G.A.B.). C.C.-S.H., A.R., and G.A.B. planned the study. C.C.-S.H., C.R.B., P.H., A.J.S., C.A.K., C.F., K.S.J., and L.S. performed experiments. C.C.-S.H., C.R.B., P.G., P.E., P.H., and B.G. performed computational data processing and analyses. C.C.-S.H., R.C.H., A.R., and G.A.B. interpreted the results. C.C.-S.H., A.R., and G.A.B. wrote the manuscript with input from all authors.
Footnotes
Supplemental material is available for this article.
Article is online at http://www.genesdev.org/cgi/doi/10.1101/gad.280859.116.
References
- Akoulitchev S, Reinberg D. 1998. The molecular mechanism of mitotic inhibition of TFIIH is mediated by phosphorylation of CDK7. Genes Dev 12: 3541–3550. [DOI] [PMC free article] [PubMed] [Google Scholar]
- Alonso A, Breuer B, Steuer B, Fischer J. 1991. The F9-EC cell line as a model for the analysis of differentiation. Int J Dev Biol 35: 389–397. [PubMed] [Google Scholar]
- Bender MA, Bulger M, Close J, Groudine M. 2000. β-globin gene switching and DNase I sensitivity of the endogenous β-globin locus in mice do not require the locus control region. Mol Cell 5: 387–393. [DOI] [PubMed] [Google Scholar]
- Beyrouthy MJ, Alexander KE, Baldwin A, Whitfield ML, Bass HW, McGee D, Hurt MM. 2008. Identification of G1-regulated genes in normally cycling human cells. PLoS One 3: e3943. [DOI] [PMC free article] [PubMed] [Google Scholar]
- Blobel GA, Kadauke S, Wang E, Lau AW, Zuber J, Chou MM, Vakoc CR. 2009. A reconfigured pattern of MLL occupancy within mitotic chromatin promotes rapid transcriptional reactivation following mitotic exit. Mol Cell 36: 970–983. [DOI] [PMC free article] [PubMed] [Google Scholar]
- Campbell AE, Hsiung CC, Blobel GA. 2014. Comparative analysis of mitosis-specific antibodies for bulk purification of mitotic populations by fluorescence-activated cell sorting. Biotechniques 56: 90–91. [DOI] [PMC free article] [PubMed] [Google Scholar]
- Caravaca JM, Donahue G, Becker JS, He X, Vinson C, Zaret KS. 2013. Bookmarking by specific and nonspecific binding of FoxA1 pioneer factor to mitotic chromosomes. Genes Dev 27: 251–260. [DOI] [PMC free article] [PubMed] [Google Scholar]
- Christova R, Oelgeschläger T. 2001. Association of human TFIID–promoter complexes with silenced mitotic chromatin in vivo. Nat Cell Biol 4: 79–82. [DOI] [PubMed] [Google Scholar]
- Chubb JR, Trcek T, Shenoy SM, Singer RH. 2006. Transcriptional pulsing of a developmental gene. Curr Biol 16: 1018–1025. [DOI] [PMC free article] [PubMed] [Google Scholar]
- Dani C, Blanchard JM, Piechaczyk M, El Sabouty S, Marty L, Jeanteur P. 1984. Extreme instability of Myc mRNA in normal and transformed human cells. Proc Natl Acad Sci 81: 7046–7050. [DOI] [PMC free article] [PubMed] [Google Scholar]
- Davies JO, Telenius JM, McGowan SJ, Roberts NA, Taylor S, Higgs DR, Hughes JR. 2016. Multiplexed analysis of chromosome conformation at vastly improved sensitivity. Nat Methods 13: 74–80. [DOI] [PMC free article] [PubMed] [Google Scholar]
- Dey A, Ellenberg J, Farina A, Coleman AE, Maruyama T, Sciortino S, Lippincott-Schwartz J, Ozato K. 2000. A bromodomain protein, MCAP, associates with mitotic chromosomes and affects G2-to-M transition. Mol Cell Biol 20: 6537–6549. [DOI] [PMC free article] [PubMed] [Google Scholar]
- Dey A, Nishiyama A, Karpova T, McNally J, Ozato K. 2009. Brd4 marks select genes on mitotic chromatin and directs postmitotic transcription. Mol Biol Cell 20: 4899–4909. [DOI] [PMC free article] [PubMed] [Google Scholar]
- Dileep V, Ay F, Sima J, Vera DL, Noble WS, Gilbert DM. 2015. Topologically-associating domains and their long-range contacts are established during early G1 coincident with the establishment of the replication timing program. Genome Res 25: 1104–1113. [DOI] [PMC free article] [PubMed] [Google Scholar]
- Dogan N, Wu W, Morrissey CS, Chen KB, Stonestrom A, Long M, Keller CA, Cheng Y, Jain D, Visel A, et al. 2015. Occupancy by key transcription factors is a more accurate predictor of enhancer activity than histone modifications or chromatin accessibility. Epigenetics Chromatin 8: 16. [DOI] [PMC free article] [PubMed] [Google Scholar]
- Egli D, Birkhoff G, Eggan K. 2008. Mediators of reprogramming: transcription factors and transitions through mitosis. Nat Rev Mol Cell Biol 9: 505–516. [DOI] [PMC free article] [PubMed] [Google Scholar]
- Femino AM. 1998. Visualization of single RNA transcripts in situ. Science 280: 585–590. [DOI] [PubMed] [Google Scholar]
- Fukuoka M, Uehara A, Niki K, Goto S, Kato D, Utsugi T, Ohtsu M, Murakami Y. 2012. Identification of preferentially reactivated genes during early G1 phase using nascent mRNA as an index of transcriptional activity. Biochem Biophys Res Commun 430: 1005–1010. [DOI] [PubMed] [Google Scholar]
- Ganier O, Bocquet S, Peiffer I, Brochard V, Arnaud P, Puy A, Jouneau A, Feil R, Renard JP, Méchali M. 2011. Synergic Reprogramming of mammalian cells by combined exposure to mitotic Xenopus egg extracts and transcription factors. Proc Natl Acad Sci 108: 17331–17336. [DOI] [PMC free article] [PubMed] [Google Scholar]
- Glotzer M, Murray AW, Kirschner MW. 1991. Cyclin is degraded by the ubiquitin pathway. Nature 349: 132–138. [DOI] [PubMed] [Google Scholar]
- Golding I, Paulsson J, Zawilski SM, Cox EC. 2005. Real-time kinetics of gene activity in individual bacteria. Cell 123: 1025–1036. [DOI] [PubMed] [Google Scholar]
- Gottesfeld JM, Forbes DJ. 1997. Mitotic repression of the transcriptional machinery. Trends Biochem Sci 22: 197–202. [DOI] [PubMed] [Google Scholar]
- Grass JA, Boyer ME, Pal S, Wu J, Weiss MJ, Bresnick EH. 2003. GATA-1-dependent transcriptional repression of GATA-2 via disruption of positive autoregulation and domain-wide chromatin remodeling. Proc Natl Acad Sci 100: 8811–8816. [DOI] [PMC free article] [PubMed] [Google Scholar]
- Halley-Stott RP, Jullien J, Pasque V, Gurdon J. 2014. Mitosis gives a brief window of opportunity for a change in gene transcription. PLoS Biol 12: e1001914. [DOI] [PMC free article] [PubMed] [Google Scholar]
- Herrick DJ, Ross J. 1994. The half-life of c-Myc mRNA in growing and serum-stimulated cells: influence of the coding and 3′ untranslated regions and role of ribosome translocation. Mol Cell Biol 14: 2119–2128. [DOI] [PMC free article] [PubMed] [Google Scholar]
- Holloway SL, Glotzer M, King RW, Murray AW. 1993. Anaphase is initiated by proteolysis rather than by the inactivation of maturation-promoting factor. Cell 73: 1393–1402. [DOI] [PubMed] [Google Scholar]
- Hsiung CC, Morrissey CS, Udugama M, Frank CL, Keller CA, Baek S, Giardine B, Crawford GE, Sung MH, Hardison RC, et al. 2014. Genome accessibility is widely preserved and locally modulated during mitosis. Genome Res 25: 213–225. [DOI] [PMC free article] [PubMed] [Google Scholar]
- Hughes JR, Cheng JF, Ventress N, Prabhakar S, Clark K, Anguita E, De Gobbi M, de Jong P, Rubin E, Higgs DR. 2005. Annotation of cis-regulatory elements by identification, subclassification, and functional assessment of multispecies conserved sequences. Proc Natl Acad Sci 102: 9830–9835. [DOI] [PMC free article] [PubMed] [Google Scholar]
- Hughes JR, Roberts N, McGowan S, Hay D, Giannoulatou E, Lynch M, De Gobbi M, Taylor S, Gibbons R, Higgs DR. 2014. Analysis of hundreds of cis-regulatory landscapes at high resolution in a single, high-throughput experiment. Nat Genet 46: 205–212. [DOI] [PubMed] [Google Scholar]
- Jing H, Vakoc CR, Ying L, Mandat S, Wang H, Zheng X, Blobel GA. 2008. Exchange of GATA factors mediates transitions in looped chromatin organization at a developmentally regulated gene locus. Mol Cell 29: 232–242. [DOI] [PMC free article] [PubMed] [Google Scholar]
- Kadauke S, Udugama MI, Pawlicki JM, Achtman JC, Jain DP, Cheng Y, Hardison RC, Blobel GA. 2012. Tissue-specific mitotic bookmarking by hematopoietic transcription factor GATA1. Cell 150: 725–737. [DOI] [PMC free article] [PubMed] [Google Scholar]
- Kelly TK, Miranda TB, Liang G, Berman BP, Lin JC, Tanay A, Jones PA. 2010. H2A.Z maintenance during mitosis reveals nucleosome shifting on mitotically silenced genes. Mol Cell 39: 901–911. [DOI] [PMC free article] [PubMed] [Google Scholar]
- Kind J, Pagie L, Ortabozkoyun H, Boyle S, de Vries SS, Janssen H, Amendola M, Nolen LD, Bickmore WA, van Steensel B. 2013. Single-cell dynamics of genome-nuclear lamina interactions. Cell 153: 178–192. [DOI] [PubMed] [Google Scholar]
- Kruhlak MJ, Hendzel MJ, Fischle W, Bertos NR, Hameed S, Yang XJ, Verdin E, Bazett-Jones DP. 2001. Regulation of global acetylation in mitosis through loss of histone acetyltransferases and deacetylases from chromatin. J Biol Chem 276: 38307–38319. [DOI] [PubMed] [Google Scholar]
- Kuo MT, Iyer B, Schwarz RJ. 1982. Condensation of chromatin into chromosomes preserves an open configuration but alters the DNase I hypersensitive cleavage sites of the transcribed gene. Nucleic Acids Res 10: 4565–4579. [DOI] [PMC free article] [PubMed] [Google Scholar]
- Lake RJ, Tsai PF, Choi I, Won KJ, Fan HY. 2014. RBPJ, the major transcriptional effector of Notch signaling, remains associated with chromatin throughout mitosis, suggesting a role in mitotic bookmarking. PLoS Genet 10: e1004204. [DOI] [PMC free article] [PubMed] [Google Scholar]
- Langmead B, Trapnell C, Pop M, Salzberg SL. 2009. Ultrafast and memory-efficient alignment of short DNA sequences to the human genome. Genome Biol 10: R25. [DOI] [PMC free article] [PubMed] [Google Scholar]
- Lee K, Hsiung CC, Huang P, Raj A, Blobel GA. 2015. Dynamic enhancer-gene body contacts during transcription elongation. Genes Dev 29: 1992–1997. [DOI] [PMC free article] [PubMed] [Google Scholar]
- Levesque MJ, Raj A. 2013. Single-chromosome transcriptional profiling reveals chromosomal gene expression regulation. Nat Methods 10: 246–248. [DOI] [PMC free article] [PubMed] [Google Scholar]
- Lodhi N, Kossenkov AV, Tulin AV. 2014. Bookmarking promoters in mitotic chromatin: poly(ADP-ribose)polymerase-1 as an epigenetic mark. Nucleic Acids Res 42: 7028–7038. [DOI] [PMC free article] [PubMed] [Google Scholar]
- Martínez-Balbás MA, Dey A, Rabindran SK, Ozato K, Wu C. 1995. Displacement of sequence-specific transcription factors from mitotic chromatin. Cell 83: 29–38. [DOI] [PubMed] [Google Scholar]
- Michelotti EF, Sanford S, Levens D. 1997. Marking of active genes on mitotic chromosomes. Nature 388: 895–899. [DOI] [PubMed] [Google Scholar]
- Muramoto T, Müller I, Thomas G, Melvin A, Chubb JR. 2010. Methylation of H3K4 is required for inheritance of active transcriptional states. Curr Biol 20: 397–406. [DOI] [PubMed] [Google Scholar]
- Naumova N, Imakaev M, Fudenberg G, Zhan Y, Lajoie BR, Mirny LA, Dekker J. 2013. Organization of the mitotic chromosome. Science 342: 948–953. [DOI] [PMC free article] [PubMed] [Google Scholar]
- Padovan-Merhar O, Nair GP, Biaesch AG, Mayer A, Scarfone S, Foley SW, Wu AR, Churchman LS, Singh A, Raj A. 2015. Single mammalian cells compensate for differences in cellular volume and DNA copy number through independent global transcriptional mechanisms. Mol Cell 58: 339–352. [DOI] [PMC free article] [PubMed] [Google Scholar]
- Poleshko A, Mansfield KM, Burlingame CC, Andrake MD, Shah NR, Katz RA. 2013. The human protein PRR14 tethers heterochromatin to the nuclear lamina during interphase and mitotic exit. Cell Rep 5: 292–301. [DOI] [PMC free article] [PubMed] [Google Scholar]
- Prasanth KV, Sacco-Bubulya PA, Prasanth SG, Spector DL. 2003. Sequential entry of components of gene expression machinery into daughter nuclei. Mol Biol Cell 14: 1043–1057. [DOI] [PMC free article] [PubMed] [Google Scholar]
- Prescott DM, Bender MA. 1962. Synthesis of RNA and protein during mitosis in mammalian tissue culture cells. Exp Cell Res 26: 260–268. [DOI] [PubMed] [Google Scholar]
- Raff JW, Kellum R, Alberts B. 1994. The Drosophila GAGA transcription factor is asssociated with specific regions of heterochromatin throughout the cell cycle. EMBO J 13: 5977. [DOI] [PMC free article] [PubMed] [Google Scholar]
- Raj A, Tyagi S. 2010. Single molecule tools: fluorescence based approaches, part A. Methods Enzymol 472: 21–22. [DOI] [PubMed] [Google Scholar]
- Raj A, Peskin CS, Tranchina D, Vargas DY, Tyagi S. 2006. Stochastic mRNA synthesis in mammalian cells. PLoS Biol 4: e309. [DOI] [PMC free article] [PubMed] [Google Scholar]
- Raj A, van den Bogaard P, Rifkin SA, van Oudenaarden A, Tyagi S. 2008. Imaging individual mRNA molecules using multiple singly labeled probes. Nat Methods 5: 877–879. [DOI] [PMC free article] [PubMed] [Google Scholar]
- Rizkallah R, Alexander KE, Hurt MM. 2011. Global mitotic phosphorylation of C2H2 zinc finger protein linker peptides. Cell Cycle 10: 3327–3336. [DOI] [PMC free article] [PubMed] [Google Scholar]
- Rylski M, Welch JJ, Chen YY, Letting DL, Diehl JA, Chodosh LA, Blobel GA, Weiss MJ. 2003. GATA-1-mediated proliferation arrest during erythroid maturation. Mol Cell Biol 23: 5031–5042. [DOI] [PMC free article] [PubMed] [Google Scholar]
- Sharova LV, Sharov AA, Nedorezov T, Piao Y, Shaik N, Ko MS. 2009. Database for mRNA half-life of 19 977 genes obtained by DNA microarray analysis of pluripotent and differentiating mouse embryonic stem cells. DNA Res 16: 45–58. [DOI] [PMC free article] [PubMed] [Google Scholar]
- Shi J, Whyte WA, Zepeda-Mendoza CJ, Milazzo JP, Shen C, Roe JS, Minder JL, Mercan F, Wang E, Eckersley-Maslin MA, et al. 2013. Role of SWI/SNF in acute leukemia maintenance and enhancer-mediated Myc regulation. Genes Dev 27: 2648–2662. [DOI] [PMC free article] [PubMed] [Google Scholar]
- Singh AM, Chappell J, Trost R, Lin L, Wang T, Tang J, Wu H, Zhao S, Jin P, Dalton S. 2013. Cell-cycle control of developmentally regulated transcription factors accounts for heterogeneity in human pluripotent cells. Stem Cell Reports 1: 532–544. [DOI] [PMC free article] [PubMed] [Google Scholar]
- Skinner SO, Xu H, Nagarkar-Jaiswal S, Freire PR, Zwaka TP, Golding I. 2016. Single-cell analysis of transcription kinetics across the cell cycle. Elife 5: e12175. [DOI] [PMC free article] [PubMed] [Google Scholar]
- Smith ZD, Nachman I, Regev A, Meissner A. 2010. Dynamic single-cell imaging of direct reprogramming reveals an early specifying event. Nat Biotechnol 28: 521–526. [DOI] [PMC free article] [PubMed] [Google Scholar]
- Tie F, Banerjee R, Stratton CA, Prasad-Sinha J, Stepanik V, Zlobin A, Diaz MO, Scacheri PC, Harte PJ. 2009. CBP-mediated acetylation of histone H3 lysine 27 antagonizes Drosophila Polycomb silencing. Development 136: 3131–3141. [DOI] [PMC free article] [PubMed] [Google Scholar]
- Varier RA, Outchkourov NS, de Graaf P, van Schaik FM, Ensing HJ, Wang F, Higgins JM, Kops GJ, Timmers HT. 2010. A phospho/methyl switch at histone H3 regulates TFIID association with mitotic chromosomes. EMBO J 29: 3967–3978. [DOI] [PMC free article] [PubMed] [Google Scholar]
- Voichek Y, Bar-Ziv R, Barkai N. 2016. Expression homeostasis during DNA replication. Science 351: 1087–1090. [DOI] [PubMed] [Google Scholar]
- Walter J. 2003. Chromosome order in HeLa cells changes during mitosis and early G1, but is stably maintained during subsequent interphase stages. J Cell Biol 160: 685–697. [DOI] [PMC free article] [PubMed] [Google Scholar]
- Wang F, Higgins JMG. 2012. Histone modifications and mitosis: countermarks, landmarks, and bookmarks. Trends Cell Biol 23: 175–184. [DOI] [PubMed] [Google Scholar]
- Watson RJ. 1988. Expression of the c-Myb and c-Myc genes is regulated independently in differentiating mouse erythroleukemia cells by common processes of premature transcription arrest and increased mRNA turnover. Mol Cell Biol 8: 3938–3942. [DOI] [PMC free article] [PubMed] [Google Scholar]
- Weiss MJ, Yu C, Orkin SH. 1997. Erythroid-cell-specific properties of transcription factor GATA-1 revealed by phenotypic rescue of a gene-targeted cell line. Mol Cell Biol 17: 1642–1651. [DOI] [PMC free article] [PubMed] [Google Scholar]
- Wu W, Cheng Y, Keller CA, Ernst J, Kumar SA, Mishra T, Morrissey C, Dorman CM, Chen KB, Drautz D, et al. 2011. Dynamics of the epigenetic landscape during erythroid differentiation after GATA1 restoration. Genome Res 21: 1659–1671. [DOI] [PMC free article] [PubMed] [Google Scholar]
- Yang Z, He N, Zhou Q. 2008. Brd4 recruits P-TEFb to chromosomes at late mitosis to promote G1 gene expression and cell cycle progression. Mol Cell Biol 28: 967–976. [DOI] [PMC free article] [PubMed] [Google Scholar]
- Yang J, Sung E, Donlin-Asp PG, Corces VG. 2013. A subset of Drosophila Myc sites remain associated with mitotic chromosomes colocalized with insulator proteins. Nat Commun 4: 1464. [DOI] [PMC free article] [PubMed] [Google Scholar]
- Young DW, Hassan MQ, Pratap J, Galindo M, Zaidi SK, Lee SH, Yang X, Xie R, Javed A, Underwood JM, et al. 2007. Mitotic occupancy and lineage-specific transcriptional control of rRNA genes by Runx2. Nature 445: 442–446. [DOI] [PubMed] [Google Scholar]
- Zaidi SK, Young DW, Pockwinse SM, Javed A, Lian JB, Stein JL, van Wijnen AJ, Stein GS. 2003. Mitotic partitioning and selective reorganization of tissue-specific transcription factors in progeny cells. Proc Natl Acad Sci 100: 14852–14857. [DOI] [PMC free article] [PubMed] [Google Scholar]
- Zhang Y, Liu T, Meyer CA, Eeckhoute J, Johnson DS, Bernstein BE, Nusbaum C, Myers RM, Brown M, Li W, et al. 2008. Model-based analysis of ChIP-seq (MACS). Genome Biol 9: R137. [DOI] [PMC free article] [PubMed] [Google Scholar]
- Zhao R, Nakamura T, Fu Y, Lazar Z, Spector DL. 2011. Gene bookmarking accelerates the kinetics of post-mitotic transcriptional re-activation. Nat Cell Biol 13: 1295–1304. [DOI] [PMC free article] [PubMed] [Google Scholar]
Associated Data
This section collects any data citations, data availability statements, or supplementary materials included in this article.