Abstract
In the present study, restructured products were prepared from pangasius surimi and their qualities were analysed under chilled storage. Pangasius surimi had 75.82 % moisture, 16.91 % protein, 2.76 % fat and 0.95 % ash. Restructured products were prepared in three different formulations by incorporating corn starch (10 %) and chitosan (0.75 %). Formulation containing only corn starch (10 %) was served as control. In all the formulations, mono unsaturated fatty acids were higher (45.14 %). The total volatile base nitrogen (TVB-N) showed an increasing trend and it was found to be higher in control (4.8 mg/100 g) on 10th day than the chitosan incorporated sample (3.5–4.2 mg/100 g) on 17th day during chill storage. Similarly, peroxide value (PV) was found to higher (8.85 milliequivalent of O2/kg) in control than the chitosan incorporated sample (4.5–6.8 milliequivalent of O2/kg) on 10th day. All the three formulations had an acceptable level of thiobarbituric acid (TBA) value that ranged between 0.023–0.098 mg of malanoldehyde/kg during chilled storage. Based on the sensory and microbiological analysis, products prepared without chitosan had a shelf life of 10 day whereas, products incorporated with chitosan had an extended shelf life of 17 day.
Keywords: Restructured products, Surimi, Chitosan, Shelf life, Quality
Introduction
Seafood products have attracted considerable attention as a source rich in important nutritional components to the human diet. In India, unlike marine fish, fresh water fish are wholly marketed for consumption in fresh condition, irrespective of the quantity caught. Pangasius (Pangasianodon hypophthalmus) or basa catfish is one of world’s fastest growing types of aquaculture species. Having good demand in the international market, a large number of Indian farmers got interested in culturing pangasius fish. It is mostly sold in fresh and frozen or thawed fillets in seafood markets. But, the export of this fish from India has suffered a setback due to the yellow discolouration of fillets, leading to price crash in market. Therefore, the conversion of meat to restructured fish products may serve as an effective solution to this problem (Sarika et al. 2015; Majumdar et al. 2015). Surimi is the Japanese term for myofibrillar protein and it is defined as mechanically de-boned, washed and cryostabilized fish paste. It is used for the production of seafood analogues and other new products. Traditionally, surimi is made from the muscles of white fish species like Alaska pollock (Theragra chalcograma) or Pacific whiting (Merluccius productus). There are a number of other species also that are now utilized for commercial surimi processing, whose functional and compositional properties vary depending on the species used. Phosphate is normally added to surimi in combination with cryoprotectants such as sugar or sorbitol to preserve the biological activity of proteins in surimi during frozen storage (Park and Lin 2004). Both low value species and filleting remains can be transformed into high-value products by surimi technology and restructuring technology. These technologies are used to obtain novel products using an array of additives to improve the mechanical and functional properties. The restructuring process allows the acquisition of products with high commercial value. This process implies the milling of fish muscle, solubilisation of fish proteins with salt, formatting of fish paste and induction of the gelling phenomenon, usually by heat. Food hydrocolloids have been proposed to improve the mechanical and functional properties of surimi and restructured fish gel. Chitosan (β-(1,4)-2- amino-2-deoxy-D-glucopyranose), the deacetylated form of chitin has been reported to have a number of functional properties that make it technically and physiologically useful as a kind of dietary fibre (Borderias et al. 2005). Currently, chitosan and chitosan derivatives are getting interest in food science due to its special functional characteristics, such as antioxidative activity and antimicrobial ability (Mohan et al. 2012; Niladri et al. 2015; Georgantelis et al. 2007). Based on the above information, a study was taken up to prepare restructured products from pangasius surimi with the inclusion of chitosan and to study their quality and shelf life under chilled storage.
Materials and methods
Raw materials and reagents
Pangasius (Pangasianodon hypophthalmus) fishes were procured from Aquafarm at kodungalloor, Cochin, India. They were kept in an insulated box in iced condition (1:1 fish to ice ratio) and brought to the fish processing division laboratory, CIFT, Cochin for further analysis. Chitosan was prepared from the shell of Metapenaeus dobsoni following the method of Nair and Madhavan (1974). Degree of deacetylation of the chitosan was determined following the method of Shigemassa et al. (1996). All chemicals and glasswares used for the study were analytical grade.
Preparation of restructured products
Fishes were dressed, filleted and deskinned manually and cleaned using potable water. Fillets were minced in a mincer (SIRMAN, India) and the mince was washed with cold water (5 °C) at the ratio of 1:3 (mince:water). The mixture was stirred gently for 3 min and the washed mince was filtered using a nylon screen. The washing process was carried out thrice and the final washing was done with 0.2 % sodium bicarbonate to remove fat from the mince. The upper layer of fat and aqueous supernatant was discarded from the fish meat concentrate during every washing. The final dewatering of fish mince was carried out by manually pressing the washed mince in fine meshed nylon cloth cover tied at both ends until the mince begin to force out through the fine mesh. Washed and pressed mince, referred to as surimi was mixed thoroughly with 0.25 % sodium tripolyphosphate (STPP), 4 % sorbitol and 4 % sucrose. This was used as raw material for the preparation of restructured product.
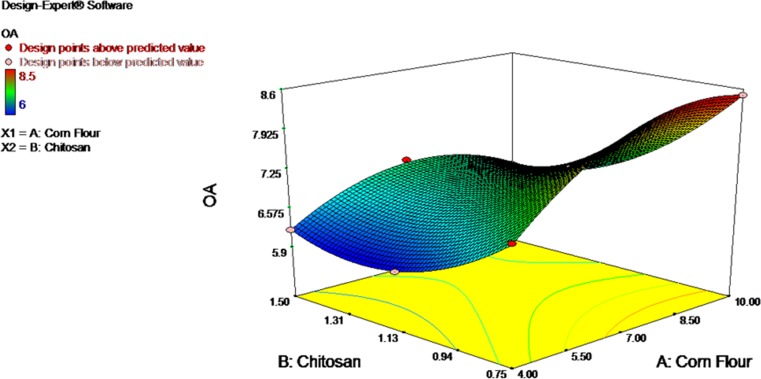
In order to find out the suitable concentration of corn starch and chitosan for the preparation of restructured products, ten formulations were made (Table 1) and the optimized composition was selected based on sensory evaluation. Among the ten formulations, sample contained 10 % corn starch and 0.75 % chitosan showed scored higher for overall acceptability (Fig. 1) and it was selected for the further study. Composition of optimised ingredients used for the study is given in Table 2. Before preparation of products, chitosan was pre dissolved in known volume of 1 % acetic acid solution until gets clear gel and it was added to surimi. Ingredients were mixed in a silent cutter (SCHARFEN, Germany) for proper mixing and kept under refrigerated condition (2–3 °C) for 20 min for even setting. It was then moulded by filling in a petridish (Diameter*height: 50*17 mm) which was previously smeared with little oil (to avoid sticking) and steam cooked with lid for 30 min. After cooking, the products were removed from the petridish and cooled. Then, it was packed in polypropylene pouches and stored in chilled condition (2 °C). Products prepared without chitosan was coded as PSI (control). PSII and PSIII code was given for was chitosan incorporated samples. Samples were drawn at regular intervals for quality analysis.
Table 1.
Experimental design used for optimization of ingredients for developing restructured products
| Treatment | Surimi (g) | Salt (g) | Corn starch (g) | Chitosan (g) |
|---|---|---|---|---|
| T1 | 100 | 1 | 7 | 0.94 |
| T2 | 100 | 1 | 4 | 0.75 |
| T3 | 100 | 1 | 10 | 0.75 |
| T4 | 100 | 1 | 4 | 0.75 |
| T5 | 100 | 1 | 10 | 0.75 |
| T6 | 100 | 1 | 7 | 1.5 |
| T7 | 100 | 1 | 10 | 1.13 |
| T8 | 100 | 1 | 4 | 1.5 |
| T 9 | 100 | 1 | 4 | 1.13 |
| T10 | 100 | 1 | 10 | 1.5 |
Fig. 1.
Over all acceptability of restructured products with different formulations
Table 2.
Composition of optimized ingredients for the preparation of restructured products
| Sample | Surimi (g) | Salt (g) | Corn starch (g) | Chitosan (g) |
|---|---|---|---|---|
| PSI | 100 | 1 | 10 | - |
| PSII | 100 | 1 | 10 | 0.75 |
| PSIII | 100 | 1 | - | 0.75 |
Biochemical analysis
Proximate composition was analyzed following the method of AOAC (2005). pH of homogenized samples were measured using a calibrated glass electrode pH meter (Cyberscan 510; Eutech Instruments, Singapore). Total volatile base nitrogen (TVB-N) was determined by Conway micro-diffusion method (Conway 1950). Free fatty acid (FFA) and peroxide values were evaluated according to AOAC (2005). Thiobarbituric acid (TBA) value was determined as described by Tarladgis et al. (1960).
Fatty acid composition analysis
Fatty acid composition was determined by the method of AOAC (2005). The total lipid was extracted from fish mince, surimi and restructured products by the method of Folch et al. (1957). The fatty acids present in the fish lipids were converted to fatty acid methyl esters (FAME) using BF3-methanol. Fatty acid composition analysis was performed using Gas Chromatograph (Varian, CP-3800) with a chrompack capillary column (25 m × 0.32 mm ID; 0.30 μm film thicknesses) and a flame ionization detector. Nitrogen gas was used as carrier gas at a constant flow rate of 1.2 ml/min. The oven temperature was programmed initially at 40 °C for 4 min and then increased at a rate of 4 °C per min to a final temperature of 250 °C. Total run time was 42 min. Fatty acids separated were identified by the separation of a mixture of standard fatty acid methyl esters (Sigma-Aldrich Co., St. Louis, MO, USA). The quantification of fatty acids were performed by comparing the relative peak area of each fatty acid methyl esters and was expressed as its percentage out of total area of the identified fatty acid methyl esters.
Colour ananlysis
Colour of restructured products were measured using a Hunter- Lab scan XE – Spectrocolorimeter (Hunter Associates Laboratory, Reston, USA.) at D-65 illuminant and 10° observer. Results were expressed by CIE (Commission Internationale de L ‘Eclairage’s) colour values [L*(lightness), a*(redness), b*(yellowness)]. The instrument was calibrated using white and black standard ceramic tiles and the readings were recorded in the inbuilt software.
Texture analysis
Texture Profile Analysis (TPA) was measured using texture analyser (Lloyd instruments LRX plus, UK) as described by Anderson et al. (1994). TPA was performed on restructured products, compressed twice by a cylindrical probe having a diameter of 50 mm and a test speed of 12 mm/min. Nexygen software was used for the tabulation of texture parameters.
Bacteriological analysis
A 25 g portion of sample was aseptically weighed and transferred to a sterile stomacher bag and 225 ml of sterile physiological saline (NaCl 0.85%w/v) was added and the mixture was homogenized using stomacher (Lab Blender 400, Seward Medical, UK). For the enumeration of total plate count, 0.5 ml of the serial dilution of homogenate was spread on Trypton Soya Agar (TSA oxoid, UK) and incubated at 37 °C for 2 days (FAO 1992). Enumeration of Enterobacteriaceae was performed on violet red bile glucose agar (VRBGA) and incubated at 30 °C for 24 h (Feng et al. 1998). For Escherichia coli, Tergitol-7 Agar (T-7 agar Himedia M616) was used and plates were incubated at 37 °C for 24 h (Feng et al. 1998). Staphylococcus aureus count was estimated on Baird Parker (BP Oxoid) incubated at 37 °C for 2 days (FAO 1992). Enterococi were estimated on KF Agar (Koutsoumanis and Nychas 1999).
Sensory analysis
For sensory analysis, restructured products were deep fried for 3 min after battering and breading. The sensory attributes evaluated were appearance, color, flavour, texture and over all acceptability. Sensory panel consisting of six trained panelists were asked to assign a score of 1–9 as prescribed by Meilgaard et al. (1999). The overall impression of the product on the assessor was estimated as overall acceptability, by adding the scores for all the attributes and dividing by the total number of attributes. A high score (7–9) was given to product with no off-odors and a score below 5 was considered as unacceptable quality.
Statistical analysis
D-optimal design with ten runs were used to generate the experimental data to optimize the ingredients for developing restructured products. Statistical software package Design-Expert (Version 7.1.5, State-Ease, Minneapolis, MN) was used to predict the response variable as a function of independent variables. The data obtained were analyzed by one way Analysis of variance (ANOVA) using Statistical Package for Social Science (SPSS) software version 16.0. (SPSS Inc., Chicago, Llinois, USA). All mean separations were carried out by Duncan multiple range test using the significance level of 95 % (P < 0.05).
Results and discussion
Properties of chitosan
The chitosan prepared in this study had 8.45 ± 32 % moisture, 0.82 ± 0.05 % protein and 0.86 ± 0.06 % ash. Colour of the chitosan showed the L*, a* and b* value of 77.43 ± 0.30, 1.96 ± 0.04, 18.81 ± 0.15 respectively. The degree of deacetylation, which is one of the important properties of the chitosan, deciding its application (Baxter et al. 1992), was found to be 90 %. These results indicate that the chitosan prepared from Indian white shrimp confirms to the standards of food grade chitosan (Dayong 2012).
Proximate composition
Proximate analysis provides information related to the moisture, protein, fat, and mineral content. Proximate composition of fish muscle is governed by many factors, including species, growth stage, feed size and season (Karakoltsidis et al. 1995). Pangasius surimi had 75.85 ± 0.25 % moisture, 16.91 ± 0.30 % protein, and 2.76 ± 0.15 % fat and 0.95 ± 0.05 % ash. The biochemical composition of pangasius surimi obtained from the study was comparable to the results observed by Debbarma and Majumdar (2013) for the surimi from pangasius. Proximate composition of restructured products had a range of 74.42 ± 0.52 to 76.33 ± 0.38 % moisture, 16.53 ± 0.25 to 17.42 ± 0.32 % protein, 2.60 ± 0.20 to 2.82 ± 0.25 % fat and 1.25 ± 0.22 to 1.52 ± 0.30 % ash.
Fatty acid composition
The fatty acid profile of total lipids extracted from pangasius fish meat was dominated by mono unsaturated fatty acids (48.57 %) followed by saturated fatty acid (34.85 %). Polyunsaturated fatty acids (PUFA) were present in very low percentage (16.45 %) in fish meat. Men et al. (2005) observed similar fatty acid profile for pangasius fish meat. It is well known, that the diet composition, in particular its lipid profile, has a quantitative and qualitative influence on the fatty acid composition of fish lipids. Pangasius surimi had 33.84 % saturated fatty acid (SAFA), 51.23 % monounsaturated fatty acids (MUFA) and 13.45 % polyunsaturated fatty acids (PUFA). Fatty acid profile revealed that, major fatty acids present in the pangasius surimi were C18:1 (37.15 %), C16:0 (21.74 %) and C18:2 (18.87 %). Rafiquel et al. (2012)) reported that the dominant fatty acid in pangasius mince were palmitic acid, oleic acid and steric acid. Restructured products prepared from surimi had 38.15 % SAFA, 45.14 % MUFA and 12.45 % PUFA. It was observed that there is no significant difference (P < 0.05) in fatty acid profile of restructured products between the treatments.
Changes in moisture, pH and total volatile base nitrogen (TVB-N)
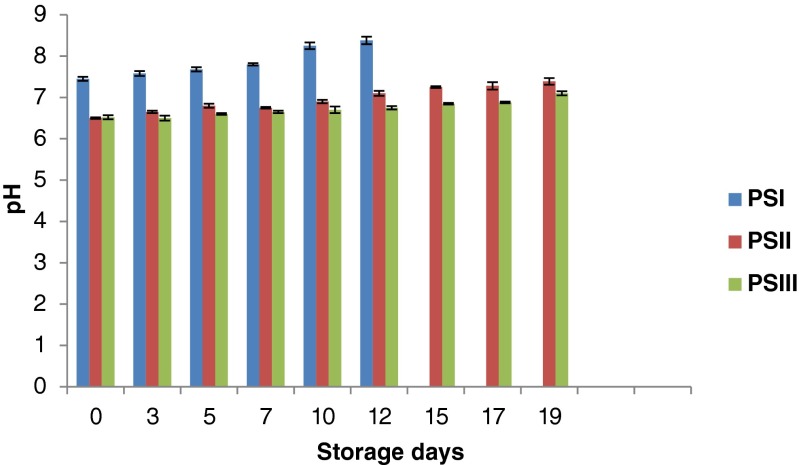
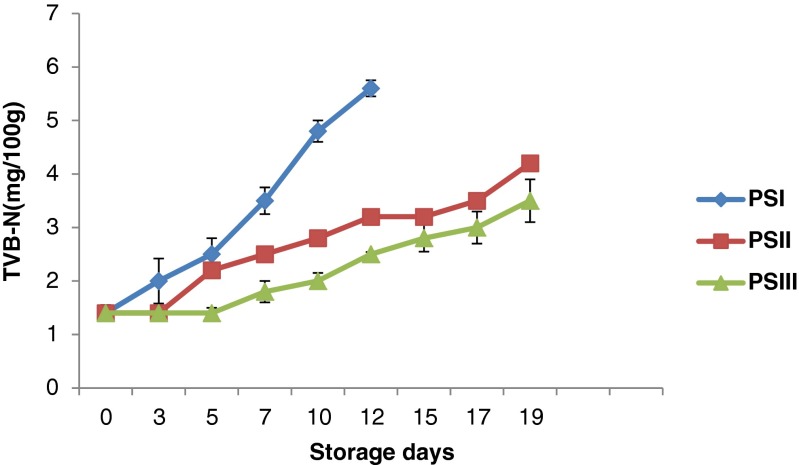
Initial moisture content of restructured surimi product viz., PSI, PSII and PSIII were 74.42 ± 0.52, 75.80 ± 0.20, 76.33 ± 0.38 % respectively. During chilled storage, a decrease in moisture content of PSI (74.42 ± 0.52 to 72.45 ± 0.30 %) and PSII (75.80 ± 0.20 to 73.45 ± %) was observed. However, PSIII showed an increasing trend (76.33 ± 0.38 to 79.05 ± %) during storage. It may be due to variations in the ingredient composition used for the product preparation. The pH of pangasius surimi was observed to be 7.5 and this slight alkalinity may be due to final washing of surimi with 0.2 % sodium carbonate. It was observed that the addition of chitosan (which is pre dissolved in 1 % acetic acid) to the surimi reduced the pH value from 7.5 to 6.47–6.48. pH value of all the products showed an increasing trend during storage (Fig. 2). The increase in pH may be due to action of endogenous or microbial enzymes such as protease and lipase that cause an increase in volatile bases (e.g., ammonia and trimethylamine) during prolonged storage (Viji et al. 2014). Similar results were observed for ready-to-cook chicken product containing chitosan and essential oil (Giatrakou et al. 2010). It was observed that pH increase was less in PSII (6.5 to 7.39) and PSIII (6.52 to 7.10) than PSI (7.45 to 8.38). It may be due to the incorporation of chitosan in the former two samples. Total volatile base nitrogen (TVB-N) is often used as an indicator for seafood quality and deterioration. In the present study, TVB-N showed an increasing trend and was found to be higher (5.6 mg/100 g) in control than the chitosan incorporated samples (3.5 and 4.2 mg/100 g) during storage (Fig. 3). TVB-N increase is related to the activity of spoilage bacteria and endogenous enzymes because enzymes are still active. A TVB-N level of 30 mg/100 g is considered as the upper limit above which fishery products are considered spoiled and unfit for human consumption (Harpaz et al. 2003). In the present study, none of the samples reached the rejection limit during chilled storage. Fan et al. (2009) reported that the slow increase of the TVB-N values of samples might be on account of the chitosan incorporation to the products resulting in a faster reduction of the bacterial population and a decreased capacity of bacteria for oxidative deamination of non-protein nitrogen compounds.
Fig. 2.
Changes in pH of restructured products during storage
Fig. 3.
Changes in total volatile base nitrogen (TVB-N) content of restructured products during storage
Changes in free fatty acid (FFA)
Besides oxidation, lipids may undergo hydrolysis resulting in the formation of FFA during chilled storage. Accumulation of FFA is responsible for the textural changes, enhanced oxidation of lipids, and development of off flavors in the muscle food (Sequeira-Munoz et al. 2006). As the storage progressed, FFA showed an increasing trend from 0.31 % to 1.20 % in the restructured surimi products. However, PSI showed higher FFA value (0.45 to 1.20 % oleic acid) than PSII (0.43 to 0.95 %) and PSIII (0.31 to 0.85 %) indicating effectiveness of chitosan in reducing lipid deterioration. Mohan et al. (2012) reported that antioxidant properties of chitosan could reduce lipid deterioration in the chitosan coated sardine fillet.
Changes in peroxide value (PV)
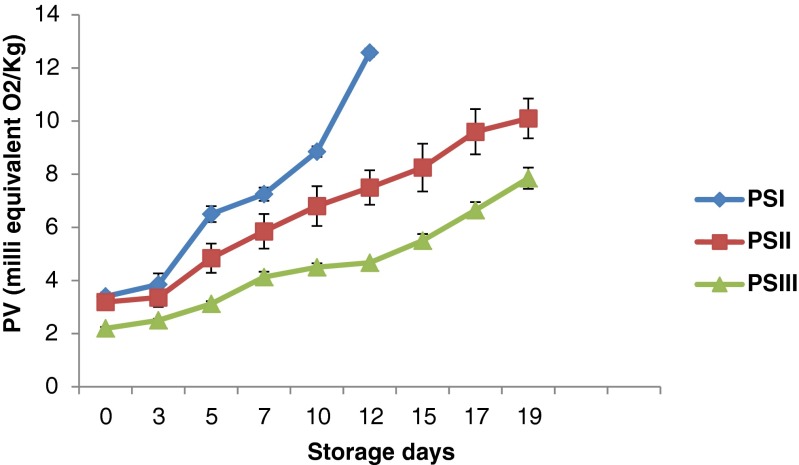
Peroxides are the primary products of lipid oxidation and play a central role in auto oxidation of lipids and decompose them into carbonyls and other compounds. In the present study, peroxide value showed a gradual increase in the control and chitosan incorporated samples. Initial PV was found to be 3.40 meq O2/kg and it increased to 12.58 meq O2/kg on 12th day for PSI (Control). However, PS II and PSIII showed a PV value of 10.10 meq O2/kg, 7.85 meq O2/kg respectively on 19th day (Fig. 4). There was significant difference (p < 0.05) in PV of chitosan incorporated samples and control. Results indicated that the PV of restructured products (PSII and PSIII) during chilled storage was within the standard specification value of 10 meqO2/kg accepted for oils and fats (Romeu-Nadal et al. 2006). Shahidi et al. (1999) reported that chitosan may retard lipid oxidation by chelating ferrous ions present in the system, thus eliminating their peroxidant activity or their conversion to ferric ion. Georgantelis et al. (2007) observed that 1 % chitosan, individually or in combination with other natural antioxidants, was more effective in decreasing lipid oxidation in frozen beef patties.
Fig. 4.
Changes in peroxide value (PV) of restructured products during storage
Changes in thiobarbituric acid (TBA) value
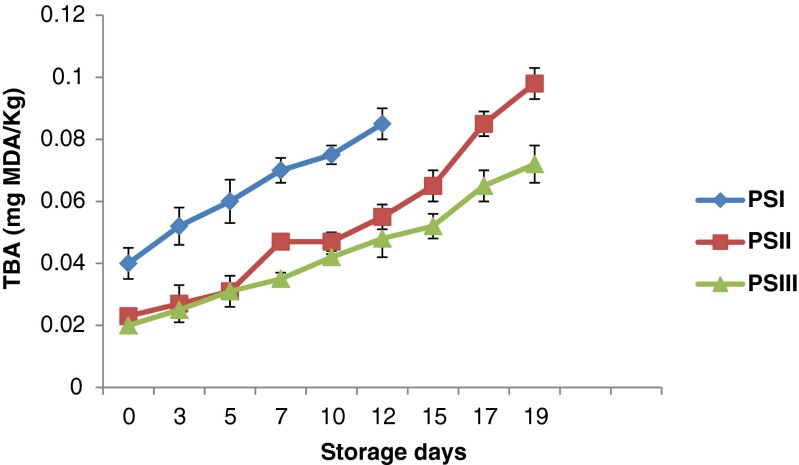
Thiobarbituric acid is used as an indicator to determine the degradation of products of lipid hydroperoxides formed during lipid oxidation. A significant increase of thiobarbituric acid value in control and treated samples were observed throughout the storage. Initially TBA value was found to be 0.040 mg malanoldehyde/kg and it increased to 0.085 mg of malanoldehyde/kg on 12th day for PSI sample. However, PSII and PSIII had a TBA value of 0.098 meq O2/kg and 0.072 meq O2/kg respectively on 19thday (Fig. 5). Thus, results showed that chitosan treated samples (PSII, PSIII) had lower TBARS value than control. TBA value of 1–2 mg malonaldehyde/kg of fish meat is regarded as the limit beyond which fish will develop an unpleasant odour and taste and hence in the present study, none of the samples reached the rejection limit even on 19th day of chilled storage (Fan et al. 2014). Shahidi et al. (1999) explained that chitosan would chelate the free ions, which are released from hemoproteins during heat processing or storage, and thus inhibit the lipid oxidation of products. Darmadji and Izumimoto (1994) reported that the addition of 1 % chitosan resulted in a 70 % reduction of the TBARS values in beef after storage at 4 °C for 3 days.
Fig. 5.
Changes in thiobarbituric acid value (TBA) of restructured products during storage
Changes in colour
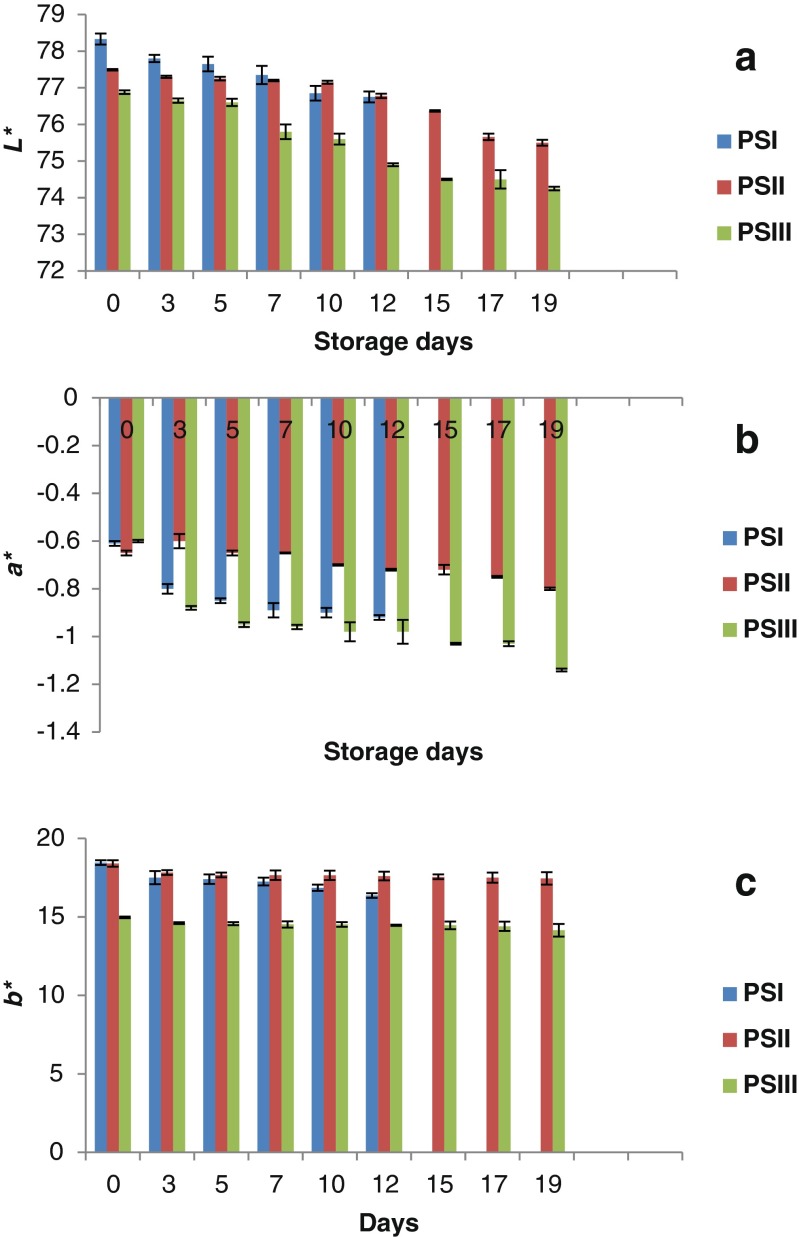
Color is one of the most important parameters by which consumers evaluate product quality and is also associated with freshness, flavour, and quality of a product (Wu and Sun 2013). Color values (L*a*b*) of restructured surimi products are shown in Fig. 6. Lightness value (L*) was initially different for all the three samples with PSI showing higher L* value (78.33) than PSII (77.09) and PSIII (76.88). As the storage progressed, both L* and b* (yellowness) values of all the samples decreased. It was observed that a* showed negative value (greenness) and increased throughout the storage period. Darmadji and Izumimoto (1994) also observed similar results for chitosan-added sausage during chilled storage.
Fig. 6.
Changes in colour value of A) L* B) a* C) b* restructured products during storage
Changes in texture
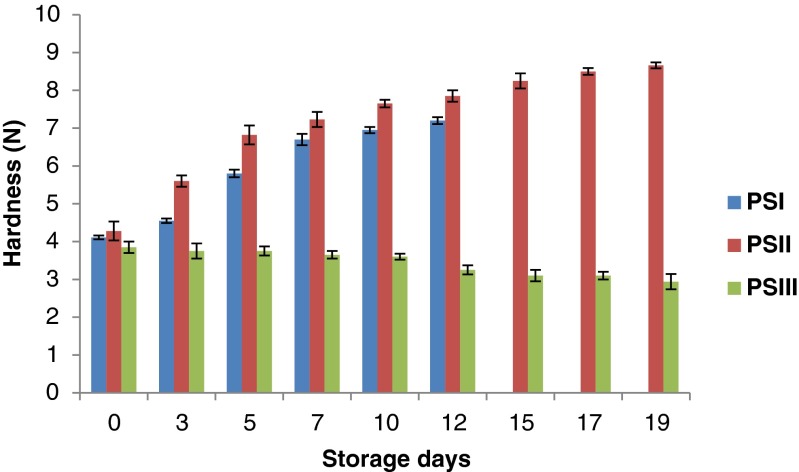
Texture is one of the most important sensory attributes and is directly related to the fat and water-holding capacities of the meat matrix, which in turn, are influenced by the ionic strength and functional properties of the proteins. In the present study, PSI and PSII samples showed increasing trend in hardness during storage (Fig. 7) with PSII showing more increase (4.28 N to 8.66 N) than PSI (4.11 N to 7.20 N). Bonds between chitosan and myofibrillar proteins could be associated with improving texture properties in gels with the final structure formed by both covalent and non-covalent interactions (Mao and Wu 2007). Horita et al. (2011) reported that in emulsified meat products, the increase in the hardness is attributed to the reduction of bound water in the batter during cooking. However, PSIII showed a decrease in hardness (3.85 N to 2.94 N) during storage. It may be due to the proteolysis caused by endogenous and microbial enzymes (Viji et al. 2014) and also it may due to the influence of sample composition in the product.
Fig. 7.
: Changes in hardness (N) of restructured products during storage
Microbiological quality of restructured products
The initial total aerobic plate count was lower in PSII and PSIII samples (2.4 log cfu/g and 2.9 log cfu/g 102) and the highest in PSI (3.2 logcfu/102 cfu/g). The antimicrobial effect of chitosan is thought to be related to electrostatic interaction between a positive charge on the NH3+ group of glucosamine monomer in chitosan molecules and negative charge of microbial cell membrane that leads to the leakage of intracellular constituents (Dutta et al. 2009). Total viable counts increased gradually (P < 0.05) in all samples during storage. A 5 log cfu/g is considered as acceptable limit for restructured product (Gilbert et al. 2000) and it was observed that up to 7th day total bacterial count was between 3.02 logcfu/g and 3.5 logcfu/g in the restructured products. On day 10, PSI had total bacterial count of 5.29 logcfu/g reaching rejection level. However PSII and PSIII attained 5.1 logcfu/g only towards 17th day leading to rejection. These results were in agreement with results reported by Georgantelis et al. (2007) who found that treatment with chitosan at a concentration of 0.3–0.6 % and 1 % respectively, increased the shelf-life of fresh pork sausages stored at chill temperatures from 7 to 15 days. Further it was observed that Enterobacteriaceae, E. coli, Staphylococcus aureus and enterococci count were found to be nil in the entire samples (PSI, PSII and PSIII) throughout the storage period. Different mechanisms have been described for the antimicrobial effects of chitosan. Cuero et al. (1991)) reported that chitosan acts as a chelating agent that selectively binds trace metals and thereby inhibiting the production of toxins and microbial growth.
Changes in over all acceptability
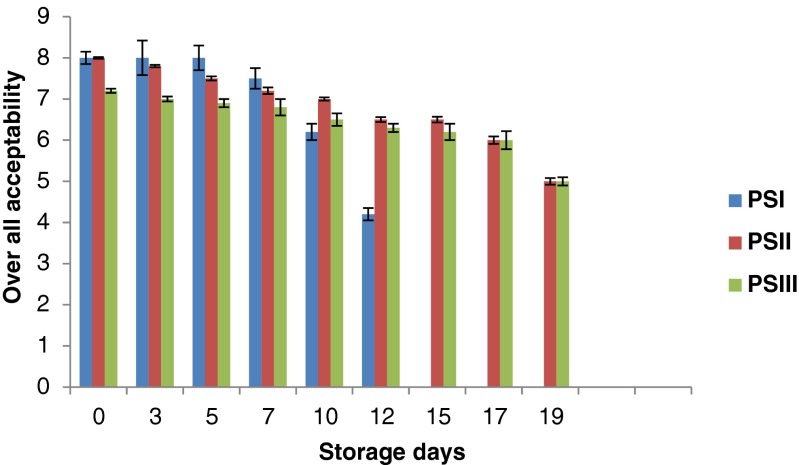
The sensory quality of novel food systems needs to be evaluated with the aim of predicting the applicability of the compound in terms of consumer acceptance. In the present study, the sensory qualities of restructured products were evaluated with respect to its appearance, color, odor, flavor, texture and overall acceptability. Sensory evaluation showed higher score for over all acceptability in all samples up to 7th day. There was decreasing trend in overall acceptability after 7th day (Fig. 8). This may be due to formation of some volatile low molecular weight compounds, lipid oxidation and protein degradation during storage (Pawar 2011). However, the deterioration was slow for chitosan-incorporated samples compared to untreated control. Chitosan incorporation showed a significant effect on all the attributes (P < 0.05). Products prepared without chitosan (PSI) were rejected on 12th day due to the development of off odour. However products prepared with chitosan was rejected on 19th day (PSII & PSIII) due to off odour and total bacterial count exceeded the acceptable limit (6.3 log cfu/g). Results from the present study were in agreement with the results reported by Mohan et al. (2012) for chitosan coated sardine fillets.
Fig. 8.
Changes in over all acceptability of restructured products during storage
Conclusions
Restructured products prepared from pangasius surimi with the incorporation of chitosan resulted in reduced increase of TVB-N, FFA, PV, TBA and microbial count of the product during chilled storage. Sensory acceptability, texture and colour attributes were higher for chitosan - corn flour incorporated products. A shelf life of 17 days was observed for 0.75 % chitosan incorporated samples compared to control (10 days). The study showed that chitosan (0.75 %) can be used effectively to extend the shelf life of restructured fish products under chilled storage. Results from the study indicated that chitosan could be used as a natural ingredient to prevent lipid oxidation in surimi based food systems for the development of novel healthy fish products and also addresses consumer demands for functional fish products. However, further investigations are required to determine the factors responsible for changes in textural properties of the products during chilled storage and also to compare the activity with chitosan derivatives in the fish products.
Acknowledgment
The authors wish to thank Dr. C.N. Ravishankar, Director, CIFT, Cochin for his encouragement and for providing required facilities to carry out this study.
References
- Anderson UB, Stomsnes AN, Thomassen MS, Steinsholt K. Fillet gaping in farmed Atlantic salmon. Norwegian J Agric Sci. 1994;8:165–179. [Google Scholar]
- AOAC . Official methods of analysis. 17th. Washington, DC: Association of Analytical Chemists; 2005. [Google Scholar]
- BAM (2002) Enumeration of Escherichia coli and the Coliform Bacteria. In: bacteriological analytical manual, Chapter 4; United States Food and Drug Administration
- Baxter A, Dillon M, Taylor KDA, Roberts GAF. Improved method for I.R. determination of the degree of N-acetylation of chitosan. Int J Biol Macromol. 1992;14(3):166–169. doi: 10.1016/S0141-8130(05)80007-8. [DOI] [PubMed] [Google Scholar]
- Borderias AJ, Sanchez IA, Perez-Mateos M. New applications of fibres in foods: addition to fishery products. Trend Food Sci Technol. 2005;16:458–465. doi: 10.1016/j.tifs.2005.03.011. [DOI] [Google Scholar]
- Conway E J (1950) Micro-diffusion analysis and volumetric error. 5th edn. Lockwood and Son Ltd, London. 467–472
- Cuero RG, Osuji G, Washington A. N-carboxymethyl chitosan inhibition of aflatoxin production: role of zinc. J Biotechnol Lett. 1991;13:441–444. doi: 10.1007/BF01030998. [DOI] [Google Scholar]
- Darmadji P, Izumimoto M. Effect of chitosan in meat preservation. Meat Sci. 1994;38(2):243–254. doi: 10.1016/0309-1740(94)90114-7. [DOI] [PubMed] [Google Scholar]
- Dayong T. From chitin to chitosan. In: Kangde Y, Junjie L, Fanglian Y, Yuji Y, editors. Chitosan based hydrogels: functions and applications. Boca Raton FL: Taylor and Francis Group; 2012. pp. 1–39. [Google Scholar]
- Debbarma S, Majumdar RK. Biochemical and organoleptic changes of surimi from the Thai pangas (pangasianodon hypophthalmus) during frozen storage. Indian J Fish. 2013;60(4):99–106. [Google Scholar]
- Dutta PK, Tripathi S, Mehrotra GK, Dutta J. Perspectives for chitosan based antimicrobial films in food applications. Food Chem. 2009;114:1173–1182. doi: 10.1016/j.foodchem.2008.11.047. [DOI] [Google Scholar]
- Fan W, Sun J, Chen Y, Qiu J, Zhang Y, Chi Y. Effects of chitosan coating on quality and shelf life of silver carp during frozen storage. Food Chem. 2009;115:66–70. doi: 10.1016/j.foodchem.2008.11.060. [DOI] [Google Scholar]
- Fan WJ, Zhang YK, Chen YC, Sun JX, Yi YW. TBARS predictive models of pork sausages stored at different temperatures. Meat Sci. 2014;96:1–4. doi: 10.1016/j.meatsci.2013.06.025. [DOI] [PubMed] [Google Scholar]
- FAO (1992) Manual of food quality control, 4. Rev.1. Microbial analysis. FAO Food and Nutrition paper. Food and Agriculture Organization of the United Nations, Rome. [PubMed]
- Feng P, Weagant S D, Grant M A, Burkhardt (1998) Enumeration of Escherichia coli and the Coliform Bacteria. In: I M Robert (ed) Bacteriological analytical manual, 8th edn. Revision A, Office of special research skills, CFSAN, FDA
- Folch J, Lees M, Sloane-stanley GH. Simple method for purification and isolation of lipid (total) from animal tissue. J Biol Chem. 1957;225:492. [PubMed] [Google Scholar]
- Georgantelis D, Ambrosiadis I, Katikou P, Blekas G, Georgakis SA. Effect of rosemary extract, chitosan and a-tocopherol on microbiological parameters and lipid oxidation of fresh pork sausages stored at 4 C. Meat Sci. 2007;76:172–181. doi: 10.1016/j.meatsci.2006.10.026. [DOI] [PubMed] [Google Scholar]
- Giatrakou V, Ntzimani A, Savvaidis I. Combined chitosan-thyme treatments with modified atmosphere packaging on a ready-to-cook poultry product. J Food Protect. 2010;73(4):663–669. doi: 10.4315/0362-028x-73.4.663. [DOI] [PubMed] [Google Scholar]
- Gilbert RJ, Louvois J, Donovan T, Little C, Nye K, Ribeiro CD, Richards J, Roberts D, Bolton FJ. Guidelines for the microbiological quality of some ready-to-eat foods sampled at the point of sale. Commun Dis Public Health. 2000;3(3):163–167. [PubMed] [Google Scholar]
- Harpaz S, Glatman L, Drabkin V, Gelman A. Effects of herbal essential oils used to extend the shelf life of freshwater-reared Asian sea bass fish (Lates calcarifer) J Food Protect. 2003;66(3):410–417. doi: 10.4315/0362-028x-66.3.410. [DOI] [PubMed] [Google Scholar]
- Horita CN, Morgano MA, Celeghini RMS, Pollonio MAR. Physicochemical and sensory properties of reduced-fat mortadella prepared with blends of calcium, magnesium and potassium chloride as partial substitutes for sodium chloride. Meat Sci. 2011;89(4):426–433. doi: 10.1016/j.meatsci.2011.05.010. [DOI] [PubMed] [Google Scholar]
- Karakoltsidis PA, Zotos A, Constantinides SM. Composition of the commercially important Mediterranean finfish, crustaceans and molluscs. J Food Compost Anal. 1995;8:258–273. doi: 10.1006/jfca.1995.1019. [DOI] [Google Scholar]
- Koutsoumanis GK, Nychas JE. Chemical and sensory changes associated with microbial flora of Mediterranean bogue (Boops boops) stored aerobically at 0, 3, 7, and 10 °C. Appl Environ Microbiol. 1999;65:698–706. doi: 10.1128/aem.65.2.698-706.1999. [DOI] [PMC free article] [PubMed] [Google Scholar]
- Majumdar RK, Apurba S, Dhar B, Maurya PK, Deepayan R, Snehal S, Balange AK. Effect of garlic extract on physical, oxidative and microbial changes during refrigerated storage of restructured product from Thai pangas (pangasianodon hypophthalmus) surimi. J Food Sci Technol. 2015;52(12):7994–8003. doi: 10.1007/s13197-015-1952-7. [DOI] [PMC free article] [PubMed] [Google Scholar]
- Mao L, Wu T. Gelling properties and lipid oxidation of kamaboko gels from grass carp (ctenopharyngodon idellus) influenced by chitosan. J. Food Eng. 2007;82:128–134. doi: 10.1016/j.jfoodeng.2007.01.015. [DOI] [Google Scholar]
- Meilgaard M, Civille G V, Carr B T (1999) Sensory evaluation techniques (3rd ed.). Boca Raton, Fla: CRC Press. p. 387
- Men LT, Thanh VC, Hirata Y, Yamasaki S. Evaluation of the genetic diversities and the nutritional values of the Tra (Pangasius hypophthalmus) and the basa (Pangasius bocourti) catfish cultivated in the Mekong river delta of Vietnam. Asian–Austral J Anim Sci. 2005;18:671–676. [Google Scholar]
- Mohan CO, Ravishankar CN, Lalitha KV, Gopal STK. Effect of chitosan edible coating on the quality of double filleted Indian oil sardine (Sardinella longiceps) during chilled storage. Food Hydrocoll. 2012;26:167–174. doi: 10.1016/j.foodhyd.2011.05.005. [DOI] [Google Scholar]
- Nair KGR, Madhavan P. Utilization of prawn waste-isolation of chitin and its conversion to chitosan. Fish Technol. 1974;11(1):60. [Google Scholar]
- Niladri SC, Panda SK, Navitha M, Asha KK, Anandan R, Suseela M. Vanillic acid and coumaric acid grafted chitosan derivatives: improved grafting ratio and potential application in functional food. J Food Sci Technol. 2015;52(11):7153–7162. doi: 10.1007/s13197-015-1874-4. [DOI] [Google Scholar]
- Park JW, Lin TNJ. Surimi: manufacturing and evaluation. In: Park JW, editor. Surimi and surimi seafood. New York, USA: Taylor and Francis; 2004. [Google Scholar]
- Pawar PP (2011) Preparation of battered and breaded product from freshwater fish (Catla catla). M.F.Sc thesis., Konkan Krishi Vidyapeeth, Dapoli, Maharashtra state, India, 2011
- Rafiquel I, Paul DK, Rahman A, Parvin T, Islam D, Sattar A. Comparative characterization of lipids and nutrient contents of Pangasius pangasius and Pangasius sutchi available in Bangladesh. J Nutr Food Sci. 2012;2:130. [Google Scholar]
- Romeu-nadal M, Chavez-servin JL, Castellote AI, Riveron M, Lopez-Sabater MC. Oxidation stability of the lipid fraction in milk powder formulas. Food Chem. 2006;100(2):756–763. doi: 10.1016/j.foodchem.2005.10.037. [DOI] [Google Scholar]
- Sarika K, Manjusha L, Chouksey MK, Nagalakshmi K, Venkateshwarlu G. Textural quality and oxidative stability of restructured pangasius mince: effect of protein substrates mediated by transglutaminase. J Food Sci Technol. 2015;52(1):351–358. doi: 10.1007/s13197-013-1000-4. [DOI] [Google Scholar]
- Sequeira-Munoz AS, Chevalier D, LeBail A, Ramaswamy HS, Simpson BK. Physicochemical changes induced in carp (Cyprinus carpio) fillets by high pressure processing at low temperature. Innov Food Sci Emerg Technol. 2006;7:13–18. doi: 10.1016/j.ifset.2005.06.006. [DOI] [Google Scholar]
- Shahidi F, J K V A, Jeon YJ. Food applications of chitin and chitosans. Trends Food Sci Technol. 1999;10:37–51. doi: 10.1016/S0924-2244(99)00017-5. [DOI] [Google Scholar]
- Shigemassa Y, Matsuura H, Sashiwa H. Evaluation of different ratios from infrared spectroscopy for analysing the degree of acetylation in chitin. Int J of Biol Macromol. 1996;18:237–242. doi: 10.1016/0141-8130(95)01079-3. [DOI] [PubMed] [Google Scholar]
- Tarladgis GB, Watts MB, Younathan TMA. Distillation method for the quantitative determination of malonaldehyde in rancid foods. J Am Oil Chem Soc. 1960;37:44–50. doi: 10.1007/BF02630824. [DOI] [Google Scholar]
- Viji P, Tanuja S, Ninan G, A A Z, Lalitha KV. Quality characteristics and shelf life of sutchi cat fish (pangasianodon hypophthalmus) steaks during refrigerated storage. Int J Agric Food Sci Technol. 2014;5(2):105–116. [Google Scholar]
- Wu D, Sun DW. Colour measurements by computer vision for food quality control. A review. Trends Food Sci Technol. 2013;29:5–20. doi: 10.1016/j.tifs.2012.08.004. [DOI] [Google Scholar]


