Abstract
A positional isomer of 3′,5′-cAMP, 2′,3′-cAMP, is produced by kidneys in response to energy depletion, and renal 2′,3′-cyclic nucleotide 3′-phosphodiesterase (CNPase) metabolizes 2′,3′-cAMP to 2′-AMP; 2′,3′-cAMP is a potent opener of mitochondrial permeability transition pores (mPTPs), which can stimulate autophagy. Because autophagy protects against AKI, it is conceivable that inhibition of CNPase protects against ischemia-reperfusion (IR) –induced AKI. Therefore, we investigated renal outcomes, mitochondrial function, number, area, and autophagy in CNPase-knockout (CNPase−/−) versus wild-type (WT) mice using a unique two–kidney, hanging–weight model of renal bilateral IR (20 minutes of ischemia followed by 48 hours of reperfusion). Analysis of urinary purines showed attenuated metabolism of 2′,3′-cAMP to 2′-AMP in CNPase−/− mice. Neither genotype nor IR affected BP, heart rate, urine volume, or albumin excretion. In WT mice, renal IR reduced 14C-inulin clearance (index of GFR) and increased renal vascular resistance (measured by transit time nanoprobes) and urinary excretion of kidney injury molecule-1 and neutrophil gelatinase–associated lipocalin. IR did not affect these parameters in CNPase−/− mice. Histologic analysis revealed that IR induced severe damage in kidneys from WT mice, whereas histologic changes were minimal after IR in CNPase−/− mice. Measurements of renal cardiolipin levels, citrate synthase activity, rotenone–sensitive NADH oxidase activity, and proximal tubular mitochondrial and autophagosome area and number (by transmission electron microscopy) indicted accelerated autophagy/mitophagy in injured CNPase−/− mice. We conclude that CNPase deletion attenuates IR-induced AKI, in part by accelerating autophagy with targeted removal of damaged mitochondria.
Keywords: acute renal failure, cyclic AMP, ischemia-reperfusion, renal ischemia, electron microscopy, mitochondria
In response to energy depletion, rat1,2 and mouse3 kidneys produce 2′,3′-cAMP, a positional isomer of 3′,5′-cAMP that is generated when mRNA is enzymatically degraded.2 A study by Azarashvili et al.4 shows that 2′,3′-cAMP is a potent opener of mitochondrial permeability transition pores (mPTPs). Opening of mPTPs causes mitochondria damage,5 and mitochondrial damage is a stimulus for autophagy.6–8 Renal autophagy protects against AKI,9–16 and insufficient autophagy contributes to organ failure.17 Therefore, it is conceivable that 2′,3′-cAMP, by increasing autophagy, protects against AKI. Our recent studies identify 2′,3′-cyclic nucleotide 3′-phosphodiesterase (CNPase) as an important enzyme mediating the renal metabolism of 2′,3′-cAMP to 2′-AMP.18 Thus, it is conceivable that inhibition of CNPase augments renal autophagy and protects against ischemia-reperfusion (IR) –induced AKI. In this study, we test this hypothesis by comparing renal functional and structural outcomes, mitochondrial function, number and area, and autophagy in CNPase knockout (KO; CNPase−/−) versus wild-type (CNPase+/+) mice subjected to renal IR–induced AKI.
Results
Four groups of mice were studied: CNPase+/+ and CNPase−/− that were subjected to a sham IR procedure (sham CNPase+/+ and sham CNPase−/−, respectively) and CNPase+/+ and CNPase−/− that were subjected to the IR procedure (AKI CNPase+/+ and AKI CNPase−/−, respectively). Mean arterial BPs (MABPs) and heart rates (HRs) were normal, stable, and similar in sham CNPase+/+ (n=7), AKI CNPase+/+ (n=11), sham CNPase−/− (n=7), and AKI CNPase−/− (n=11) mice (MABP: 96±7, 97±4, 91±5, and 93±4 mmHg, respectively; HR: 589±18, 559±26, 587±23, and 535±14 beats per minute, respectively). Likewise, urine excretion rates were similar (6.0±0.9, 5.1±1.1, 7.0±1.5, and 6.0±0.8 µl/min, respectively) as were urinary albumin excretion rates (12.3±1.0, 11.3±2.5, 12.8±2.1, and 10.5±1.3 µg/h, respectively).
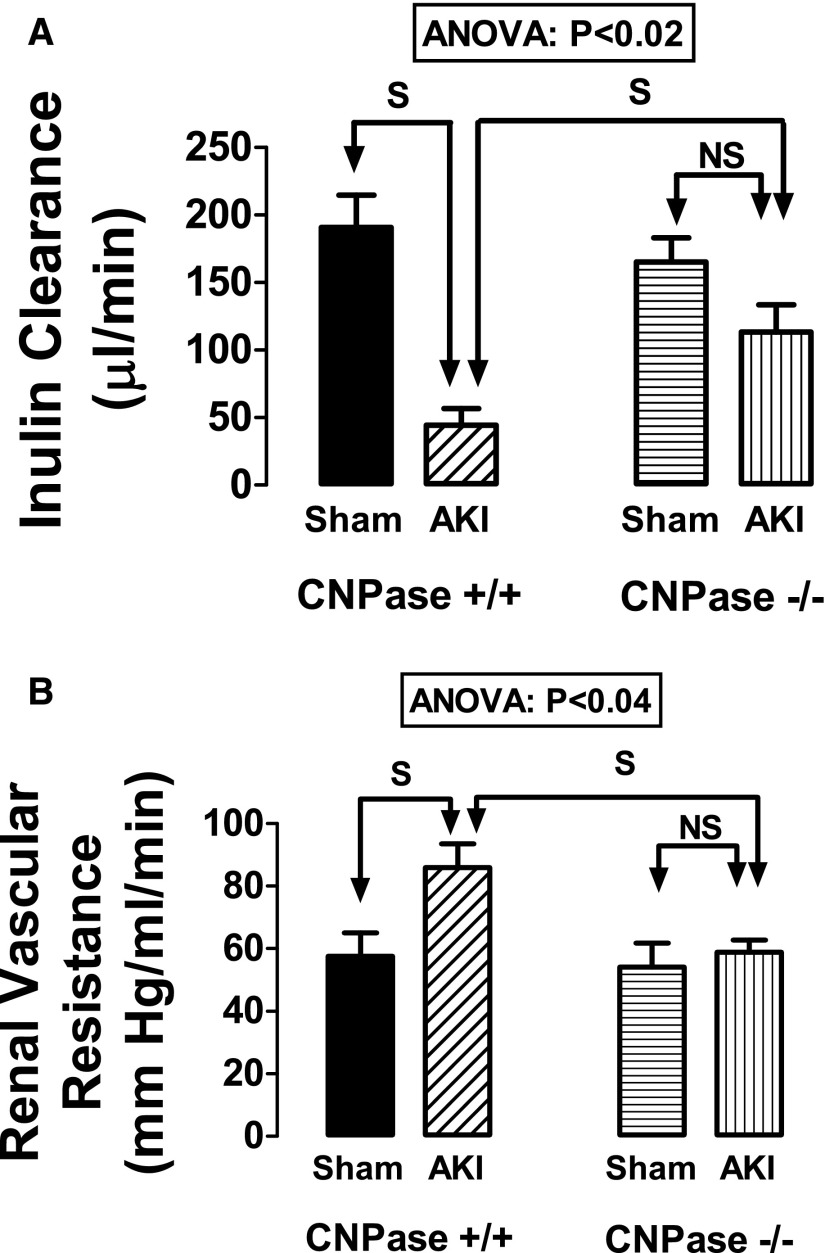
14C-inulin clearance (index of GFR) (Figure 1A) was obtained in all mice, and the effect of genotype in this regard was statistically significant (ANOVA; P<0.02). Predetermined contrasts showed that, although inulin clearances in uninjured CNPase+/+ versus CNPase−/− kidneys were similar, renal IR significantly reduced inulin clearances in CNPase+/+ but not CNPase−/− mice (Figure 1A). These findings indicate that knocking out CNPase protects kidneys against renal IR–induced reductions in GFR.
Figure 1.
Effects of IR injury–induced AKI on (A) inulin clearance and (B) RVR in CNPase+/+ and CNPase−/− mice. Sham indicates groups of mice (n=7 in A and n=7 in B) that received the same procedure as the AKI group (n=11 in A and n=7 in B), except that the kidneys were not subjected to ischemia. RBFs (milliliters per minute) in the groups were sham CNPase+/+, 1.86±0.26; AKI CNPase+/+, 1.23±0.12; sham CNPase−/−, 1.85±0.23; and AKI CNPase, 1.66±0.12. ANOVA indicates P value for effect of genotype on variable by two-factor ANOVA. S and NS indicate statistically significant and nonsignificant differences, respectively, by post hoc analysis. Values represent means and SEMs.
It was possible to place a Transonic nanoprobe on the renal arteries of seven mice in each of four groups to determine renal vascular resistance (RVR) (Figure 1B). The effect of genotype in this regard was statistically significant (ANOVA; P<0.04). Predetermined contrasts showed that renal IR significantly increased RVR in CNPase+/+ mice but not in CNPase−/− mice (Figure 1B). These findings indicate that knocking out CNPase protects kidneys against renal IR–induced renal vasoconstriction.
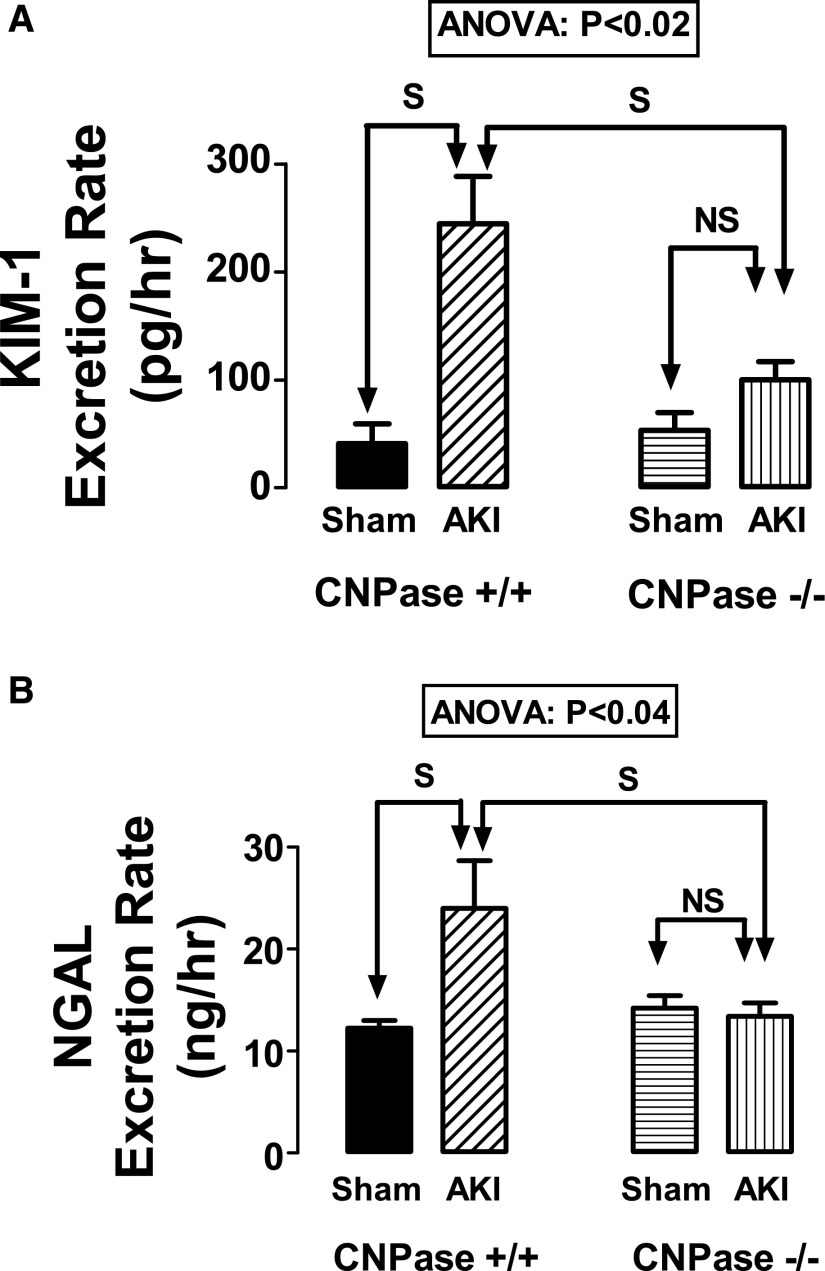
In CNPase+/+ mice, renal IR dramatically increased the urinary excretion rates of kidney injury molecule-1 (KIM-1) (Figure 2A) and neutrophil gelatinase–associated lipocalin (NGAL) (Figure 2B). These effects were significantly affected by genotype (KIM-1: ANOVA; P<0.02; NGAL: ANOVA; P<0.04). Predetermined specific contrasts showed that renal IR increased KIM-1 (Figure 2A) and NGAL (Figure 2B) in CNPase+/+ mice but not in CNPase−/− mice. These findings indicate that knocking out CNPase protects kidneys against renal IR–induced AKI.
Figure 2.
Effects of IR injury–induced AKI on (A) KIM-1 and (B) NGAL in CNPase+/+ and CNPase−/− mice. Sham indicates a group of mice (n=6–7) that received the same procedure as the AKI group (n=10–11), except that the kidneys were not subjected to ischemia. ANOVA indicates P value for effect of genotype on variable by two-factor ANOVA. S and NS indicate statistically significant and nonsignificant differences, respectively, by post hoc analysis. Values represent means and SEMs.
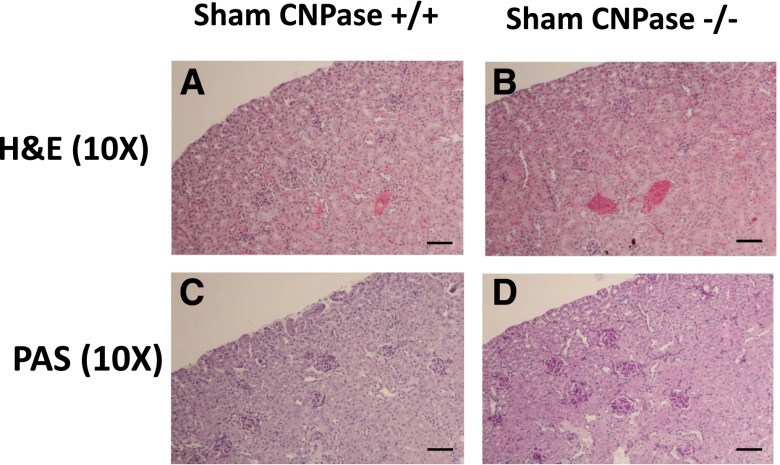
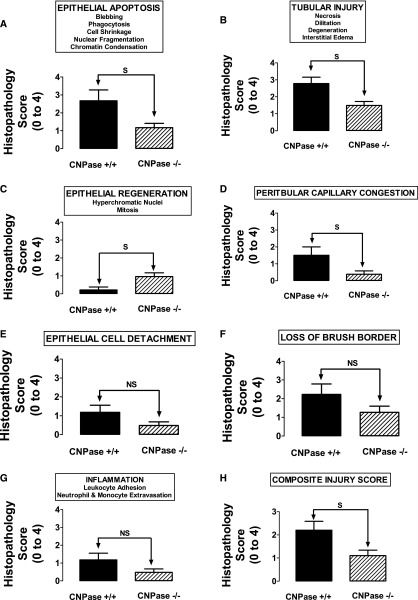
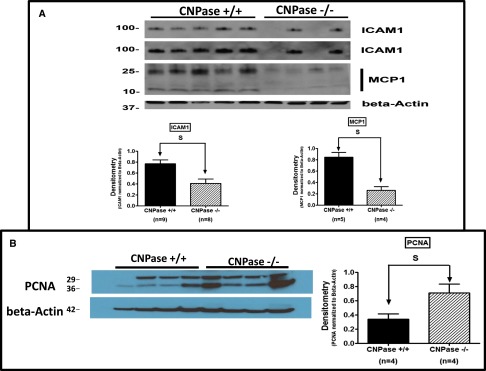
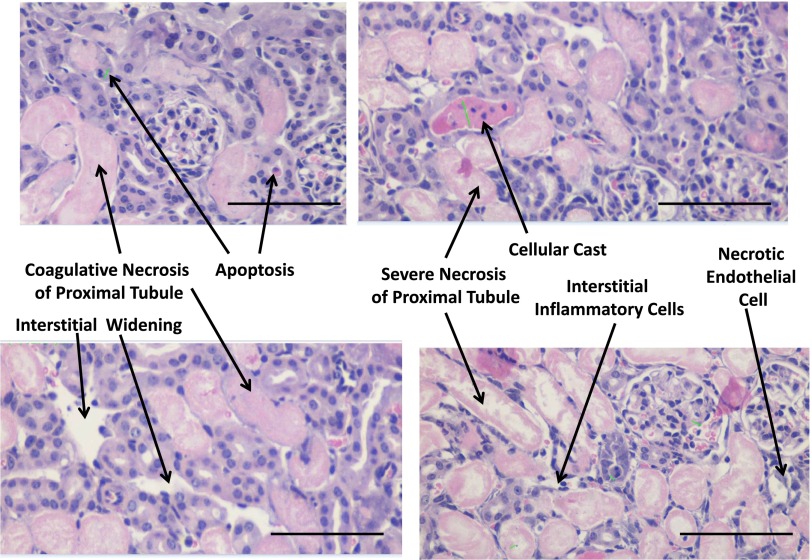
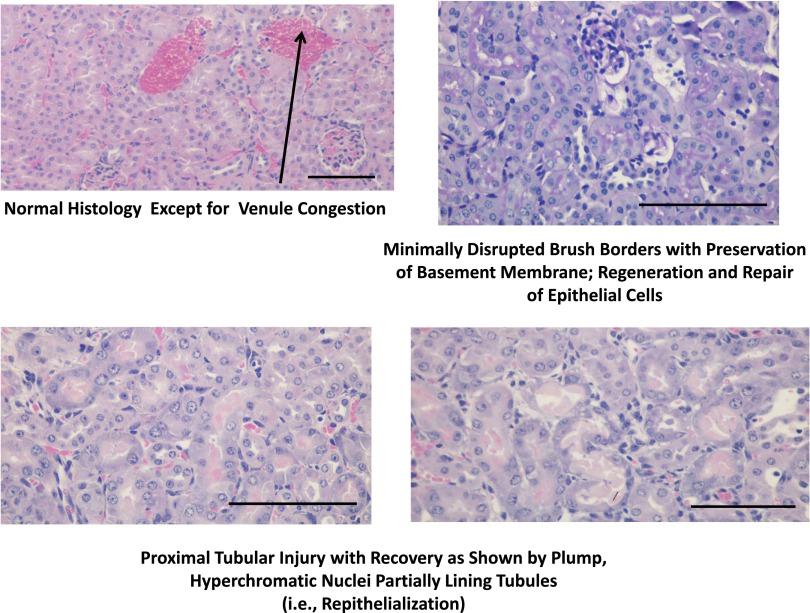
We conducted detailed histopathologic analysis of kidneys from sham CNPase+/+, AKI CNPase+/+, sham CNPase−/−, and AKI CNPase−/− mice (n=6 kidneys per group). Kidneys from both sham CNPase+/+ (Figure 3, A and C, hematoxylin and eosin [H&E] and periodic acid–Schiff [PAS] staining, respectively) and sham CNPase−/− (Figure 3, B and D, H&E and PAS staining, respectively) mice were histologically normal (0 score on a scale of 0–4), with no evidence of any pathologic changes associated with KO of CNPase. However, kidneys from AKI CNPase+/+ mice compared with CNPase−/− mice had, on average, significantly worse histopathology scores (scale of 0 [best] to 4 [worst]) for both epithelial apoptosis (as assessed by blebbing, phagocytosis, cell shrinkage, nuclear and chromatin condensation) (Figure 4A) and tubular injury (as assessed by tubular necrosis, dilation, and degeneration and interstitial edema) (Figure 4B). In contrast, CNPase−/− mice had significantly better histopathology scores (scale of 0 [worst] to 4 [best]) for epithelial regeneration (as assessed by hyperchromatic nuclei and epithelial cells undergoing mitosis) (Figure 4C). Also, CNPase+/+ mice had significantly worse histopathology scores (scale of 0 [best] to 4 [worst]) for peritubular capillary congestion (Figure 4D). Although not statistically significant, CNPase+/+ mice also had worse histopathology scores (scale of 0 [best] to 4 [worst]) for epithelial cell detachment (Figure 4E), loss of brush border (Figure 4F), and inflammation (as assessed by leukocyte adhesion and extravasation of neutrophils and monocytes) (Figure 4G). An overall composite kidney injury score (scale of 0 [best] to 4 [worst]) was calculated by averaging the scores obtained for all assessed histologic parameters, and this measure of AKI was statistically significantly reduced in AKI CNPase−/− compared with AKI CNPase+/+ mice (Figure 4H). The increased inflammation in the injured kidneys of CNPase+/+ compared with CNPase−/− mice was confirmed by a significant elevation in the proinflammatory cytokines intercellular adhesion molecule 1 (ICAM-1) and monocyte chemotactic protein 1 (MCP1) in renal tissue (Figure 5A). Likewise, the improved epithelial regeneration in injured CNPase−/− kidneys was confirmed by a significant increase in proliferating cell nuclear antigen (PCNA) expression (Figure 5B). Figure 6 illustrates representative H&E kidney stains from AKI CNPase+/+ mice showing the typical histologic picture in kidneys from these animals. Figure 7 shows representative kidney stains from AKI CNPase−/− mice showing less severe injury in this group.
Figure 3.
Representative renal histology images in (A and C) sham CNPase+/+ and (B and D) sham CNPase−/− mice. Sham received the same procedure as the group that received AKI, except that the kidneys were not subjected to ischemia. (A and B) H&E staining (magnification, ×10). (C and D) PAS staining (magnification, ×10). Original magnification, ×10. Scale bar, 100 μm.
Figure 4.
Renal histopathology scores for the indicated parameters (in the box above each panel) in CNPase+/+ (n=6) versus CNPase−/− (n=6) mice subjected to IR injury–induced AKI. S and NS indicate statistically significant and nonsignificant differences, respectively. Values represent means and SEMs.
Figure 5.
Effects of IR injury–induced AKI on renal tissue levels of ICAM-1, MCP1, and PCNA in CNPase+/+ versus CNPase−/− mice. (A) Western blot for ICAM-1 and MCP1 with quantification by densitometry normalized to β-actin (bar graphs). The ICAM1 blot is shown at both short (upper) and long (lower) exposure times. An additional four kidneys from CNPase+/+ and CNPase−/− mice were blotted for ICAM-1 (not shown) to confirm the difference. (B) Western blot for PCNA with quantification by densitometry normalized to β-actin (bar graphs). Values represent means and SEMs. Total sample sizes (n) are shown under bar graphs.
Figure 6.
Representative renal histopathology images in CNPase+/+ mice subjected to IR injury–induced AKI. All images are H&E stains at ×20 magnification. Scale bar, 100 μm.
Figure 7.
Representative renal histopathology images in CNPase−/− mice subjected to IR injury–induced AKI. Upper right panel shows PAS stain, and the other three images are H&E stains. Magnification is ×20 for all images. Scale bar, 100 μm.
CNPase is targeted to and accumulates within the mitochondrial intermembrane space,19 and low concentrations of 2′,3′-cAMP (the main substrate for CNPase) open mPTPs.4 Accordingly, a deficiency of mitochondrial CNPase would augment mPTP opening in IR-injured mitochondria, leading to amplified damage in those specific organelles.20 Therefore, a possible mechanism to explain how knocking out CNPase protects against IR-induced AKI is that CNPase deletion marks malfunctioning mitochondria for rapid autophagy (mitophagy), whereas in the presence of CNPase, malfunctioning mitochondria continue to exist, malfunction, and cause cellular injury. Consistent with this hypothesis, recent studies show that (1) mitochondrial damage is a major stimulus for autophagy,6–8 (2) renal autophagy protects against IR-induced AKI,9–16 and (3) insufficient autophagy contributes to organ failure.17 To explore this mitochondria hypothesis, we conducted a detailed analysis of mitochondria and autophagy in kidneys from CNPase+/+, AKI CNPase+/+, sham CNPase−/−, and AKI CNPase−/− mice.
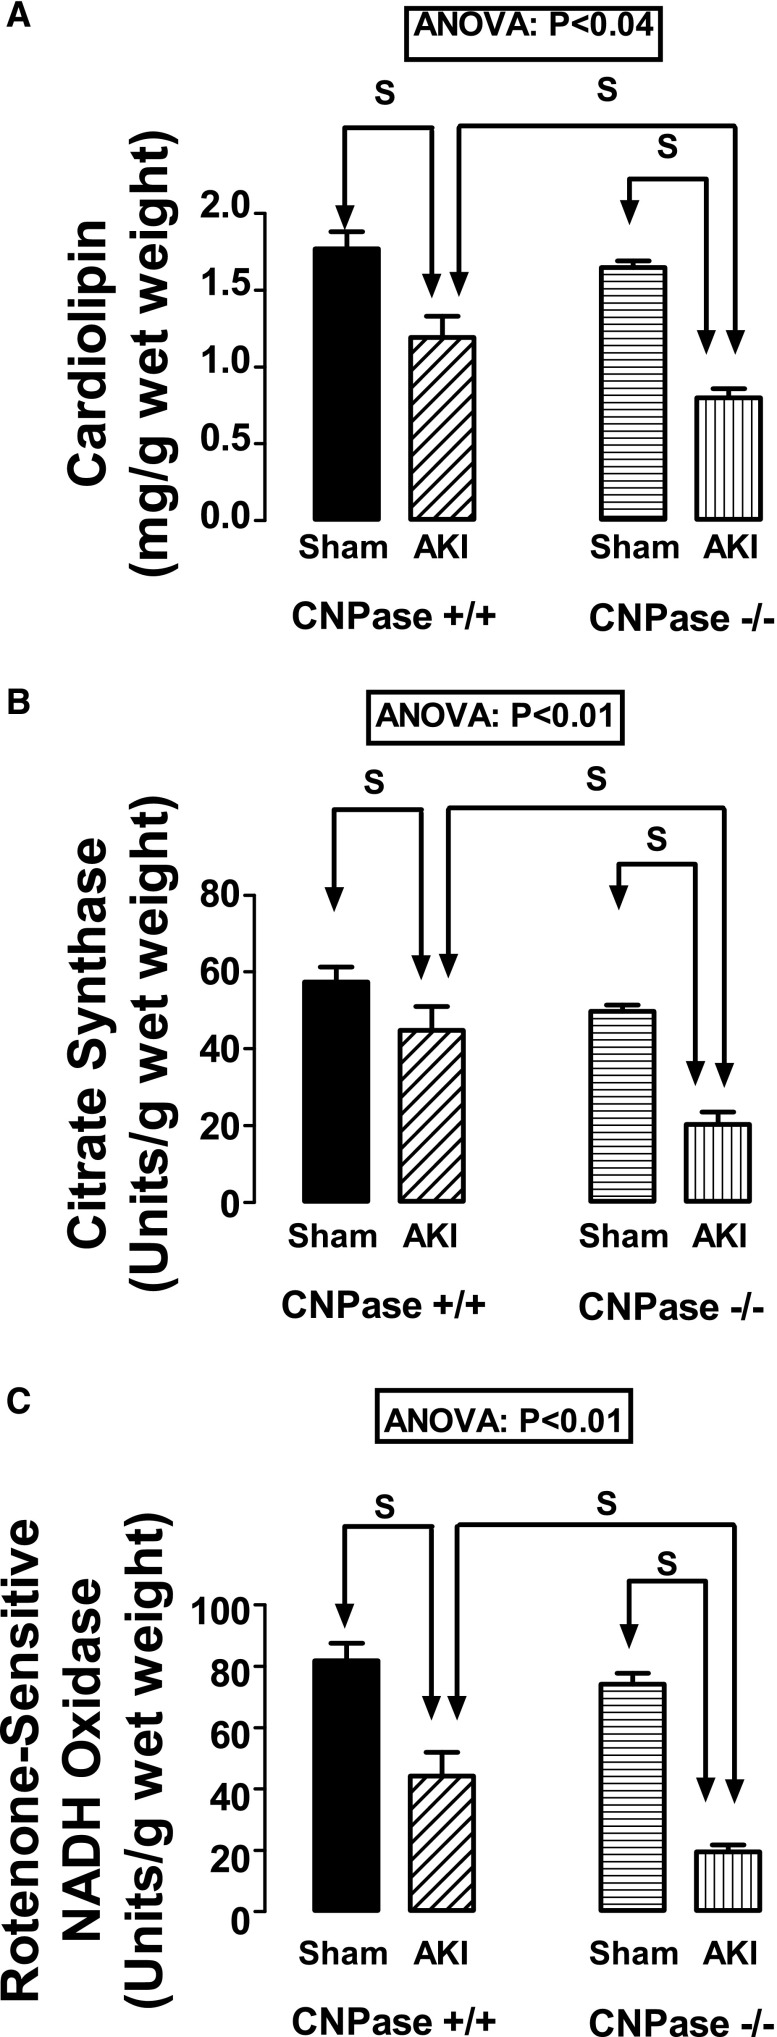
Cardiolipin is localized to the inner mitochondrial membrane.21,22 Therefore, the quantity of cardiolipin in a tissue sample reflects the quantity of mitochondria in the sample. As shown in Figure 8A, renal cortical levels of cardiolipin in response to IR-induced AKI were significantly (ANOVA; P<0.04) affected by genotype. In this regard, predetermined contrasts showed that, although renal IR reduced renal levels of cardiolipin, the decrease in cardiolipin was greater in AKI CNPase−/− mice compared with AKI CNPase+/+ mice. This suggested a greater loss of renal cortical mitochondria in CNPase−/− mice compared with CNPase+/+ mice.
Figure 8.
Effects of IR injury–induced AKI on kidney levels of (A) cardiolipin, (B) citrate synthase activity, and (C) rotenone–sensitive NADH oxidase activity in CNPase+/+ and CNPase−/− mice. Sham indicates a group of mice that received the same procedure as the AKI group, except that the kidneys were not subjected to ischemia. ANOVA indicates P value for effect of genotype on variable by two-factor ANOVA. S indicates statistically significant difference by post hoc analysis. Values represent means and SEMs for 9–10 kidneys.
Citrate synthase is a mitochondrial matrix enzyme, and its activity is a useful measure of mitochondrial volume.23 As shown in Figure 8B, renal cortical levels of citrate synthase activity in response to IR-induced AKI were significantly (ANOVA; P<0.01) affected by genotype. Predetermined contrasts showed that, although renal IR reduced renal levels of citrate synthase activity, the decrease in citrate synthase activity was greater in AKI CNPase−/− mice compared with AKI CNPase+/+ mice. These findings are consistent with the cardiolipin results suggesting a greater loss of renal cortical mitochondria in CNPase−/− mice compared with CNPase+/+ mice.
A decrease in mitochondrial number and volume should be associated with a reduction in rotenone–sensitive NADH oxidase activity, a biomarker of mitochondrial electron transport chain capacity.24,25 As shown in Figure 8C, renal cortical rotenone–sensitive NADH oxidase activity in response to IR-induced AKI was significantly (ANOVA; P<0.01) affected by genotype. Predetermined contrasts showed that, although renal IR reduced renal rotenone–sensitive NADH oxidase activity, the decrease was greater in AKI CNPase−/− mice compared with AKI CNPase+/+ mice. These findings also are consistent with the cardiolipin and citrate synthase results suggesting a greater loss of renal cortical mitochondria in CNPase−/− mice compared with CNPase+/+ mice.
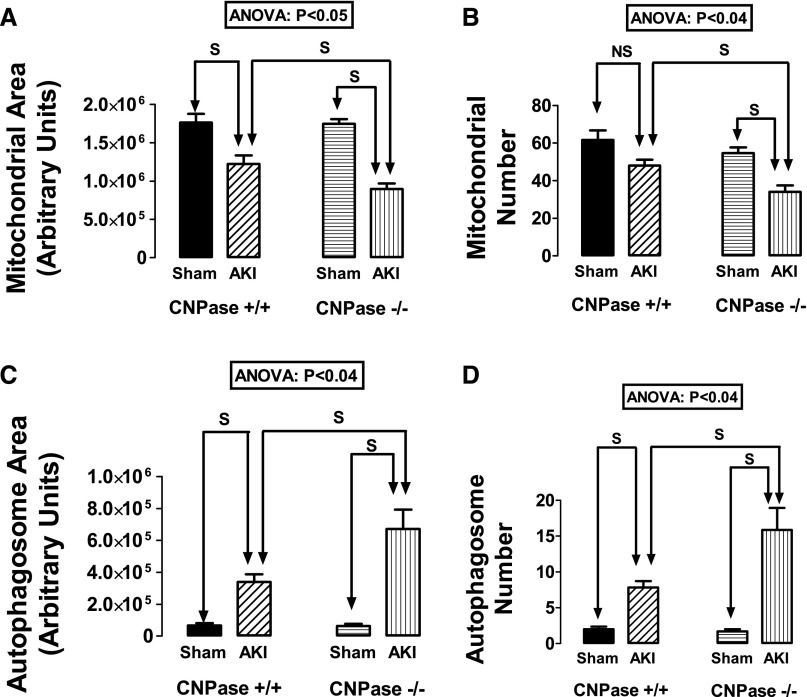
In an attempt to confirm the inferences from our biochemical measures and assess autophagy and mitophagy, we subjected renal cortical tissue to transmission electron microscopy (TEM) and performed a detailed, quantitative analysis of proximal tubular epithelial cell mitochondrial area, mitochondrial number, autophagosome area, and autophagosome number. An autophagosome was defined as a double-membrane structure completely encircling an organelle or organelle remnant. Genotype significantly affected IR-induced changes in mitochondrial area (Figure 9A) and number (Figure 9B) as well as autophagosome area (Figure 9C) and number (Figure 9D) (ANOVA; P<0.05; P<0.04; P<0.04; and P<0.04, respectively). Predetermined contrasts showed that, although renal IR reduced mitochondrial areas and numbers and increased autophagosome areas and numbers, these changes in all cases were greater in AKI CNPase−/− mice compared with AKI CNPase+/+ mice. These findings indicate accelerated autophagy in injured kidneys from CNPase−/− mice that is associated with a reduced number and area of mitochondria.
Figure 9.
Effects of IR injury–induced AKI on renal proximal epithelial cell (A) mitochondrial area, (B) mitochondrial number, (C) autophagosome area, and (D) autophagosome number in CNPase+/+ and CNPase−/− mice. Sham indicates group of mice that received the same procedure as the AKI group, except that the kidneys were not subjected to ischemia. ANOVA indicates P value for effect of genotype on variable by two-factor ANOVA. S and NS indicate statistically significant and nonsignificant differences, respectively, by post hoc analysis. Values represent means and SEMs for 6–7 kidneys.
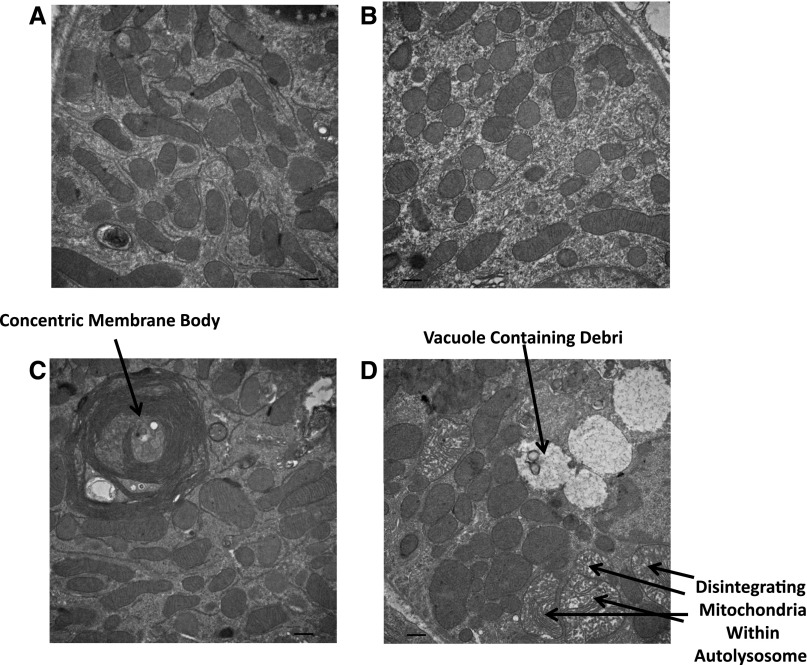
Our TEM studies revealed other important morphologic differences between injured CNPase+/+ kidneys versus injured CNPase−/− kidneys. In uninjured kidneys, mitochondrial morphology was similar in CNPase+/+ (Figure 10A) compared with CNPase−/− (Figure 10B) kidneys. Injured kidneys from CNPase+/+ mice showed frequent bodies consisting of multiple tightly packed concentric membranes (Figure 10C). In contrast, injured kidneys from CNPase−/− showed frequent vacuoles containing debris from apparently the late stages of autophagy (Figure 10D). Also, disintegrating mitochondria were frequently observed in injured CNPase−/− kidneys but not CNPase+/+ kidneys. Taken together, these results are consistent with an accelerated rate of autophagy resulting in deletion (mitophagy) of damaged mitochondria in CNPase−/− kidneys.
Figure 10.
Representative TEMs of renal proximal epithelial cells from kidneys obtained from (A) sham CNPase+/+, (B) sham CNPase−/−, (C) AKI CNPase+/+, and (D) AKI CNPase−/− mice. AKI mice were subjected to IR injury–induced AKI. Sham mice received the same procedure as the AKI group, except that the kidneys were not subjected to ischemia. Magnification is ×20,000 for all images. Scale bar, 500 nm.
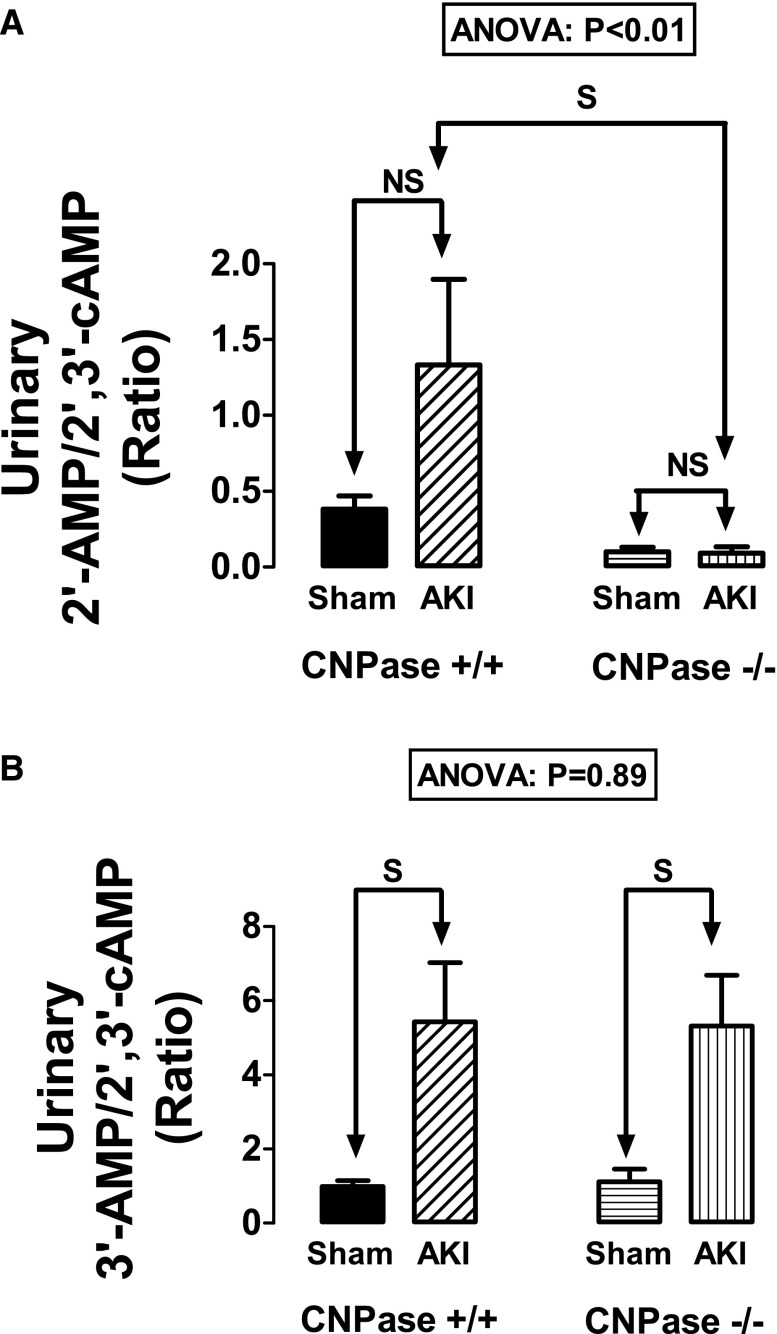
We also measured by liquid chromatography-tandem mass spectrometry the urinary excretion rates of adenosine, inosine, hypoxanthine, 2′,3′-cAMP, 2′-AMP, and 3′-AMP. Because the measurements were conducted 48 hours after IR, they do not reflect acute changes in renal purine production in response to IR. Although there were no differences across the four groups with regard to the urinary excretion rates of adenosine, inosine, or hypoxanthine (data not show), there were significant differences in the urinary excretion rates of 2′,3′-cAMP, 2′-AMP, and 3′-AMP. Specifically, the urinary 2′-AMP-to-2′,3′-cAMP ratio was significantly affected by genotype (ANOVA; P<0.01), whereas the urinary 3′-AMP-to-2′,3′-cAMP ratio was not (ANOVA; P=0.89). In this regard, the urinary 2′-AMP-to-2′,3′-cAMP ratio tended to increase with injury in CNPase+/+ kidneys but did not in IR–injured CNPase−/− kidneys. Thus, the urinary 2′-AMP-to-2′,3′-cAMP ratio in IR–injured CNPase+/+ kidneys was significantly greater than in IR–injured CNPase−/− kidneys (Figure 11A). In contrast, the urinary 3′-AMP-to-2′,3′-cAMP ratio increased similarly with IR injury in both CNPase+/+ and CNPase−/− kidneys (Figure 11B). These results are consistent with the expectation that deletion of CNPase should perturb the metabolism of 2′,3′-cAMP to 2′-AMP but should not alter the conversion of 2′,3′-cAMP to 3′-AMP.
Figure 11.
Bar graphs summarize the urinary excretion ratios of (A) 2′-AMP to 2′,3′-cAMP and (B) 3′-AMP to 2′,3′-cAMP in sham CNPase+/+, AKI CNPase+/+, sham CNPase−/−, and AKI CNPase−/− mice. Sham indicates a group of mice (n=6–7) that received the same procedure as the AKI group (n=10–11), except that the kidneys were not subjected to ischemia. ANOVA indicates P value for effect of genotype on variable by two-factor ANOVA. S and NS indicate statistically significant and nonsignificant differences, respectively, by post hoc analysis. Values represent means and SEMs.
Discussion
In 2009, we discovered that rat kidneys produce, in response to energy depletion, a positional isomer of 3′,5′-cAMP, namely 2′,3′-cAMP.1 This was the first report of the existence of 2′,3′-cAMP in any animal cell/tissue/organ or organism. The production of 2′,3′-cAMP as well as other nucleoside 2′,3′–cyclic monophosphates by living tissues has been corroborated by multiple independent laboratories.26–31
Our hypothesis that injury increases 2′,3′-cAMP production also has received confirmation. For example, brain trauma in mice increases brain interstitial levels of 2′,3′-cAMP, and 2′,3′-cAMP is elevated in cerebrospinal fluid of humans in the early hours after traumatic brain injury.32 These findings confirm that injury triggers the production of 2′,3′-cAMP and indicate that this biochemical system exists in humans.
Azarashvili et al.4 discovered that 2′,3′-cAMP opens mPTPs. Opening of mPTPs causes mitochondria damage,5 and mitochondrial damage is a stimulus for autophagy.6–8 Studies suggest that renal autophagy protects against AKI,9–16 and insufficient autophagy contributes to organ failure.17 Therefore, it is conceivable that 2′,3′-cAMP, by increasing autophagy, protects against AKI.
Testing this hypothesis requires some method to interfere with the metabolism of 2′,3′-cAMP, and this requirement led us to investigate the role of CNPase in the kidney. CNPase is an enigmatic protein abundantly expressed in the brain33,34 that is currently viewed as a structural protein. Although CNPase is considered primarily a brain protein, we previously investigated whether CNPase participates in the renal metabolism of 2′,3′-cAMP.18 We observed that CNPase mRNA and protein exist in rat glomerular mesangial, preglomerular vascular smooth muscle, and endothelial cells as well as in proximal tubular, thick ascending limb, and collecting duct cells.18 Moreover, we found that overexpression of CNPase in kidney cells increases the metabolism of exogenous 2′,3′-cAMP to 2′-AMP and that infusions of 2′,3′-cAMP into CNPase+/+ kidneys increase renal venous 2′-AMP, and this response is diminished in CNPase−/− kidneys.18 Finally, we observed that, in CNPase+/+ kidneys, energy depletion increases kidney tissue levels of 2′,3′-cAMP in CNPase−/− but not CNPase+/+ kidneys.18 These findings support the view that kidneys express CNPase and that renal CNPase mediates, in part, the renal metabolism of 2′,3′-cAMP.
Having established that CNPase mediates, in part, the renal metabolism of 2′,3′-cAMP,18 in this study, we addressed the hypothesis that perturbing 2′,3′-cAMP metabolism affects renal outcomes in IR-induced AKI. We observed that injured kidneys of CNPase−/− mice compared with CNPase+/+ mice had higher GFRs, lower RVRs, less urinary excretion of biomarkers of kidney injury, better preserved renal histology, increased epithelial cell regeneration, increased expression of PCNA, and decreased expression of inflammatory cytokines, such as ICAM-1 and MCP1. These findings indicate that blocking CNPase provides renoprotection.
To explain how deleting CNPase protects against IR-induced AKI, we examined the effects of knocking out CNPase on mitochondria. There are multiple reasons for considering the hypothesis that mitochondria are involved in the protective effects of deleting CNPase. Intracellular CNPase is localized mainly to the mitochondria. There are two isoforms of CNPase, namely CNPase 1 and CNPase 2.19 CNPase 2 has a C–terminal 20-amino acid extension that is a mitochondrial targeting sequence19 that guides CNPase 2 into the mitochondrial intermembrane space. There, CNPase 2 is cleaved to yield CNPase 1. CNPase 1 then attaches to the inner mitochondrial membrane.19 In CNPase−/− mice, mitochondrial CNPase would be absent, which would result in increases in 2′,3′-cAMP within the mitochondrial intermembrane space. There is strong support for the concept that 2′,3′-cAMP opens mPTPs4; thus, a deficiency of mitochondrial CNPase would augment mPTP opening in IR-injured mitochondria, leading to amplified damage in those specific organelles.20 Therefore, a possible mechanism to explain how knocking out CNPase protects against IR-induced AKI is that CNPase deletion marks malfunctioning mitochondria for rapid autophagy (mitophagy), whereas in the presence of CNPase, malfunctioning mitochondria continue to exist, malfunction, and cause cellular injury. Because renal epithelial cells are enriched with mitochondria, aggressive removal of injured mitochondria would still leave sufficient mitochondria to maintain cell survival. We refer to this concept as the mitochondria hypothesis. In support of this concept, recent findings show that mitochondrial damage is a major stimulus for autophagy,6–8 that renal autophagy protects against IR-induced AKI,9–16 and that insufficient autophagy contributes to organ failure.17
A prediction of the mitochondria hypothesis is that the number of mitochondria should be decreased in injured CNPase−/− kidneys compared with injured CNPase+/+ kidneys. Because cardiolipin is localized to the inner mitochondrial membrane,21,22 the quantity of cardiolipin in a tissue sample reflects the total number of mitochondria in the sample. A decrease in mitochondrial number should also be associated with a reduction in rotenone–sensitive NADH oxidase activity, a biomarker of mitochondrial electron transport chain capacity.24,25 In this study, we observed that, although IR injury decreased cardiolipin content and rotenone–sensitive NADH oxidase activity in CNPase+/+ kidneys, these responses were augmented in CNPase−/− kidneys. Thus, the cardiolipin and rotenone–sensitive NADH oxidase activity measurements suggested a greater loss of renal cortical mitochondria in CNPase−/− mice compared with CNPase+/+ mice 48 hours postinjury.
Citrate synthase is a mitochondrial matrix enzyme and therefore, a useful measure of mitochondrial volume.23 Because loss of mitochondria would decrease the total volume of mitochondria, the mitochondria hypothesis predicts that citrate synthase activity should be reduced more so in CNPase−/− mice versus CNPase+/+ mice postinjury. This study confirms this prediction.
The mitochondria hypothesis also predicts increased autophagy in renal epithelial cells from CNPase−/− versus CNPase+/+ mice subjected to IR-induced AKI. Because the gold standard for autophagy is the presence of autophagosomes, we examined this prediction by painstaking analysis of autophagosome number and area in multiple TEM images. Importantly, we observed double the number and area of autophagosomes in injured CNPase−/− kidneys compared with injured CNPase+/+ kidneys. Moreover, in injured CNPase+/+ kidneys, there were concentric membrane bodies, possibly atypical autophagosomes containing mitochondrial membranes. In contrast, in injured CNPase−/− kidneys, we observed vacuoles containing remnants of either organelles or vacuoles that were consistent with complete digestion of organelles. Importantly, associated with the doubling of autophagy, there was a 50% reduction in mitochondria number and area. These data are consistent with the conclusion that most of the autophagy was mitophagy (i.e., removal of damaged mitochondria).
The results from measurements of cardiolipin content, citrate synthase activity, rotenone–sensitive NADH activity, mitochondrial number and area, and autophagosome number and area were all consistent with the mitochondria hypothesis. Therefore, likely, this is in part the mechanism by which knocking out CNPase protects against IR-induced AKI. However, an important question relates to the direction of causality. Does increased autophagy cause less kidney injury, or does less kidney injury induce more autophagy? There are three compelling reasons to conclude that the direction of causality is CNPase KO → increased autophagy in response to injury → renoprotection.
First, it is established beyond reasonable doubt that autophagy is a cytoprotective response to injury (reviews in refs. 35 and 36). That is to say, there is now a body of literature consistent with the concept that tissue injury induces autophagy (i.e., the more injury, the more autophagy and the less injury, the less autophagy). Therefore, the literature overwhelming contradicts the possibility that less kidney injury in CNPase−/− mice causes increased autophagy.
Second, another reason to conclude that autophagy is the cause rather than the result of renoprotection is that manipulating autophagy affects IR-induced AKI in a manner that is usually consistent with autophagy protecting against kidney injury. For example, induction of autophagy with rapamycin protects against IR-induced AKI in mice, whereas inhibition of autophagy with 3-methyladenine augments IR-induced AKI in mice.15 Moreover, in mice, KO/knockdown of autophagy-associated genes in the renal proximal tubule augments IR-induced AKI.13,14,16
Third, the last reason to conclude that autophagy is the cause of renoprotection is that hypoxic stress stimulates autophagy.37 In our experiments, renal blood flow (RBF) was clearly reduced in injured wild–type animals but was not reduced in injured CNPase KO mice. Therefore, there was less of a stimulus for autophagy in the CNPase KO mice, but still, there was more autophagy in these mice. This is consistent with the conclusion that it was the underlying deletion of CNPase that directly increased autophagy.
This study shows that KO of CNPase protects kidneys against IR-induced AKI, and this implies that pharmacologic inhibition of CNPase may prove useful as a therapeutic strategy to prevent AKI. The mechanism of protection afforded by inhibition of CNPase in part involves enhanced autophagy (mitophagy), leading to an accelerated rate of removal of damaged (harmful) mitochondria. Our findings suggest the broader strategy of enhancing autophagy (mitophagy) for renoprotection.
Concise Methods
Animals
These studies involved 18 CNPase+/+ and 18 CNPase−/− mice (total of 36; both female and male) that were 16.8±0.6 weeks of age and weighed 26.5±0.5 g. For each genotype, 11 were subjected to AKI, and seven served as sham controls. CNPase−/− mice were null for both CNPase 1 and CNPase 2 isoforms, bred, and genotyped38 at the University of Pittsburgh Safar Center for Resuscitation Research. Lappe-Siefke et al.38 developed this KO mouse model and provided breeders to R.B. at the University of Connecticut Health Center. JAX Mice and Services (The Jackson Laboratory, Bar Harbor, ME) used mice obtained from R.B.’s colony to rederive the strain, and heterozygous breeders were sent by JAX Mice and Services to the University of Pittsburgh. Genotyping was performed as previously described.38 The Institutional Animal Care and Use Committee approved all procedures. The investigation conforms to the Guide for the Care and Use of Laboratory Animals published by the US National Institutes of Health.39
Two–Kidney, Hanging–Weight Model of IR-Induced AKI
Cross-clamping of the renal pedicle is the most widely used method of producing renal IR. In mice, however, this model of IR-induced AKI produces an inconsistent level of injury, which was evidenced by both kidney-to-kidney variability and regional variability within a given kidney. Most likely, this variability is because cross-clamping occludes both the renal artery and vein, resulting in stasis of blood in the renal vasculature, and mechanically traumatizes both the renal artery and vein (and sometimes, the ureter). Combined, these effects result in incomplete and regionally variable kidney reperfusion. To avoid these drawbacks, Grenz et al.40 developed the innovative one–kidney, hanging–weight model of IR-induced AKI, in which a suture is carefully positioned under the renal artery and pulled tight by applying weights on each end of the suture. After the prescribed period of ischemia, the suture is withdrawn, allowing for full recovery of renal perfusion.
Although a great improvement over cross-clamping, the one–kidney, hanging–weight model requires removal of the uninjured (contralateral) kidney, so that urine collected from the bladder derives from the injured kidney only. Contralateral nephrectomy, however, is not ideal for three reasons. (1) The urine flow rate of one injured kidney is very low, thus limiting the volume of urine for offline analysis. (2) Because mice must rely on the function of a single injured kidney, they are sicker, more fragile, and therefore, more difficult to study. (3) Clinically, most patients suffering renal IR–induced AKI have two kidneys. Building on the one–kidney, hanging–weight model, we developed the two–kidney, hanging–weight model of renal IR–induced AKI and used this model to study the role of CNPase in AKI.
Each mouse was anesthetized with isoflurane (5% for induction and 1%–2% for maintenance) in oxygen. The mouse was placed in the prone position, and a 1.5- to 2-cm incision was made in the dorsal skin along the axis of the spine. The skin was retracted, and the muscle on each side of the spine was blunt dissected to expose both the left and the right renal arteries. The renal arteries were carefully separated from their respective renal veins without damaging vessels or ureters. Injuring one kidney at a time, a 4/0-silk suture was passed between the renal artery and vein of a kidney, and the ends of the suture were passed over a pulley system. Next, the ends were attached to 1-g weights, and the weights were allowed to hang, thus compressing the renal artery with the suture. After 20 minutes of ischemia, the suture was removed, and the procedure was repeated on the opposite kidney. Sham mice were treated exactly like injured mice, except that the weights were not attached to the ends of the suture. The muscle was sutured with 4/0 silk, and the skin was closed with wound clips. Although this technique requires a great deal of practice (even by an experienced small animal surgeon), after it is mastered, the results are excellent. A timed collection of urine at this stage of the experiment was not attempted, because this would have entailed surgical cannulation of the bladder, likely resulting in too much trauma, urinary tract dysfunction, and increased risk of infection.
Protocol
Forty-eight hours after renal IR, mice were anesthetized with Inactin (100 mg/kg intraperitoneally; plus supplemental anesthetic if necessary) and placed in the supine position on a thermostatically controlled heating system connected to a rectal temperature sensor to maintain body temperature at 37°C. A polyethylene-90 (PE-90) tubing was inserted into the trachea to facilitate breathing, and a PE-10 catheter was inserted into the femoral vein. A constant-rate infusion (10 µl/min) of 14C-inulin (0.0035 µCi/min dissolved in 0.9% saline containing 2.45% albumin) was initiated through the femoral vein catheter. Next, a PE-10 catheter was inserted into the carotid artery and connected to a digital BP analyzer (Micro-Med, Inc., Louisville, KY) for measurement of MABP and HR. For collection of urine, a short segment of PE-50 tubing was inserted into silastic tubing, a small hole was made in the rostral end of the bladder using a cautery, and the silastic–covered PE-50 tubing was inserted into the bladder. The end of the bladder catheter was advanced toward the urethra, and the bladder catheter was secured in place with a 4/0 suture ligated around the body of the bladder at a level rostral to the entry location of the ureters into the bladder. We found that this technique works best, because the PE-50 tubing provides a rigid body for securing the catheter in place, but the outer silastic protects the bladder from injury and allows more flexibility in the catheter exiting the bladder.
After completion of surgery, we instituted a 1-hour rest period to permit the mouse to stabilize and allow plasma 14C-inulin levels to approach steady state. At the end of the 1-hour rest period, urine was collected for 1 hour, and the mouse was carefully moved to the prone position. The dorsal incision site made at the time of renal IR was reopened to expose the right and the left renal arteries. An attempt was then made to place a transit–time flow probe (0.5SB with J reflector and no handle; custom-designed by Transonic Systems, Inc., Ithaca, NY) on either the right or the left renal artery. In the injured mice, this was not always possible because of the combination of a short segment of renal artery, adhesions, and bleeding tendencies. For those in which placement of the nanoprobe on a renal artery was successful, the nanoprobe was connected to a model T402-PP Transonic Flowmeter. RBF was then averaged over 15 minutes. The reason for n=11 in the injured groups versus n=7 in the sham groups was simply because we had to perform surgery on four additional mice in the injured groups to achieve n=7 for RBF measurements. At the end of the experiment, a blood sample was collected in heparin from the carotid artery catheter, and the kidneys were quickly removed and either placed in 4% paraformaldehyde for histology, prepared for electron microscopy, or frozen at −80°C for subsequent biochemical or Western blot analysis.
14C-inulin was determined in urine and plasma by measuring radioactivity in these samples, and GFR was estimated by calculating the renal clearance of 14C-inulin. As an index of proximal tubular injury, KIM-1 was measured in urine using a mouse ELISA kit (ab119596; Abcam, Inc., Cambridge, MA). As an index of general AKI severity, NGAL was also measured in urine with a mouse ELISA kit (ab119601; Abcam, Inc.). Albumin (ab108792; mouse ELISA kit from Abcam, Inc.) was also determined in urine as an index of glomerular damage.
Subsets of kidneys in 4% paraformaldehyde (n=6 in each of four groups) were sent to the University of Pittsburgh’s pathology laboratory for preparation of paraffin blocks and production of nine slides per kidney, three of which were processed for H&E staining, three of which were processed for PAS staining, and three of which were processed for trichrome staining. Stained slides were sent to Nationwide Histology (Veradale, WA) for blinded scoring of histopathology by a veterinarian pathologist.
Analyses of Urinary Purines
Purines in urine were measured as previously described2 with modifications using liquid chromatography-tandem mass spectrometry. A heavy–isotope internal standard (13C10-labeled adenosine; Medical Isotopes, Pelham, NH) was added to each diluted sample, and purines were resolved by reversed–phase liquid chromatography (Waters UPLC BEH C18 Column; 1.7-µm beads; 2.1×150 mm; Waters, Milford, MA) and assayed using a triple quadrupole mass spectrometer (TSQ Quantum-Ultra; Thermo Fisher Scientific, San Jose, CA) operating in the selected reaction monitoring mode with a heated electrospray ionization source. The mobile phase consisted of linear gradient changes of two buffers: buffer A, 1% acetic acid in water and buffer B, methanol. The mobile–phase flow rate was 300 µl/min and delivered with a Waters Acquity Ultra-Performance Liquid Chromatographic System. The gradient (A/B) was from 0 to 2 minutes, 99.6%/0.4%; from 2 to 3 minutes, 98.0%/2.0%; from 3 to 4 minutes, 85.0%/15.0%; and from 4 to 6.5 minutes, 99.6%/0.4%. Instrument settings were: sample tray temperature, 10°C; column temperature, 50°C; ion spray voltage, 4.0 kV; ion transfer tube temperature, 350°C; source vaporization temperature, 320°C; Q2 collision-induced dissociation gas, argon at 1.5 mTorr; sheath gas, nitrogen at 60 psi; auxiliary gas, nitrogen at 35 psi; Q1/Q3 width, 0.7/0.7 units full–width half–maximum; scan width, 0.6 units; and scan time, 0.01 seconds.
Western Blotting
Western blot analysis of total kidney lysate was performed as previously described.32 In brief, CNPase+/+ and CNPase−/− mouse kidneys were homogenized in radioimmunoprecipitation assay buffer (Thermo Fisher Scientific) with both protease and phosphatase inhibitors using ultrasonication. The samples were centrifuged at 12,000×g for 10 minutes at 4°C to remove any nonsolubilized proteins. The protein concentrations of the cleared samples were determined using a BCA Protein Assay Kit (Thermo Fisher Scientific); 60 µg sample was separated by SDS-PAGE and then, transferred to a polyvinylidene fluoride membrane for antibody probing. Primary antibodies (goat anti–ICAM-1; 1:200; Santa Cruz Biotechnology, Santa Cruz, CA; mouse monoclonal anti–PCNA; 1:1000, Santa Cruz Biotechnology; rabbit anti-MCP1; 1:1000; Cell Signaling Technology, Danvers, MA; and mouse anti–β-actin; 1:1000; Sigma-Aldrich, St. Louis, MO) were diluted in 5% milk/Tris-Buffered Saline (TBS) with 0.05% Tween-20 and incubated on a shaker at 4°C overnight. The blots were then washed with TBS, probed with horseradish peroxidase–conjugated secondary antibody diluted in milk/TBS with 0.05% Tween-20 for 2 hours, washed again with TBS, and exposed to chemiluminescent substrate before development. The resulting films were scanned and processed with Adobe Photoshop software (Adobe Systems, Inc., San Jose, CA), and quantification of band intensity was performed using ImageJ software.
Preparation of Mitochondrial Fractions
Kidney homogenates were prepared from frozen tissue samples (15–25 mg wet weight) using a Polytron 1200CL Homogenizer equipped with a 7-mm shaft. Immediately after homogenization, tissues were centrifuged (20 minutes at 4°C and 45,000×g) to separate soluble and particulate fractions. The fractions were kept frozen at −80°C.
Analyses of Mitochondria Citrate Synthase and Electron Transport Chain NADH Oxidase Activities
Mitochondrial samples were analyzed for citrate synthase activity and the activity of electron transport chain NADH oxidase (complexes 1–4). Activities of rotenone–sensitive NADH:O2 oxidoreductase and citrate synthase in total particulate fractions prepared from kidney homogenate were measured in the presence of channel–forming antibiotic alamethicin as described previously by us.24,25 The soluble fraction (supernatant) was used to estimate remaining activity of citrate synthase that was released from mitochondria because of tissue freezing.
Measurements of Cardiolipin
Cardiolipin is a phospholipid that is specific to the inner mitochondrial membrane and essential for numerous mitochondrial functions.41 Accordingly, a quantitative assay for cardiolipin can be a valuable aspect of assessing mitochondrial content and functional capacity. The method is on the basis of derivatization of cardiolipin in a total lipid extract with 1-pyrenyldiazomethane (PDAM) to form stable, fluorescent 1-pyrenylmethyl esters. The derivatization reaction takes 30 minutes on ice in a two-phase system (chloroform:methanol:H2O:H2SO4) containing 0.5–1.0 mmol/L PDAM and detergent. The contents of the major cardiolipin species in the derivatization mixture were estimated by HPLC-based separation with fluorescent detection on a reverse-phase column and HPLC-grade ethanol containing 0.5 mmol/L H3PO4 as the mobile phase. Tetraoleoyl cardiolipin (internal standard) was purchased from Avanti Polar Lipids Inc. (Alabaster, AL). HPLC-grade chloroform stabilized by 0.7% ethanol was obtained from Fisher Scientific (Pittsburgh, PA). Other HPLC–grade solvents and reagents were purchased from Sigma-Aldrich. PDAM was obtained from Molecular Probes (Eugene, OR). A Shimadzu HPLC (model LC-10AT vp; Shimadzu, Columbia, MD) equipped with an autosampler (model SIL-10AD), a tray cooler, and a Shimadzu Fluorescence Detector (model RF-10Axl) was used for these studies. The analog signal of the detector was processed and stored in digital form with Shimadzu Class-VP software (Shimadzu).
TEM
Kidney mitochondrial and autophagosome number and area were assessed by electron microscopy. Regions of interest were dissected under a microscope into approximately 1-mm tissue blocks, fixed in 2.5% glutaraldehyde in 0.1 mol/L PBS (pH 7.4), rinsed in 0.1 mol/L PBS (pH 7.4), postfixed in 1% OsO4 with 0.1% K3Fe(CN)6, dehydrated, and embedded in dodecenyl succinic anhydride, nadic methyl anhydride, Scipoxy 812 Resin, and 2,4,6-tri(dimethylaminomethyl)phenol (Energy Beam Sciences, East Granby, CT). Ultrathin sections (65 nm) were cut, stained with 2% uranyl acetate and Reynold lead citrate, and examined on a Jeol 1011 TEM. Autophagosome and mitochondrial number and area were assessed in a blinded manner quantitatively from 10 fields taken from 10 different cells in each sample. For each kidney, 10 readings were averaged. Area was calculated using MetaMorph Microscopy Automation and Image Analysis Software (Molecular Devices, Sunnyvale, CA).
Statistical Analyses
Specific contrasts were decided on before the study. Comparisons involving only two groups were conducted with either unpaired t tests (for parametric data) or Mann–Whitney U tests (for datasets that were nonparametric). Multiple groups were analyzed using two-factor ANOVA followed by specific predetermined contrasts using Fisher's least significant difference test. The criterion of significance was P<0.05. All values in the text and figures are means±SEM.
Disclosures
None.
Acknowledgments
We thank Dr. Klaus-Armin Nave (Max Planck Institute for Experimental Medicine, Göttingen, Germany) for providing the 2′,3′-cyclic nucleotide 3′-phosphodiesterase knockout mouse strain.
This work was supported by National Institutes of Health Grants DK091190, HL109002, HL069846, DK068575, 1S10RR019003, and DK079307.
Footnotes
Published online ahead of print. Publication date available at www.jasn.org.
References
- 1.Ren J, Mi Z, Stewart NA, Jackson EK: Identification and quantification of 2′,3′-cAMP release by the kidney. J Pharmacol Exp Ther 328: 855–865, 2009 [DOI] [PMC free article] [PubMed] [Google Scholar]
- 2.Jackson EK, Ren J, Mi Z: Extracellular 2′,3′-cAMP is a source of adenosine. J Biol Chem 284: 33097–33106, 2009 [DOI] [PMC free article] [PubMed] [Google Scholar]
- 3.Jackson EK, Ren J, Cheng D, Mi Z: Extracellular cAMP-adenosine pathways in the mouse kidney. Am J Physiol Renal Physiol 301: F565–F573, 2011 [DOI] [PMC free article] [PubMed] [Google Scholar]
- 4.Azarashvili T, Krestinina O, Galvita A, Grachev D, Baburina Y, Stricker R, Evtodienko Y, Reiser G: Ca2+-dependent permeability transition regulation in rat brain mitochondria by 2′,3′-cyclic nucleotides and 2′,3′-cyclic nucleotide 3′-phosphodiesterase. Am J Physiol Cell Physiol 296: C1428–C1439, 2009 [DOI] [PubMed] [Google Scholar]
- 5.Kroemer G, Galluzzi L, Brenner C: Mitochondrial membrane permeabilization in cell death. Physiol Rev 87: 99–163, 2007 [DOI] [PubMed] [Google Scholar]
- 6.Bhatia-Kiššová I, Camougrand N: Mitophagy is not induced by mitochondrial damage but plays a role in the regulation of cellular autophagic activity. Autophagy 9: 1897–1899, 2013 [DOI] [PubMed] [Google Scholar]
- 7.Park E-Y, Park J-B: High glucose-induced oxidative stress promotes autophagy through mitochondrial damage in rat notochordal cells. Int Orthop 37: 2507–2514, 2013 [DOI] [PMC free article] [PubMed] [Google Scholar]
- 8.Zhang Y-Y, Meng C, Zhang X-M, Yuan C-H, Wen M-D, Chen Z, Dong D-C, Gao Y-H, Liu C, Zhang Z: Ophiopogonin D attenuates doxorubicin-induced autophagic cell death by relieving mitochondrial damage in vitro and in vivo. J Pharmacol Exp Ther 352: 166–174, 2015 [DOI] [PubMed] [Google Scholar]
- 9.Kaushal GP: Autophagy protects proximal tubular cells from injury and apoptosis. Kidney Int 82: 1250–1253, 2012 [DOI] [PMC free article] [PubMed] [Google Scholar]
- 10.Kimura T, Takahashi A, Takabatake Y, Namba T, Yamamoto T, Kaimori JY, Matsui I, Kitamura H, Niimura F, Matsusaka T, Soga T, Rakugi H, Isaka Y: Autophagy protects kidney proximal tubule epithelial cells from mitochondrial metabolic stress. Autophagy 9: 1876–1886, 2013 [DOI] [PubMed] [Google Scholar]
- 11.Livingston MJ, Dong Z: Autophagy in acute kidney injury. Semin Nephrol 34: 17–26, 2014 [DOI] [PMC free article] [PubMed] [Google Scholar]
- 12.Cui J, Bai XY, Sun X, Cai G, Hong Q, Ding R, Chen X: Rapamycin protects against gentamicin-induced acute kidney injury via autophagy in mini-pig models. Sci Rep 5: 11256, 2015 [DOI] [PMC free article] [PubMed] [Google Scholar]
- 13.Jiang M, Wei Q, Dong G, Komatsu M, Su Y, Dong Z: Autophagy in proximal tubules protects against acute kidney injury. Kidney Int 82: 1271–1283, 2012 [DOI] [PMC free article] [PubMed] [Google Scholar]
- 14.Kimura T, Takabatake Y, Takahashi A, Kaimori JY, Matsui I, Namba T, Kitamura H, Niimura F, Matsusaka T, Soga T, Rakugi H, Isaka Y: Autophagy protects the proximal tubule from degeneration and acute ischemic injury. J Am Soc Nephrol 22: 902–913, 2011 [DOI] [PMC free article] [PubMed] [Google Scholar]
- 15.Guan X, Qian Y, Shen Y, Zhang L, Du Y, Dai H, Qian J, Yan Y: Autophagy protects renal tubular cells against ischemia / reperfusion injury in a time-dependent manner. Cell Physiol Biochem 36: 285–298, 2015 [DOI] [PubMed] [Google Scholar]
- 16.Liu S, Hartleben B, Kretz O, Wiech T, Igarashi P, Mizushima N, Walz G, Huber TB: Autophagy plays a critical role in kidney tubule maintenance, aging and ischemia-reperfusion injury. Autophagy 8: 826–837, 2012 [DOI] [PubMed] [Google Scholar]
- 17.Gunst J, Derese I, Aertgeerts A, Ververs E-J, Wauters A, Van den Berghe G, Vanhorebeek I: Insufficient autophagy contributes to mitochondrial dysfunction, organ failure, and adverse outcome in an animal model of critical illness. Crit Care Med 41: 182–194, 2013 [DOI] [PubMed] [Google Scholar]
- 18.Jackson EK, Gillespie DG, Mi Z, Cheng D, Bansal R, Janesko-Feldman K, Kochanek PM: Role of 2′,3′-cyclic nucleotide 3′-phosphodiesterase in the renal 2′,3′-cAMP-adenosine pathway. Am J Physiol Renal Physiol 307: F14–F24, 2014 [DOI] [PMC free article] [PubMed] [Google Scholar]
- 19.Raasakka A, Kursula P: The myelin membrane-associated enzyme 2′,3′-cyclic nucleotide 3′-phosphodiesterase: On a highway to structure and function. Neurosci Bull 30: 956–966, 2014 [DOI] [PMC free article] [PubMed] [Google Scholar]
- 20.Azarashvili T, Stricker R, Reiser G: The mitochondria permeability transition pore complex in the brain with interacting proteins - promising targets for protection in neurodegenerative diseases. Biol Chem 391: 619–629, 2010 [DOI] [PubMed] [Google Scholar]
- 21.Paradies G, Paradies V, Ruggiero FM, Petrosillo G: Cardiolipin and mitochondrial function in health and disease. Antioxid Redox Signal 20: 1925–1953, 2014 [DOI] [PubMed] [Google Scholar]
- 22.Ren M, Phoon CKL, Schlame M: Metabolism and function of mitochondrial cardiolipin. Prog Lipid Res 55: 1–16, 2014 [DOI] [PubMed] [Google Scholar]
- 23.Wiegand G, Remington SJ: Citrate synthase: Structure, control, and mechanism. Annu Rev Biophys Chem 15: 97–117, 1986 [DOI] [PubMed] [Google Scholar]
- 24.Ritov VB, Menshikova EV, Azuma K, Wood R, Toledo FGS, Goodpaster BH, Ruderman NB, Kelley DE: Deficiency of electron transport chain in human skeletal muscle mitochondria in type 2 diabetes mellitus and obesity. Am J Physiol Endocrinol Metab 298: E49–E58, 2010 [DOI] [PMC free article] [PubMed] [Google Scholar]
- 25.Ritov VB, Menshikova EV, Kelley DE: High-performance liquid chromatography-based methods of enzymatic analysis: Electron transport chain activity in mitochondria from human skeletal muscle. Anal Biochem 333: 27–38, 2004 [DOI] [PubMed] [Google Scholar]
- 26.Pabst M, Grass J, Fischl R, Léonard R, Jin C, Hinterkörner G, Borth N, Altmann F: Nucleotide and nucleotide sugar analysis by liquid chromatography-electrospray ionization-mass spectrometry on surface-conditioned porous graphitic carbon. Anal Chem 82: 9782–9788, 2010 [DOI] [PMC free article] [PubMed] [Google Scholar]
- 27.Van Damme T, Zhang Y, Lynen F, Sandra P: Determination of cyclic guanosine- and cyclic adenosine monophosphate (cGMP and cAMP) in human plasma and animal tissues by solid phase extraction on silica and liquid chromatography-triple quadrupole mass spectrometry. J Chromatogr B Analyt Technol Biomed Life Sci 909: 14–21, 2012 [DOI] [PubMed] [Google Scholar]
- 28.Burhenne H, Tschirner S, Seifert R, Kaever V: Identification and quantitation of 2′,3′-cGMP in murine tissues. BMC Pharmacol Toxicol 14: P12, 2013. 23402420 [Google Scholar]
- 29.Van Damme T, Blancquaert D, Couturon P, Van Der Straeten D, Sandra P, Lynen F: Wounding stress causes rapid increase in concentration of the naturally occurring 2′,3′-isomers of cyclic guanosine- and cyclic adenosine monophosphate (cGMP and cAMP) in plant tissues. Phytochemistry 103: 59–66, 2014 [DOI] [PubMed] [Google Scholar]
- 30.Bordeleau E, Oberc C, Ameen E, da Silva AM, Yan H: Identification of cytidine 2′,3′-cyclic monophosphate and uridine 2′,3′-cyclic monophosphate in Pseudomonas fluorescens pfo-1 culture. Bioorg Med Chem Lett 24: 4520–4522, 2014 [DOI] [PubMed] [Google Scholar]
- 31.Jia X, Fontaine BM, Strobel F, Weinert EE: A facile and sensitive method for quantification of cyclic nucleotide monophosphates in mammalian organs: Basal levels of eight cNMPs and identification of 2′,3′-cIMP. Biomolecules 4: 1070–1092, 2014 [DOI] [PMC free article] [PubMed] [Google Scholar]
- 32.Verrier JD, Jackson TC, Bansal R, Kochanek PM, Puccio AM, Okonkwo DO, Jackson EK: The brain in vivo expresses the 2′,3′-cAMP-adenosine pathway. J Neurochem 122: 115–125, 2012 [DOI] [PMC free article] [PubMed] [Google Scholar]
- 33.Sprinkle TJ: 2′,3′-Cyclic nucleotide 3′-phosphodiesterase, an oligodendrocyte-Schwann cell and myelin-associated enzyme of the nervous system. Crit Rev Neurobiol 4: 235–301, 1989 [PubMed] [Google Scholar]
- 34.Thompson RJ: 2′,3′-Cyclic nucleotide-3′-phosphohydrolase and signal transduction in central nervous system myelin. Biochem Soc Trans 20: 621–626, 1992 [DOI] [PubMed] [Google Scholar]
- 35.Gustafsson AB, Gottlieb RA: Autophagy in ischemic heart disease. Circ Res 104: 150–158, 2009 [DOI] [PMC free article] [PubMed] [Google Scholar]
- 36.Aki T, Funakoshi T, Unuma K, Uemura K: Impairment of autophagy: From hereditary disorder to drug intoxication. Toxicology 311: 205–215, 2013 [DOI] [PubMed] [Google Scholar]
- 37.Jiang M, Liu K, Luo J, Dong Z: Autophagy is a renoprotective mechanism during in vitro hypoxia and in vivo ischemia-reperfusion injury. Am J Pathol 176: 1181–1192, 2010 [DOI] [PMC free article] [PubMed] [Google Scholar]
- 38.Lappe-Siefke C, Goebbels S, Gravel M, Nicksch E, Lee J, Braun PE, Griffiths IR, Nave K-A: Disruption of Cnp1 uncouples oligodendroglial functions in axonal support and myelination. Nat Genet 33: 366–374, 2003 [DOI] [PubMed] [Google Scholar]
- 39.National Institutes of Health: Guide for the Care and Use of Laboratory Animals, National Institutes of Health, Washington, D.C., National Academy Press, 1996
- 40.Grenz A, Hong JH, Badulak A, Ridyard D, Luebbert T, Kim JH, Eltzschig HK: Use of a hanging-weight system for isolated renal artery occlusion. J Vis Exp 53: 2549, 2011 [DOI] [PMC free article] [PubMed] [Google Scholar]
- 41.Ritov VB, Menshikova EV, Kelley DE: Analysis of cardiolipin in human muscle biopsy. J Chromatogr B Analyt Technol Biomed Life Sci 831: 63–71, 2006 [DOI] [PubMed] [Google Scholar]


