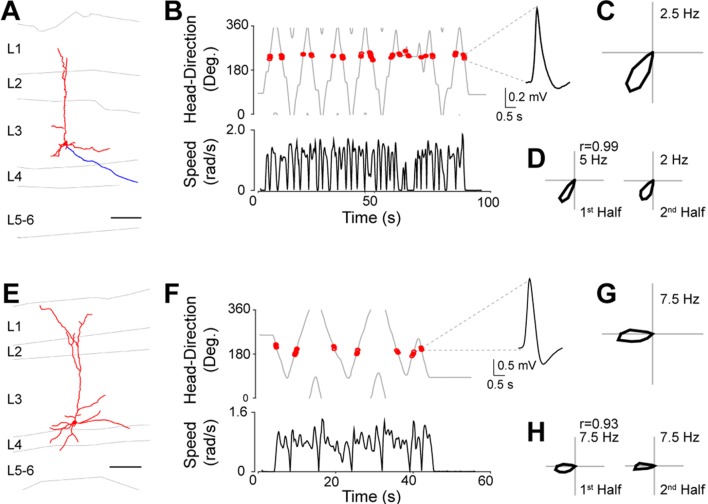
Figure 3. Identified HD cells in PreS layer 3.
(A) Morphological reconstruction of a representative layer 3 pyramidal HD cell (dendrites, red; axon, blue). Scale bar: 100 µm. (B) Angular HD (top) and angular speed (bottom) as a function of time. Spikes (red dots) are indicated. Note the sharp tuning to HD. (C) Polar plots showing firing rate as a function of HD for the neuron in (A). Peak firing rate is indicated. (D) Polar plots showing firing rate as a function of HD computed or the two halves of the recording session for the neuron in (A). The Pearson’s correlation coefficient between the two HD tuning curves and peak firing rates are indicated. (E–H) same as A–D but for another neuron. Scale bar: 100 µm.

