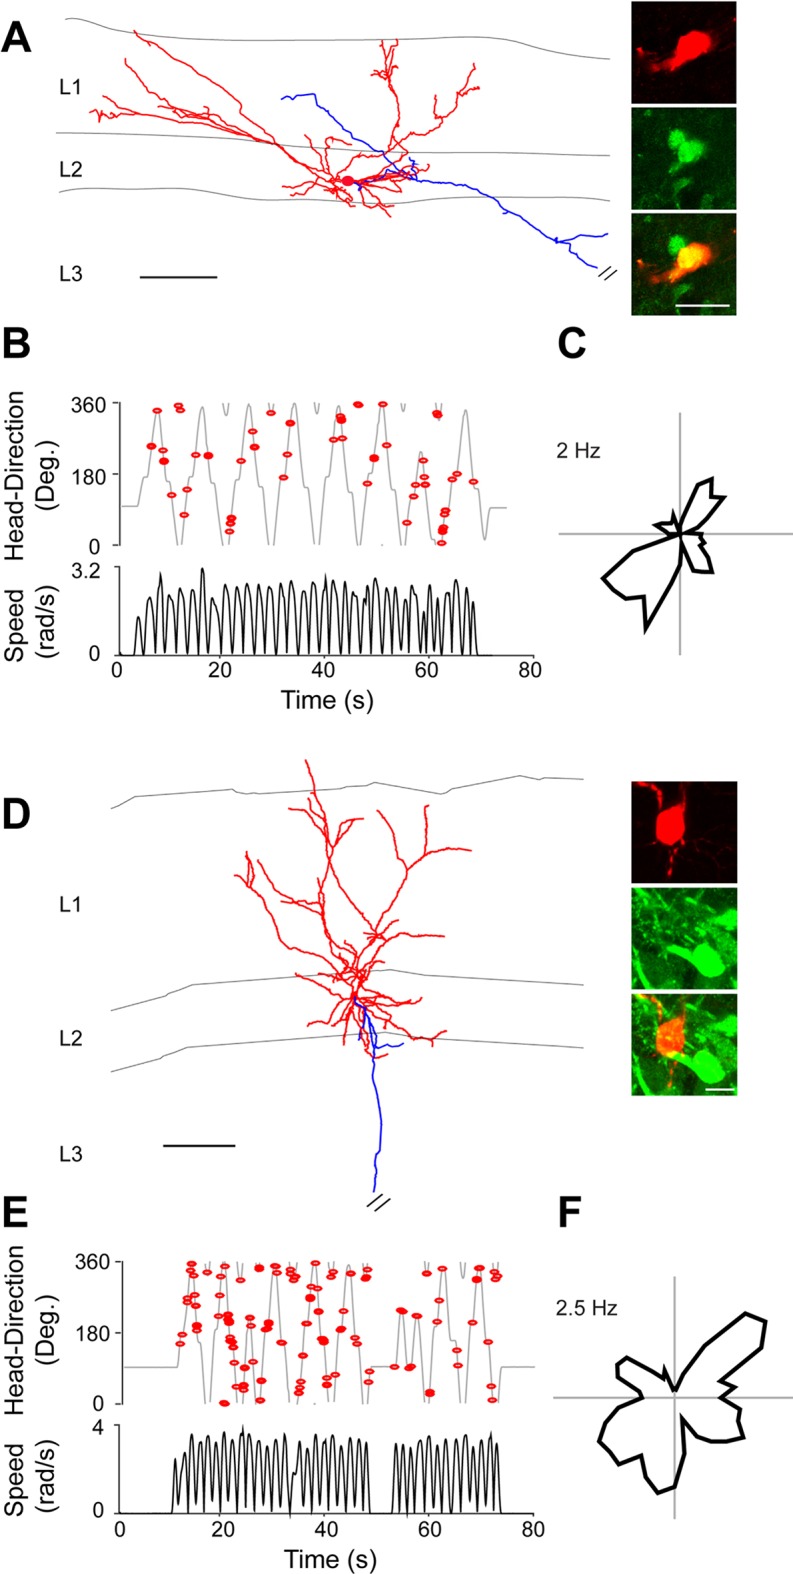
Figure 5. Non-directional spiking patterns of identified L2 PreS neurons..

(A) Left, morphological reconstruction of a representative calbindin-positive layer 2 neuron (dendrites, red; axon, blue) recorded during passive rotation. Scale bar: 100 µm. Right, close-up magnifications of the cell’s soma (red, top panel) positive for calbindin immunoreactivity (green, middle panel) and overlay (bottom panel). Scale bar: 20 µm. (B) Angular HD (top) and angular speed (bottom) as a function of time. Spikes (red dots) are indicated. (C) Polar plots showing firing rate as a function of HD for the neuron in (A). Peak firing rate is indicated. (D–F) same as A–C but for a representative -negative L2 neuron. Scale bars in D: 100 µm (left) and 10 µm (right).
