Abstract
An NAD+-dependent enzymatic sensor with biofuel cell power source system for non-invasive monitoring of lactate in sweat was designed, developed, and tested. The sensor component, based on lactate dehydrogenase, showed linear current response with increasing lactate concentrations with limits of detection from 5 to 100 mM lactate and sensitivity of 0.2 µA.mM−1 in the presence of target analyte. In addition to the sensor patch a power source was also designed, developed and tested. The power source was a biofuel cell designed to oxidize glucose via glucose oxidase. The biofuel cell showed excellent performance, achieving over 80 mA at 0.4 V (16 mW) in a footprint of 3.5 × 3.5 × 0.7 cm. Furthermore, in order to couple the sensor to the power source, system electronic components were designed and fabricated. These consisted of an energy harvester (EH) and a micropotentiostat (MP). The EH was employed for harvesting power provided by the biofuel cell as well as up-converting the voltage to 3.0 V needed for the operation of the MP. The sensor was attached to MP for chronoamperometric detection of lactate. The Sensor Patch System was demonstrated under laboratory conditions.
Performance tracking technologies have become extremely popular over the past several decades. Most rely on sensing of physical attributes such as heart rate, body temperature, calories burned, or steps taken. There is a significant push to develop technologies that can accurately monitor the change in biomarkers non-invasively from biological fluids, such as sweat.
The concept of utilizing biological fluids to access biomarkers is not new.1 Numerous studies have been performed employing a variety of methods for detection of ions,2–4 lactate,5 glucose,6 ethanol,7 and other biomarkers in sweat. Additionally, investigations into correlation between sweat expressed biomarker and their blood levels have been conducted.8,9 Other biological fluids, such as urine, saliva, and tears, have also been investigated for their potential use in human performance sensing.10–14
Lactate is a key biomarker of stress and indicator of the health state of an individual. Lactate is a product of both anaerobic and aerobic glucose metabolism, via glycolysis and plays an important role in maintaining cellular and tissue homeostasis.15 At the cellular level, energy production (in the form of ATP) occurs through the break down of glucose to pyruvate (oxidized lactate), through glycolysis yielding 2 ATP, followed by either transport to the mitochondria for further processing through the citric acid cycle and oxidative phosphorylation (OxPhos, producing 36 ATP per 1 glucose) or reduced to lactate for storage of fuel. Under stress conditions, glycolysis responds by rapidly producing large amount of pyruvate greater than that what the mitochondria can sustain resulting in an inhibitory accumulation of pyruvate. To prevent negative feedback inhibition excess pyruvate is then converted to lactate and exported into the blood for transport to other tissues for processing or storage. This increase of lactate levels in the blood can correlate to lactate levels in extracorporeal liquids including saliva, urine and sweat.5,9,16,17 Additionally, the increase of blood lactate levels as a response to stress and the commercial availability of redox-active lactate oxidizing enzymes makes following this chemical reaction system attractive for development of sensing technology for the monitoring of human performance.
Amperometric biosensors are known to be inexpensive, reproducible, sensitive, selective, and typically composed of chemically modified electrode material and biological recognition elements (BRE).16 The most widely used BRE for amperometic lactate sensing are oxidoreductase enzymes that catalyze the oxidation or reduction of a substrate. In regards to lactate sensing the most used redox enzymes are lactate oxidase followed by NAD+-dependent lactate dehydrogenase (LDH). In general, oxidases catalyze an oxidation reaction in the presence of oxygen and water and yield a product and H2O2. In this case, the H2O2 is detected at the electrode surface. Dehydrogenases comprise the largest group of oxidoreductases and require an additional co-enzyme, NAD(P)+ that can be immobilized on the electrode or added to the buffer to catalyze the oxidation of the substrate.18 It is NAD(P)+ that is detected quantitatively at the electrode surface. A disadvantage of using these oxidoreductases is the need of high applied potentials to detect the oxidase electro-active product at the electrode surface or to regenerate the oxidized co-enzyme from the reduced form (NAD(P)(H)). The high applied potentials introduce interferences from the oxidation of contaminating species within the solution. To overcome the overpotential, the electrode surface can be modified with mediator like Prussian Blue or polymethylene green (PMG).19–22
With ever-increasing interest in monitoring human performance a significant amount of research has been conducted in the area of wearable sensor development that employ close bodily contact.23–27 Metabolite sensing through Band-Aid like RFID sensor patches and temporary tattoo-based sensors have been developed for electrolyte and lactate sensing in sweat as part of on-body sensing technology.27–29
To date the main focus was on the development of a sensor, discounting the need for a power source to operate the sensor, and to communicate the sensor information. In the majority of the cases a simple coin cell battery could be employed as a power source. Others have looked at utilizing flexible solid state batteries. One main disadvantage of using traditional power sources for sensor operation is their short operational lifetime, which is related to limited amount of active material and excess of packaging material to overcome safety concerns.
Accessibility and popularity of smart phones has influenced a move toward production of sensor technology that reads and transmits data wirelessly by Android smart phone and custom-apps.27 A major problem of wireless sensors is the requirement for electronic power to run individual sensors in a sustainable and maintenance-free way.30 Using batteries to supply power is impractical as multiple sensor networks would likely be used and replacing individual batteries would be a tremendous task along with the toxicity of material from batteries that would require recycling of the batteries to reduce unfriendly ecosystem hazards.30 Alternative, green energy technologies are necessary to supply the demands for sensors, nanarobotics, microelectronic networks, and wearable electronics.31
An alternate battery-free solution comes in a form of a biofuel cell (BFC), which utilizes a biomimetic approach to power generation employing commonly available, safe, and energy dense fuels such as glucose. The idea of enzyme-based biofuel cells for self-powered biosensors was first discussed in 2001 and has gained momentum in recent years.32–34 Information technology has impacted the trends of economic development in the last 20 years.30 If trends continue then development of self-powered sensing systems may have an impact on the world economy.30
Here we present a complete wearable system, designed for lactate sensing in sweat. The overall system is comprised of a lactate biosensor,35,36 a glucose oxidase BFC power source, an energy harvester and a micropotentiostat. The following sections describe the development of individual components, component combination into an integrated system, and system performance.
Experimental
Apparatus
All electrochemical experiments were conducted with a three-electrode setup using a conventional potentiostat: Biologic Model 1:VMP3 multichannel potentiostat/galvanostat. All potentials are reported versus standard Ag/AgCl reference electrode. The potential readings taken from the patch sensor electronic components were measured with a 179 TRUE RMS Fluke multi-meter.
Materials and chemicals
Carbon Felt of 1.27 cm thickness (99% purity) and carbon yarn (woven from 0.076 mm dia. fibers) were acquired from Alfa Aesar (Ward Hill, MA). Multi-walled carbon nanotubes of 10–20 nm dia. (>95 wt% purity) were purchased from cheaptubes.com (Cambridgeport, VT). Multiwall carbon nanotube paper (BP) (60 gsm, C-grade) was purchased from NanoTech-Labs, (Yadkinville, NC).
Potassium nitrate, methylene green zinc chloride double salt, urea, and tetramethyl orthosilicate (TMOS) were purchased from Sigma Aldrich (St. Louis, MO). Monobasic and dibasic potassium phosphate salts, monobasic and dibasic sodium phosphate salts, sodium hydroxide, L-lactic acid, D-glucose, ammonium hydroxide, nicotinamide adenine dinucleotide trihydrate (NAD), 1-(3-Dimehylaminopropyl)-3-ethylcarbodiimide-hydrochloride (EDC), N-hydroxysuccinimide (NHS), 2,5-dimethyl-1-phenylpyrrole-3-carboxaldehyde (Di-Carb), ethanol, dimethyl sulfoxide, and isopropyl alcohol were obtained from VWR (Radnor, PA). Pyrenebutanoic acid, succinimidyl ester (PBSE) was purchased from Setareh Biotech LLC. Sodium chloride and hydrochloric acid were obtained from Fisher Scientific (Pittsburgh, PA). All chemicals were utilized as received.
Lactate dehydrogenase (LDH, rabbit muscle, 290 U/mg, Calzyme Laboratories Inc.) and glucose oxidase (GOx, Aspergillus Niger, 100–250 KU/g, Sigma-Aldrich) were employed for enzymatic electrode fabrication. Silver ink from Ted Pella Inc. (Redding, CA), was utilized for patch sensor reference electrode preparation.
Sensor development
Sensor patch design was based on a three-electrode principle, including an enzyme-based BP working electrode (WE), a Ag/AgCl reference electrode (RE) and BP counter electrode (CE).
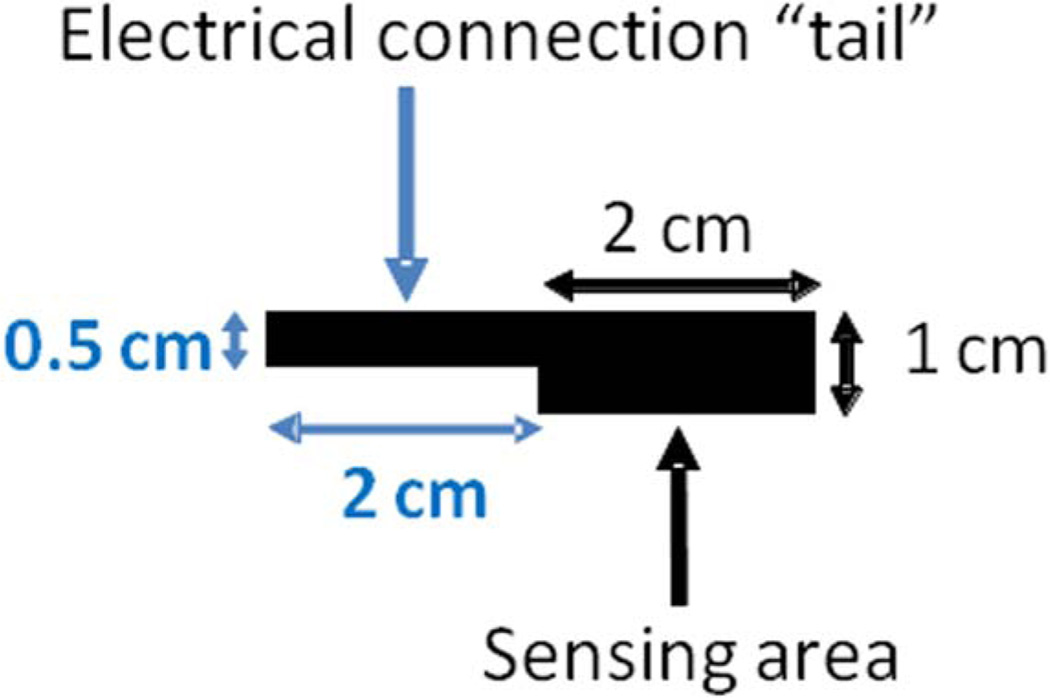
WE was fabricated employing BP, cut into 2 cm2 pieces with 2 cm long “tail” for contact (Figure 2). The electrode was rinsed with isopropyl alcohol, followed by D.I water rinse, prior to being submerged in polymerization solution. The polymerization solution contained 0.5 mM methylene green and 0.1 M potassium nitrate, dissolved in 50 mM potassium phosphate buffer of pH 7. This solution was employed for the electrochemical deposition of polymethylene green (PMG) onto the surface of the WE as outlined by Narvaez Villarrubia et al.20 with slight modifications. Briefly, the polymerization solution was degassed for 15 minutes with N2 prior to polymer deposition. PMG deposition was achieved via cyclic voltammetry (CV) technique by cycling the applied potential from −0.5 to 1.3 V at a scan rate of 50 mV/s for 10 cycles. The PMG modified electrode was then rinsed with D.I. water in order to remove any unpolymerized methylene green and allowed to dry under ambient laboratory conditions.
Figure 2.
A schematic of BP working electrode geometry.
An enzymatic ink was prepared by employing CFDRC proprietary CNT ink formulation mixed with LDH, such that the enzyme loading was 13 mg/mL. The enzymatic ink was gently vortexed for several minutes to facilitate complete mixing of all components and deposited onto the surface of the PMG-treated WE, such that the ink loading was 0.12 mL/cm2. Final step in sensor WE fabrication was the vapor deposition of TMOS layer following procedure developed by Narváez Villarrubia et al.37
Fabrication of custom Ag/AgCl RE utilized silver ink coated carbon yarn. A piece of yarn of 5.5 cm was cut from the bulk material. One end of the yarn strand (2 cm) was coated with fast drying silver ink (75 µL) and was allowed to dry for at least 2 hours. Next, a layer of AgCl was electrodeposited onto the silver ink-coated portion of the yarn by DC voltage pulsing. The carbon yarn was placed into 20 mL of 2 M HCl, such that only the silver coated tip was submerged, and connected to the positive terminal of the DC power supply. A platinum wire coil, utilized as the counter electrode, was connected to the negative terminal of the DC power supply. A 12 V pulse was applied for 10 seconds, with a 5 second rest period, four times for a total time of 60 seconds including the 5 second rest periods. The Ag/AgCl carbon yarn reference electrode was then removed from the deposition solution, rinsed with DI water and allowed to dry for approximately 1 hour. Custom RE was tested versus a standard Ag/AgCl reference electrode giving a potential of approximately 3.5 mV.
The counter electrode for the sensor patch was fabricated by employing the same BP material as for the WE. A piece, at least double in size as the WE, was cut from the bulk material. It was rinsed with isopropyl alcohol, followed by a D.I. water rinse and a drying period. No further modifications were applied to the CE.
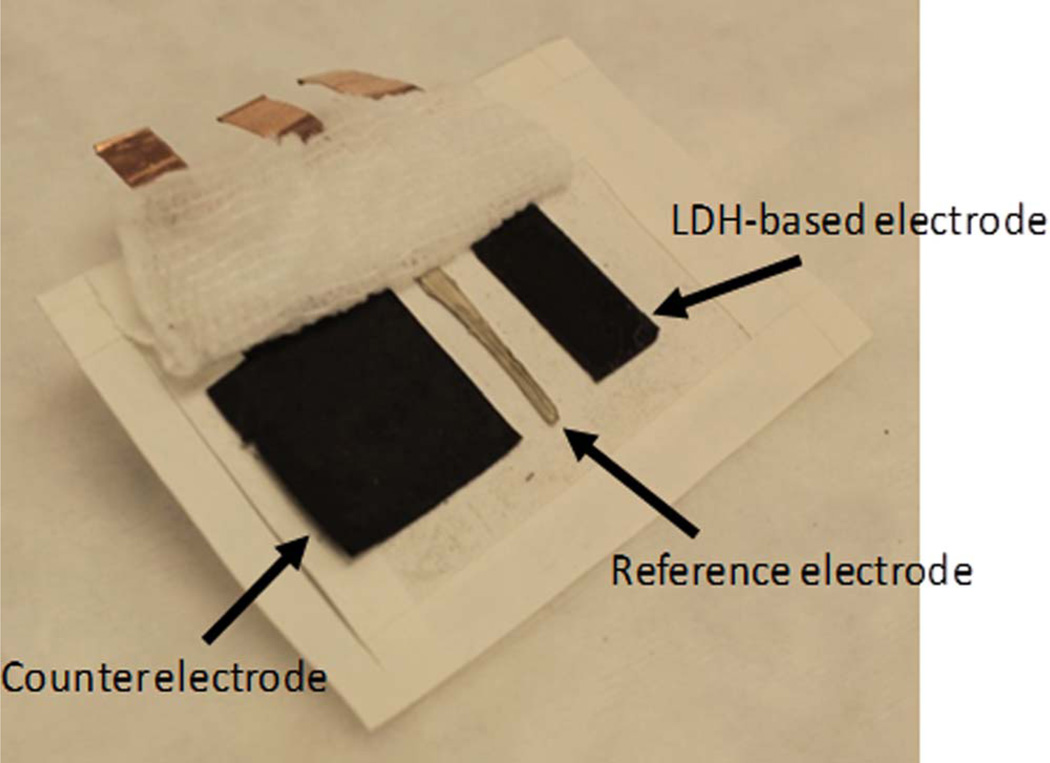
The three electrodes were deposited onto a medical adhesive tape (WL5003, NINGO WELLMEDLAB CO, LTD), such that the spacing between the electrodes was 0.5 cm, and covered by a commercial gauze bandage (Figure 1). The patch dimensions were 7.5 × 5 × 0.01 cm with a total weight of 1.7 grams. The gauze was pre-wetted with artificial sweat (AS) solution, containing 0.86 mM NaCl, 17 mM urea, 0.1 mM glucose and 10 mM NAD+ in 0.1 M phosphate buffer of pH 6.5. Artificial sweat solution was used within three hours of preparation.
Figure 1.
Image of the patch sensor configuration on sports tape and gauze folded back. Dimensions: 7.5 × 5 × 0.01 cm. Weight: 1.7 grams. Counter, reference and working electrodes are shown from left to right.
Chronoamperometry was employed for testing the sensor, where 0.3 V was applied to the WE and current was monitored as a function of lactate concentration. Prior to the lactate additions, the sensor was allowed to equilibrate for approximately 5 minutes until a stable baseline was reached. Next, aliquots of 200 mM lactic acid solution, prepared in AS, were added to the surface of the sensor patch. Aliquots of increasing volume were dropped evenly on the surface of the gauze over the entire patch in order to gradually increase the lactate concentration being detected by the sensor. Aliquot additions were approximately 2 minutes apart. All testing was performed in triplicate (N = 3).
Power source development
The overall sensor system required a power source for operation. This component was designed around the use of a BFC based on glucose oxidation. The BFC was comprised of an anode, modified with glucose oxidase, and an oxygen reducing cathode.
The anode was fabricated from carbon felt (CF) material. The CF was cut into a 3 cm square with a thickness of 0.25 cm. Next the anode was plasma treated for 5 minutes, then rinsed with IPA and D.I. water, and dried under ambient laboratory conditions. GOx-based ink was prepared similarly to LDH ink, where the enzyme loading was 37.8 mg/mL. A total volume of 0.85 mL was casted over the entire surface of the plasma-treated CF electrode. Enzymatic electrode was stored at 4°C for a minimum of 12 hours and was allowed to equilibrate to ambient temperature prior to use in BFC set-up.
Oxygen reducing cathodes were prepared from Prussian Blue (PB), following the procedure developed by Addo et al.19 The PB paste was packed into the graphite plate and sealed by a Nafion membrane. The cathode was used immediately after fabrication.
The BFC was assembled by combining the GOx anode and PB cathode in a specially designed patch cell hardware (Figure 3). A piece of platinum wire was placed at the bottom on the anodic chamber to provide electrical contact with the GOx electrode. The PB cathode was then placed over the anode, such that the Nafion membrane was in direct contact with the anode surface. Initially, clips were employed to hold BFC assembly together, later to be replaced by gluing procedure. A 4 cm strip of one-sided adhesive copper tape was used to contact the cathode. The cell was filled with 1 M glucose/10 mM hydroquinone solution prepared in 0.245 M phosphate buffer of pH 7. The cell was connected to a potentiostat via battery configuration: cathode as the WE, anode as CE. Constant load discharge (CLD) technique was employed for BFC testing. A series of resistance loads ranging from 5 MΩ to 1 Ω were sequentially applied to the cell, while both potential and current were monitored as a function of time. The obtained data was utilized to generate power/current density plots.
Figure 3.
Image of the biofuel cell. Dimensions: 3.5 × 3.5 × 0.7 cm. Weight: 8.3 grams.
Component integration and system demonstration
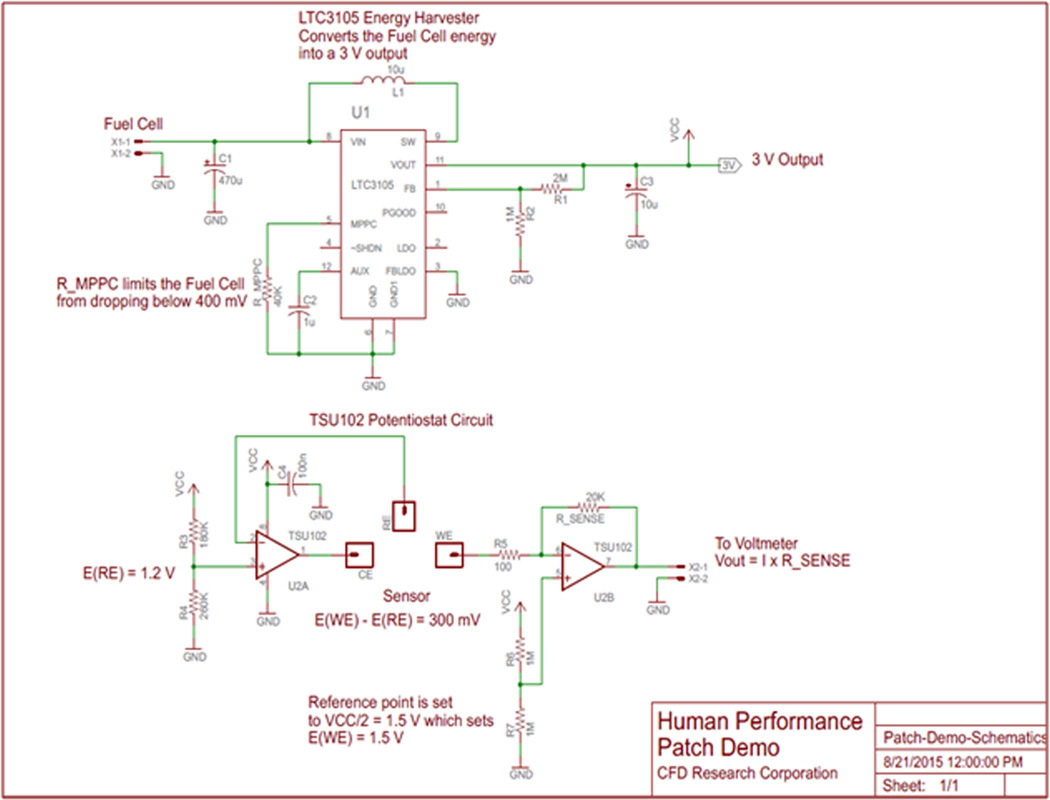
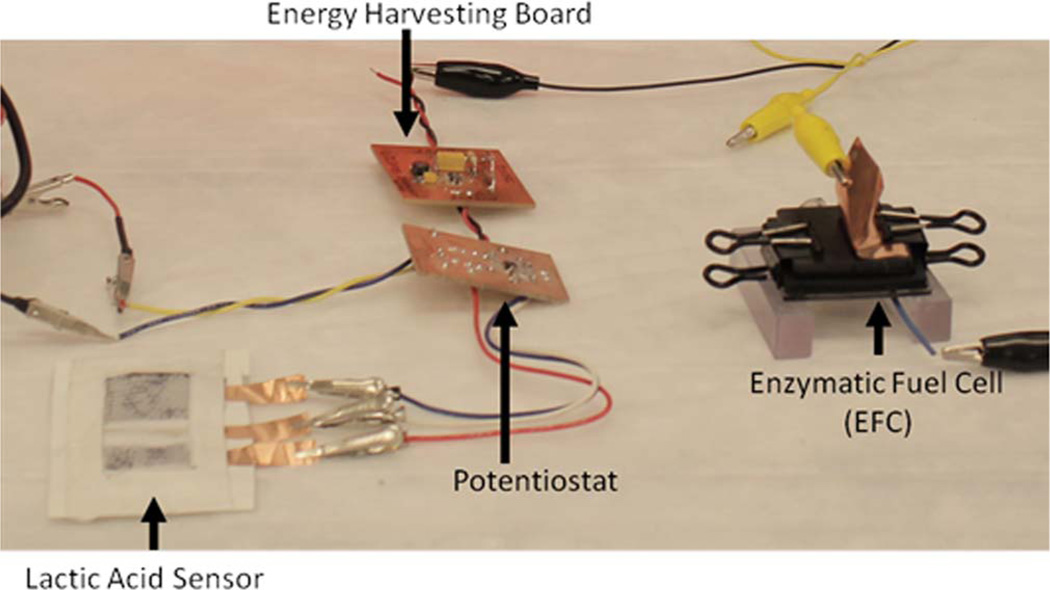
Two electronic sub-circuits were developed in order to construct a complete sensor system: an energy harvester (EH) and a micropotentiostat (MP). The EH circuitry was specifically designed for up converting the BFC voltage to 3 V and was built around LTC3105 (Linear Technology), a high-efficiency step-up DC/DC converter (Figure 4). A 40 kΩ resistor connected to the maximum power point control input of LTC3105 limits the BFC voltage from dropping below 400 mV thus maintaining peak BFC performance. The output of the EH was employed to power the op-amps necessary for MP operation. The MP circuitry was designed for operating the lactate sensor patch using TSU102 dual op-amp (ST Microelectronics) IC. One half of the TSU102 dual op-amp was setup as a control amplifier and was used to supply proper current at the patch sensor counter electrode to maintain the patch sensor reference electrode at 1.2 V. The other half of the dual op-amp was setup as a current-to-voltage converter and was connected to the patch sensor working electrode. The reference point for the -current-to-voltage converter was set to 1.5 V, which set the working electrode voltage at 1.5 V. Thus, the potentiostat circuitry maintained the potential difference between the working and reference electrodes at 300 mV. The current generated upon lactate detection was converted to a voltage signal using a 20 kΩ sense resistor. The voltage output was measured by a multimeter. The complete system set-up is shown in Figure 5. The BFC was connected to the EH while the sensor patch was connected to the MP, constructing one complete test system. The system was tested extensively for performance, reproducibility and extended run time.
Figure 4.
Schematics of energy harvester (EH) (Top) and micropotentiostat (MP) circuitry (Bottom).
Figure 5.
Complete human performance patch sensor system. Lactic acid sensor, electronic components and biofuel cell are shown left to right.
Results and Discussion
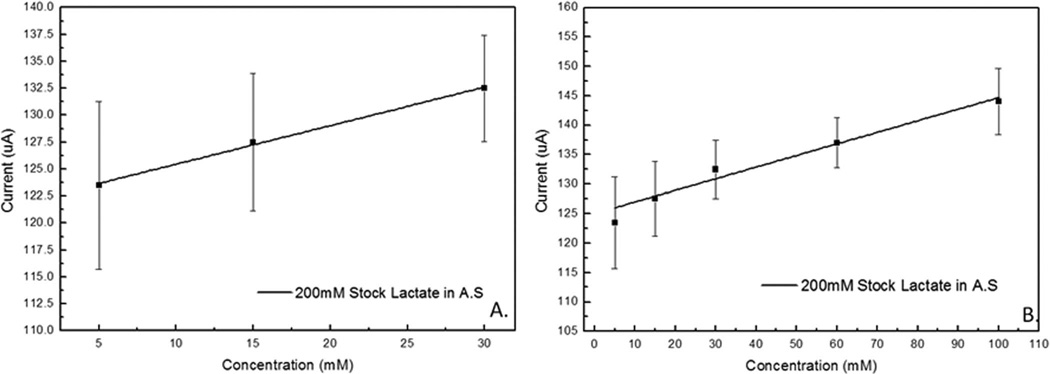
Overall sensor performance in AS solution is shown in Figure 6. Based on results obtained from standard laboratory potentiostat the sensitivity was calculated to be 0.2 µA.mM−1 with a standard error of 0.02 µA.mM−1 with an applied potential of 0.3 V vs. Ag/AgCl electrode. A linear fit tool in Origin software was used to calculate the linear equation for the calibration curve to lactate concentration as
| [1] |
When analysis of the first three aliquots (5, 15, and 30 mM) was performed, a slightly higher sensitivity of 0.36 µA.mM−1 with a standard error of 0.018 µA.mM−1 was observed. As described for Eq. 1, the linear calibration curve was similarly calculated as
| [2] |
Figure 6.
Lactate calibration curve for LDH patch sensor tested with artificial sweat solution. A) Linear fit of patch sensor response for working lactate concentration range of 5–30 mM, and B) linear fit of patch sensor response for extended lactate concentration range of 5–100 mM.
Sensor performance was evaluated with respect to analyte of choice (lactate) as well as possible interfering component of sweat (urea), reported in a corresponding article.35,36 The performance was additionally evaluated as a function of electrolyte salt content. The response variation between low and high ionic strength electrolyte solutions which cover the range of the salt content in physiological sweat samples was insignificant.35,36 The sensor showed linear response as a function of lactate concentration in the three pHs studied (5, 6, and 7).35,36
The results for the patch BFC testing (Figure 7) showed achievable power of over 16 mW for a BFC that was only 3.5 × 3.5 × 0.7 cm with a total weight of 8.3 grams. When the results were compared to the standard laboratory hardware prototype, which is significantly thicker and employs dual cathode set-up, it was determined that practically identical performance was achieved. A self-powered lactate biosensor based on lactate oxidase33 reported by Hickey et al. produced 122 µW.cm−2 which is considerably lower than the fuel cell described herein but also tailored to the detection of lactate in low concentrations of less than 20 mM such as tears, urine and serum with a sensitivity of 45 ± 6 µA.cm−2 mM−1 from 0–5 mM lactate. The system mentioned by Hickey et al. is fundamentally different as it is a self-powered sensor whereas here we describe a sensor powered by a separate chemical reaction in the glucose oxidase BFC resulting in a “hybrid” design. To the extent of our knowledge no other lactate sensor has been powered by a BFC. The system allows for detection of lactate above 20 mM which is common in undiluted sweat.33 It is worth noting that although sweat can exceed concentrations of 20 mM, the current patch sensor design is calibrated to account for dilution. As sweat absorbs into the gauze of the patch sensor, concentration varies and a buildup of sweat at the sensor would result in dilution. By testing the patch with increasing aliquot volume we may see this effect built into the linear calibration curve and further calibrated when on-body trials are conducted. The idea here would be to incorporate functionality of the patch sensor device so that each individual may calibrate the device to their baseline value. This is possible thanks to the renewable power supply provided from the BFC and integrated circuitry (EH and MP), a concept yet to be tested in real time application, but certainly achievable by utilizing commonly available tech such as mobile phone apps and wireless transmission as previously mentioned.
Figure 7.
Representative total power and current curves of patch biofuel cell tested in 1 M glucose, 10 mM hydroquinone, 0.245 M sodium phosphate buffer, pH 7.5.
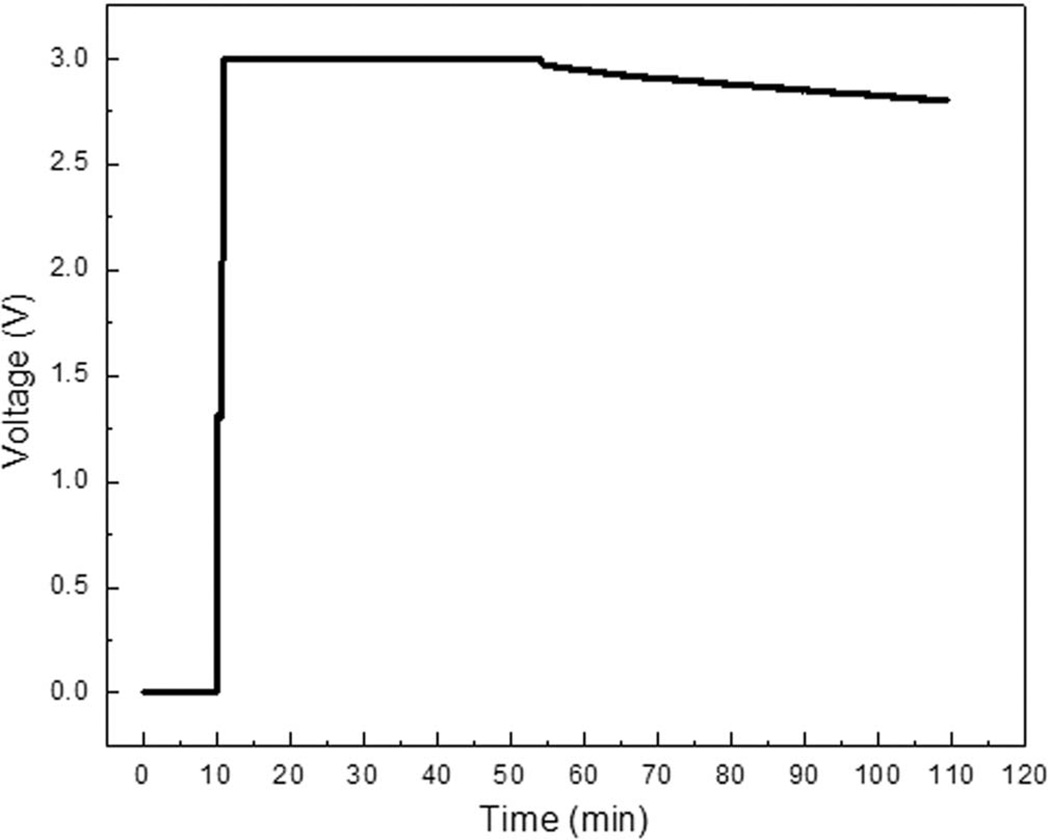
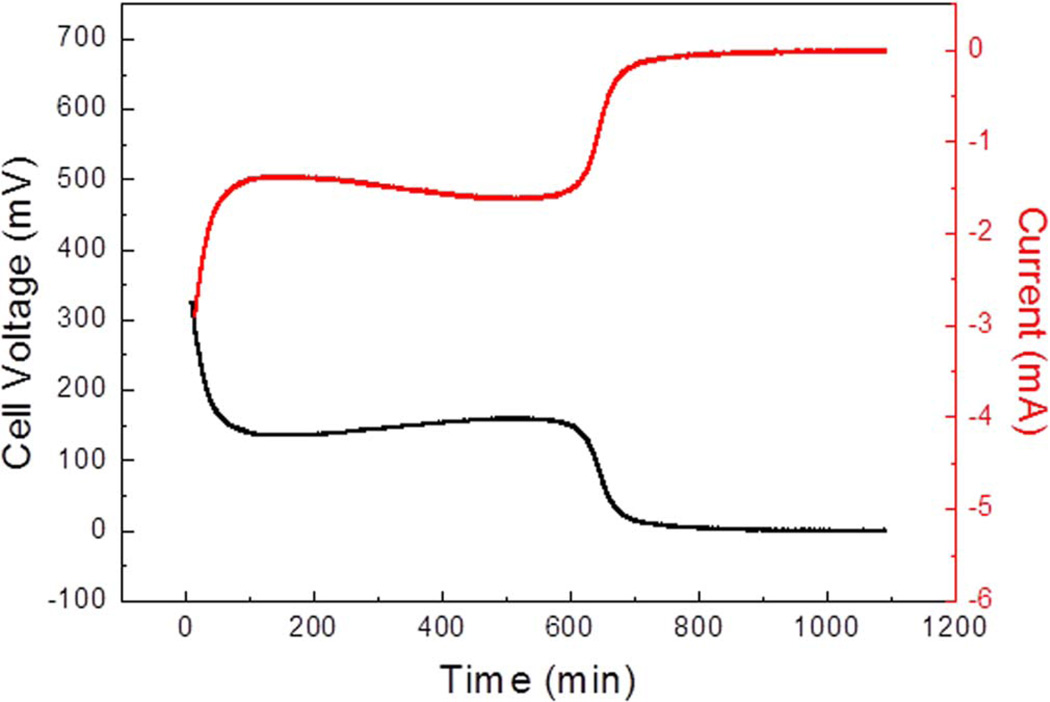
The patch cell proved capable of powering the EH for 100 minutes. The first 45 minutes resulted in minimal drop of potential. Following the 45-minute period, a slight drop was observed for the subsequent 55 minutes until potential dropped below the 2.8 V threshold (Figure 8). Below 2.8 V the MP may no longer be adequately powered by the BFC powered EH. Finally, the BFC was tested against a 100 Ω load in order to simulate the long-term operation of the patch sensor. The specific load was chosen based on the voltage and current required to operate the MP and patch sensor. The results indicated that the BFC could sustain said load for approximately 600 minutes (Figure 9).
Figure 8.
Representative energy harvester output voltage powered by BFC.
Figure 9.
BFC operation under a 100 Ω resistance load.
The demonstration was conducted following a procedure similar to aforementioned lab tests in artificial sweat. A pre-wetted sensor patch was connected to the BFC via the EH/MP components. A multimeter was attached to the signal output connection on the MP for signal read-out. Upon completing the appropriate connections the system was allowed to equilibrate for 15 minutes prior to the addition of lactate solution to the sensor’s surface. This was done in order to establish a baseline for the sensor (2.075 V).
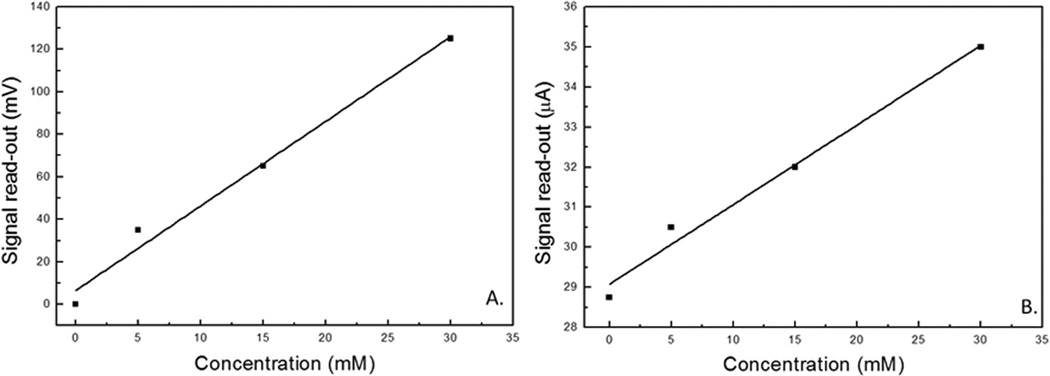
The stock lactate testing solution was prepared utilizing D.I. water as solvent with 200 mM lactate concentration. This was done due to poor stability of the AS solution over time, requiring its immediate use. The water-based stock lactate solution could be employed over a longer time period. Demo performance analysis showed comparable results to individual sensor patch testing over the same concentration range (5–30 mM), regardless of the type of electrolyte solution being utilized (water-based or AS). Sensor sensitivity was determined to be 3.9 ± 0.33 mV.mM−1 (Figure 10). Sensor read-out was converted to voltage for the purposes of the demonstration and is plotted showing a linear trend (Figure 10). Because the resistance of the output from the MP is known (20 kΩ) the representative potential output of the sensor can be converted back to current in the fully assembled BFC powered sensor configuration. The response current is shown (Figure 10B) and has a linear response described by
| [3] |
Figure 10.
Representative LDH patch sensor response tested over the lactate concentration range between 5 and 30 mM: A) normalized sensor response as tested (represented as voltage change, mV) and B) sensor response converted to current output (µA).
This result indicates that the sensitivity (0.2 µA.mM−1) from the calibration curve derived from a standard potentiostat matches the sensitivity obtained from the BFC powered MP. Sensor read-out was converted to voltage for the purposes of the demonstration.38
Conclusions
The design presented describes a patch sensor with 0.2 µA.mM−1 sensitivity for monitoring lactate levels in sweat over prolonged periods of time, non-invasively, powered by a 16 mW BFC. Combined, the 7.5 × 5 cm patch sensor and 3.5 × 3.5 cm BFC occupy a modest 49.75 cm2 area. Integrated circuits allow energy generated from glucose to be converted and utilized so that a real time measurement for lactate in artificial sweat can be transmitted.
In this study lactate dehydrogenase enabled the detection of the specified substrate. The advantage of using enzymes for sensing applications is their substrate specificity which in turn makes the application of this sensor expandable to other metabolites through the incorporation of multiple enzymes. For instance glucose, another prominent component of sweat, can be simultaneously detected by a multi-enzymatic sensor, which can lend additional valuable information on the condition of the body. The growing interest in monitoring of this type of information is driven by the benefits of the level of detection reported here, which can ultimately lead to physical performance evaluation and injury prevention. Hence further development of current system design is anticipated and will include: enhancement of sensor capability to detect multiple analytes, utilization of alternate fuels for BFC to further increase operation time, employment of flexible substrate circuitry enabling an ultra compact geometry, and incorporation of wireless data transfer capabilities so that a more complete real time health monitoring device may be realized.
Acknowledgments
This work has been supported at CFDRC by funding through AFRL SBIR Program. Additional thanks go to Erica Pinchon and Ulf Lindstrom from CFDRC and Dr. Sofia Babanova from University of New Mexico for their efforts, support and guidance during program execution. Finally, a special thanks to the NIH for the Institutional Research and Academic Career Development Award (IRACDA) K12 GM088021, which provided funding for Dr. Figueroa-Teran during this study.
References
- 1.Sonner Z, et al. The microfluidics of the eccrine sweat gland, including biomarker partitioning, transport, and biosensing implications. Biomicrofluidics. 2015;9(3):031301. doi: 10.1063/1.4921039. [DOI] [PMC free article] [PubMed] [Google Scholar]
- 2.Balfe A, et al. In: The biochemistry of body fluids. McGing P, KR O, O’Meara Y, editors. 2009. p. 36. [Google Scholar]
- 3.Consolazio CF, et al. Excretion of sodium, potassium, magnesium and iron in human sweat and the relation of each to balance and requirements. Journal of Nutrition. 1963;79:407. doi: 10.1093/jn/79.4.407. [DOI] [PubMed] [Google Scholar]
- 4.Bandodkar AJ, et al. Epidermal tattoo potentiometric sodium sensors with wireless signal transduction for continuous non-invasive sweat monitoring. Biosensors and bioelectronics. 2014;54:603. doi: 10.1016/j.bios.2013.11.039. [DOI] [PubMed] [Google Scholar]
- 5.Sonner Z, et al. The microfluidics of the eccrine sweat gland, including biomarker partitioning, transport, and biosensing implications. Biomicrofluidics. 2015;9(3):031301. doi: 10.1063/1.4921039. [DOI] [PMC free article] [PubMed] [Google Scholar]
- 6.Jadoon S, et al. Recent Developments in Sweat Analysis and Its Applications. International journal of analytical chemistry. 2015;2015:1. doi: 10.1155/2015/164974. [DOI] [PMC free article] [PubMed] [Google Scholar]
- 7.Mena-Bravo A, de Castro ML. Sweat: a sample with limited present applications and promising future in metabolomics. Journal of pharmaceutical and biomedical analysis. 2014;90:139. doi: 10.1016/j.jpba.2013.10.048. [DOI] [PubMed] [Google Scholar]
- 8.Patterson MJ, Galloway SD, Nimmo MA. Variations in regional sweat composition in normal human males. Experimental Physiology. 2000;85(6):869. doi: 10.1111/j.1469-445x.2000.02058.x. [DOI] [PubMed] [Google Scholar]
- 9.Derbyshire PJ, et al. Lactate in human sweat: a critical review of research to the present day. The Journal of Physiological Sciences. 2012;62(6):429. doi: 10.1007/s12576-012-0213-z. [DOI] [PMC free article] [PubMed] [Google Scholar]
- 10.Marques AH, Silverman MN, Sternberg EM. Evaluation of stress systems by applying noninvasive methodologies: measurements of neuroimmune biomarkers in the sweat, heart rate variability and salivary cortisol. Neuroimmunomodulation. 2010;17(3):205. doi: 10.1159/000258725. [DOI] [PMC free article] [PubMed] [Google Scholar]
- 11.Oncescu V, O’Dell D, Erickson D. Smartphone based health accessory for colorimetric detection of biomarkers in sweat and saliva. Lab on a Chip. 2013;13(16):3232. doi: 10.1039/c3lc50431j. [DOI] [PubMed] [Google Scholar]
- 12.Lima DP, et al. Saliva: reflection of the body. International Journal of Infectious Diseases. 2010;14(3):e184. doi: 10.1016/j.ijid.2009.04.022. [DOI] [PubMed] [Google Scholar]
- 13.und Hohenstein-Blaul NvT, Funke S, Grus FH. Tears as a source of biomarkers for ocular and systemic diseases. Experimental eye research. 2013;117:126. doi: 10.1016/j.exer.2013.07.015. [DOI] [PubMed] [Google Scholar]
- 14.Pieragostino D, et al. Unraveling the molecular repertoire of tears as a source of biomarkers: Beyond ocular diseases. PROTEOMICS-Clinical Applications. 2015;9(1–2):169. doi: 10.1002/prca.201400084. [DOI] [PubMed] [Google Scholar]
- 15.Bakker J, Nijsten MW, Jansen TC. Clinical use of lactate monitoring in critically ill patients. Annals of intensive care. 2013;3(1):12. doi: 10.1186/2110-5820-3-12. [DOI] [PMC free article] [PubMed] [Google Scholar]
- 16.Nikolaus N, Strehlitz B. Amperometric lactate biosensors and their application in (sports) medicine, for life quality and wellbeing. Microchimica Acta. 2008;160(1–2):15. [Google Scholar]
- 17.Sakharov D, et al. Relationship between lactate concentrations in active muscle sweat and whole blood. Bulletin of experimental biology and medicine. 2010;150(1):83. doi: 10.1007/s10517-010-1075-0. [DOI] [PubMed] [Google Scholar]
- 18.Lobo MJ, Miranda AJ, Tuñón P. Amperometric biosensors based on NAD (P)-dependent dehydrogenase enzymes. Electroanalysis. 1997;9(3):191. [Google Scholar]
- 19.Addo PK, Arechederra RL, Minteer SD. Towards a rechargeable alcohol biobattery. Journal of Power Sources. 2011;196(7):3448. [Google Scholar]
- 20.Narvaez Villarrubia CW, et al. Methylene green electrodeposited on SWNTs-based “bucky” papers for NADH and l-malate oxidation. ACS applied materials & interfaces. 2011;3(7):2402. doi: 10.1021/am2003137. [DOI] [PubMed] [Google Scholar]
- 21.Karyakin AA, et al. Electropolymerized azines: Part II. In a search of the best electrocatalyst of NADH oxidation. Electroanalysis. 1999;11(8):553. [Google Scholar]
- 22.Al-Jawadi E, et al. NADH oxidation using modified electrodes based on lactate and glucose dehydrogenase entrapped between an electrocatalyst film and redox catalyst-modified polymers. Microchimica Acta. 2012;177(3–4):405. [Google Scholar]
- 23.Coyle S, et al. Wearable bio and chemical sensors. 2014 [Google Scholar]
- 24.Coyle S, et al. BIOTEX—Biosensing textiles for personalised healthcare management. Information Technology in Biomedicine. IEEE Transactions on. 2010;14(2):364. doi: 10.1109/TITB.2009.2038484. [DOI] [PubMed] [Google Scholar]
- 25.Matzeu G, Florea L, Diamond D. Advances in wearable chemical sensor design for monitoring biological fluids. Sensors and Actuators B: Chemical. 2015;211:403. [Google Scholar]
- 26.Morris D, et al. Applied Sciences on Biomedical and Communication Technologies, 2008. ISABEL’08. First International Symposium on. IEEE; 2008. Wearable technology for the real-time analysis of sweat during exercise. [Google Scholar]
- 27.Rose DP, et al. Adhesive RFID sensor patch for monitoring of sweat electrolytes. IEEE Trans. Biomed Eng. 2015:1457. doi: 10.1109/TBME.2014.2369991. [DOI] [PubMed] [Google Scholar]
- 28.Bandodkar AJ, Wang J. Non-invasive wearable electrochemical sensors: a review. Trends in biotechnology. 2014;32(7):363. doi: 10.1016/j.tibtech.2014.04.005. [DOI] [PubMed] [Google Scholar]
- 29.Jia W, et al. Electrochemical tattoo biosensors for real-time noninvasive lactate monitoring in human perspiration. Analytical chemistry. 2013;85(14):6553. doi: 10.1021/ac401573r. [DOI] [PubMed] [Google Scholar]
- 30.Wang ZL. Self-Powered Nanosensors and Nanosystems. Advanced Materials. 2012;24(2):280. doi: 10.1002/adma.201102958. [DOI] [PubMed] [Google Scholar]
- 31.Paradiso JA, Starner T. Energy scavenging for mobile and wireless electronics. Pervasive Computing, IEEE. 2005;4(1):18. [Google Scholar]
- 32.Katz E, Bückmann AF, Willner I. Self-powered enzyme-based biosensors. Journal of the American Chemical Society. 2001;123(43):10752. doi: 10.1021/ja0167102. [DOI] [PubMed] [Google Scholar]
- 33.Hickey DP, et al. A self-powered amperometric lactate biosensor based on lactate oxidase immobilized in dimethylferrocene-modified LPEI. Biosensors and Bioelectronics. 2016;77:26. doi: 10.1016/j.bios.2015.09.013. [DOI] [PubMed] [Google Scholar]
- 34.Zhou M, Wang J. Biofuel Cells for Self-Powered Electrochemical Biosensing and Logic Biosensing. A Review. Electroanalysis. 2012;24(2):197. [Google Scholar]
- 35.Figueroa-Teran R, et al. In: Non-invasive NAD-dependent biosensor for quantitative determination of lactate in sweat. In preparation, editor. 2016. [Google Scholar]
- 36.Figueroa-Teran R, et al. Non-invasive sensor for quantitative determination of lactate in sweat. The Electrochemical Society. 2015 [Google Scholar]
- 37.Narváez Villarrubia CW. Department of Chemical and Biological Engineering. University of New Mexico; 2014. Glucose/oxygen-based biofuel cell for biomedical applications: Electrdode designs integrating carbon composite nanomaterials; p. 175. [Google Scholar]
- 38.CFD Research Corporation. Human Performance Patch Deminstration. 2015 Available from: https://www.youtube.com/watch?v=kTqOQ6yJeU0. [Google Scholar]


