

Abstract
Chemical cross-linking in combination with mass spectrometry generates distance restraints of amino acid pairs in close proximity on the surface of native proteins and protein complexes. In this study we used quantitative mass spectrometry and chemical cross-linking to quantify differences in cross-linked peptides obtained from complexes in spatially discrete states. We describe a generic computational pipeline for quantitative cross-linking mass spectrometry consisting of modules for quantitative data extraction and statistical assessment of the obtained results. We used the method to detect conformational changes in two model systems: firefly luciferase and the bovine TRiC complex. Our method discovers and explains the structural heterogeneity of protein complexes using only sparse structural information.
Chemical cross-linking in combination with mass spectrometry (CX-MS) is increasingly being used in hybrid structural strategies to study the subunit topology and structure of native proteins and protein complexes, in particular for systems that are refractory to conventional structural-analysis techniques such as NMR spectroscopy and X-ray crystallography.
In a typical CX-MS experiment, an intact, native protein complex is chemically cross-linked in solution and then digested into peptides. The peptide mixture is enriched for cross-linked peptides, which are further analyzed by liquid chromatography–tandem mass spectrometry (LC-MS/MS)1,2. The sequences of cross-linked peptides are identified and statistically validated from corresponding fragment-ion spectra using recently introduced software tools3–7. Identified cross-linked residues represent distance restraints of the native substrate that are equal to or shorter than the extended length of the cross-linker. These distance restraints are then used in molecular-modeling approaches to determine structural features of the protein complex8,9.
So far, CX-MS has been used primarily to study the structure of protein complexes as static entities, providing structural information supporting the determination of the complex topology10,11, the structural organization12–14 or the localization of individual subunits15,16 in a complex. Because MS provides not only qualitative but also quantitative information, the development of CX-MS workflows that include quantitative information is an obvious next step that was partially realized in a study of the F-type ATPase complex17. The potential of quantitative CX-MS (qCX-MS) has been underexplored so far, mainly because of the lack of software tools that fulfill the specific requirements of qCX-MS data18. In the qCX-MS studies carried out to date, the signals indicating quantitative changes in cross-links were manually extracted and quantified19.
In standard bottom-up proteomics, multiple algorithms and methods have been described that determine or estimate the quantities of proteins or their relative abundance across samples20. Such methods are relatively straightforward and are well supported with readily accessible software tools21–23. In contrast, the quantification of cross-linked peptides in CX-MS experiments is considerably more complex, and at present there is no software available that supports such analyses end-to-end. The determination of unique distance restraints (here termed unique cross-linking site identifiers (uxIDs)) in CX-MS experiments frequently relies on a single cross-linked peptide identified in a single charge state. Further, the identification of cross-linked peptides in CX-MS often requires their enrichment from the total pool of peptides prior to their identification by MS24. Therefore, quantification algorithms suitable for CX-MS need to be able to link quantitative data from enriched fractions back to the original, unfractionated sample and to provide a statistical framework to support confident quantitative conclusions from the relatively sparse data of specific uxIDs across different states of a protein complex.
Here we introduce a generic and versatile computational framework supporting qCX-MS measurements derived from both stable-isotope-based and label-free quantification (LFQ) strategies. The xTract software encompasses a suite of algorithms that allows the automated processing and statistical validation of quantitative data from qCX-MS experiments. Our workflow for the targeted extraction and statistical validation of ion chromatograms (TeXaS) makes use of a unique target-decoy extraction strategy to validate extracted-ion chromatograms (XICs) of cross-linked peptides from MS data generated via data-dependent acquisition. For analysis of statistical significance, replicate experiments are used in combination with our tool xTract-analyzer, which we developed to meet the specific requirements of qCX-MS datasets. These open-source tools are publicly available at http://proteomics.ethz.ch and as Supplementary Software.
We applied our qCX-MS approach to the multidomain protein luciferase and the multisubunit protein complex TRiC (TCP-1 ring complex; also known as CCT (chaperonin containing TCP-1)). The method enabled the identification of local structural rearrangements, captured ligand-binding events and allowed us to discern higher-order structural states of large protein complexes.
RESULTS
Principles and main features of the software
Our integrated software system supports different qCX-MS workflows based on LFQ and differential isotopic labeling (Fig. 1).
Figure 1.
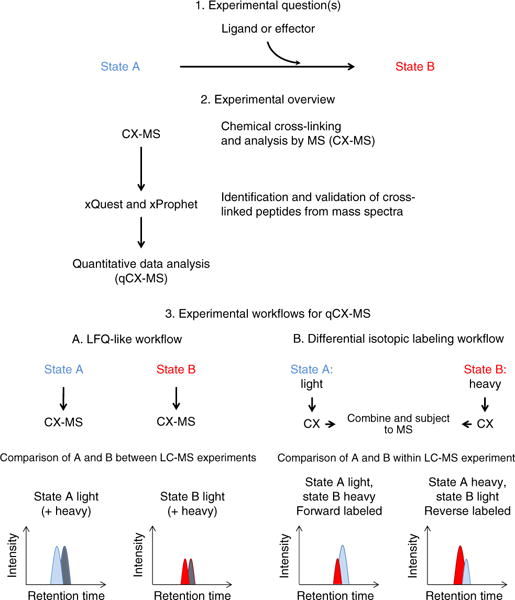
Experimental questions, overview and workflows for qCX-MS. Step 1 describes the experimental questions that can be addressed by qCX-MS. Step 2 shows the general workflow for qCX-MS. Step 3 describes the possible experimental workflows, LFQ-like and differential isotopic labeling. The LFQ-like workflow can be used either with both light and heavy cross-linkers or as a generic LFQ workflow with only a light cross-linker (peaks originating from the heavy cross-linker are indicated in gray).
The LFQ workflow operates similarly to an LFQ workflow used in conventional proteomics, where specific analytes are compared across different samples and MS runs via comparison of the respective ion-signal intensities.
The differential-isotopic-labeling workflow makes use of the availability of light and heavy isotope–labeled cross-linkers, such that one state can be cross-linked with one form of the cross-linker and the other with the other form. After processing, the differentially labeled samples are combined and analyzed jointly by LC-MS/MS.
Although the qCX-MS software relies on well-known principles of quantitative MS–based proteomics, specific features of qCX-MS measurements, such as the sparsity of data, the frequently low signal intensity of cross-linked peptide ions and the resulting data structure, required the development of qCX-MS–specific software tools.
First, unlike in the quantification of proteins in quantitative proteomics, where protein quantities are determined by the weighted integration of data from multiple peptides and different charge states, it frequently occurs that a cross-linked peptide is identified only in a single charge state. The software system therefore needs to be able to quantify peptides from single LC-MS measurements and to combine signals in cases where multiple charge states or multiple peptides representing the same restraint are available for a single uxID. In the latter case, the software combines the signals by summing up their peak areas.
Second, algorithms for protein quantification usually apply an exhaustive search for potential peptide ions in the space of m/z versus retention time in LC-MS/MS measurements and then map identified peptides onto identified isotope clusters of potential peptides21. This approach may lead to unassigned, undetected or mismatched low-intensity peptide ions. As cross-linked peptides are often present at low signal intensity, a sensitive approach for quantification is required, along with statistical validation of the identified XICs. To accomplish this, we developed a targeted extraction and statistical-validation algorithm for peptide ion chromatograms (TeXaS; Supplementary Fig. 1a,b).
To achieve high coverage and reliable detection of quantifiable cross-linked peptides at high sensitivity and high specificity, we developed a targeted extraction strategy that uses the identified cross-linked peptides along with the ‘coordinates’ of their identification (m/z, charge, retention time and sequence) from one measurement as a starting point and aims to extract all identified peptides from all measurements of a specific experiment. To estimate the false discovery rate (FDR) as q-values of the XICs, we developed several scores to assess the confidence of the extracted peak groups (Online Methods) and transformed the resulting extraction data to a selected reaction monitoring–like data structure. Using a target-decoy approach for the extraction allowed us to validate the XICs using the previously described mProphet workflow25 (Supplementary Fig. 1c–e). This quality-control procedure is important to (a) estimate the FDR (q-value) of the XIC peak groups and (b) determine the cutoff q-value for the selection of peak groups where the sensitivity reaches its maximum (ideally 1). This step is necessary to avoid misclassification of true positive peak groups as zero values (false negatives). Once peak groups for uxIDs have been extracted and validated, it is necessary to combine the XICs to infer substrate quantities present prior to sample fractionation. Thus uxIDs present in multiple fractions are summed, or, optionally, the maximum value is picked for further analysis. The combined intensities of the different states of a qCX-MS experiment are then used to probe the differences for statistical significance (xTract-analyzer; Online Methods). We implemented this procedure for both workflows (LFQ-like and differential isotopic labeling) considering the specific data structures.
Software benchmarking
To optimize the algorithms and demonstrate their performance, we generated a gold-standard data set of cross-linked peptides from three purified proteins for the LFQ-like and differential isotopic label–based workflows by generating defined dilution series of cross-linked proteins and peptides, respectively (Supplementary Table 1).
The dilution-series experiment led to the identification of 179 unique intraprotein cross-links, corresponding to 148 uxIDs (Supplementary Table 2); the overlap between the workflows was 67% (Supplementary Fig. 2), and the cross-links were validated against high-resolution X-ray structures (Supplementary Fig. 3). Measured quantitative values from these samples were then compared to the actual values (Supplementary Fig. 4 and Supplementary Table 3). Both workflows showed very good agreement with each other and the expected values. The analysis showed that >75% of the cross-linked peptides were successfully quantified (Supplementary Results 1). In summary, our results show that both quantification strategies generated similar and accurate quantification results, even for low-intensity cross-linked peptides.
Detection of conformational change in firefly luciferase
We next used the qCX-MS method to determine quantitative differences in cross-linked peptides isolated from the well-characterized firefly luciferase (Photinus pyralis). The reaction mechanism of this enzyme is well studied26, and it has been shown that a domain rearrangement drives the enzyme from its inactive to its active conformation. These two states differ by a ~140° rotation of the C-terminal domain during a two-step catalytic reaction that ultimately produces light (Fig. 2a). The availability of structural models that capture this domain rearrangement makes luciferase an ideal system for evaluating the qCX-MS strategy. Specifically, high-resolution crystallographic structures are available for the apo configuration of luciferase (PDB 1LCI; ref. 27) and for the active configuration that capture the C-terminal domain movement of the enzyme (PDB 4G36 and PDB 4G37; ref. 28).
Figure 2.
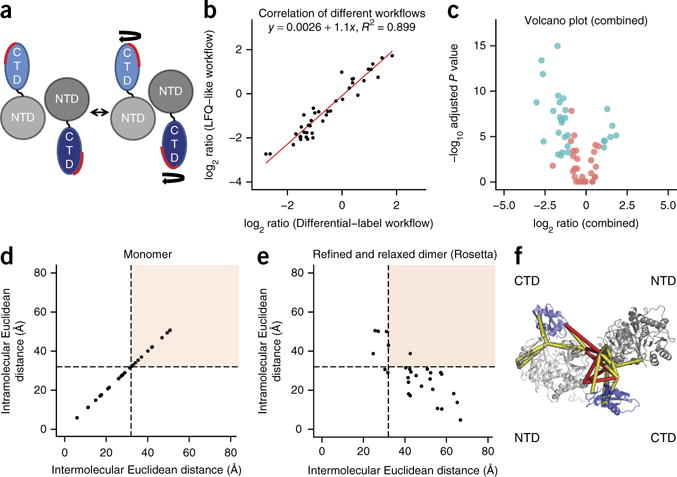
Dimer assembly of luciferase and qCX-MS analysis. (a) Schematic representation of the active luciferase dimer. NTD refers to the N-terminal domain (gray), and CTD refers to the C-terminal domain (blue). (b) Correlation between LFQ-like and differential isotopic labeling workflows. Shown are the log2 ratios of cross-links that were quantified in both experiments (n = 41). (c) Volcano plot for the combined LFQ-like and differential isotopic labeling workflow. In the volcano plot, the log2 ratios are plotted against the adjusted negative log10 P values. Color indicates whether the observed changes are significant (blue) or not (red) (adjusted P value < 0.01 and absolute log2 fold change > 1). The log2 ratios are shown with the apo experiment used as a reference. (d) Euclidean distances of the cross-links identified by the apo experiment mapped onto the luciferase monomer structure. Cross-links in the white area can be considered as correct cross-links, whereas cross-links in the red area correspond to cross-links that exceed the distance threshold of 32 Å. (e) Euclidean distances of the cross-links mapped onto the refined assembled dimer. (f) Visualization of the refined dimer structure including the cross-linked residues. Red lines correspond to interprotein cross-links, and yellow lines correspond to intraprotein cross-links.
We performed cross-linking reactions on luciferase in two conformations (apo and activated) in two biochemical replicates and analyzed the resulting cross-linked peptides with the LFQ-like and differential isotopic labeling–based workflows. We generated the apo state by cross-linking the enzyme in its native form. To generate the activated state of the enzyme, we added its substrates luciferin and ATP and monitored the reaction in a luminescence assay (Supplementary Fig. 5). The LFQ-like workflow identified 76 unique cross-links corresponding to 53 uxIDs (Supplementary Table 4), and the differential isotopic labeling workflow identified 82 unique cross-links (62 uxIDs; Supplementary Table 5). The overlap between the different workflows was 66% (46 out of 69 uxIDs; Supplementary Results 2).
Comparison of the different workflows showed high correlation of the datasets (R2 = 0.899; Fig. 2b). The combined analysis allowed the quantification of 59 out of 69 uxIDs, and 21 uxIDs showed a significant fold change (adjusted P value < 0.01 and absolute log2 fold change > 1; Fig. 2c, Supplementary Table 6, and Supplementary Figs. 6a,b and 7a–c).
We then used the identified cross-linked peptides and the available existing structural information to analyze the structures of the two conformers. Mapping the cross-linked residues onto the monomer structure of luciferase showed that multiple cross-links violated the distance threshold of 32 Å (ref. 29) imposed by the cross-linker molecule and were therefore incompatible with the monomeric structure (Fig. 2d), a finding that is consistent with the proposed dimeric structure of the enzyme30. Because structural models were available only for the monomer, we assembled a dimer structure that was consistent with the cross-link data (Fig. 2e,f) from the available monomeric models using a manual approach and an exhaustive low-resolution but unbiased docking analysis using ROSETTA31 (Supplementary Fig. 8a–d and Supplementary Results 2).
To determine whether the quantitative changes measured via the qCX-MS approach were in agreement with the structural changes that luciferase undergoes during its reaction cycle, we mapped the identified and quantified cross-links onto the dimer structures of the apo state and the active configuration of luciferase (Fig. 3a and Supplementary Fig. 9a,b). When we compared the apo model of luciferase to the active conformation where luciferase is bound to a nucleotide analog, we noted that the cross-links that exceeded the distance threshold in the second conformation were significantly (adjusted P value of <0.01 and absolute log2 fold change of >1) decreased in abundance (Fig. 3b,c), demonstrating that structural changes can be detected by the qCX-MS approach. Additionally, multiple cross-links that changed significantly were explained by the cross-linked structure of luciferase in an alternative secondary conformation (PDB 4G37; Supplementary Fig. 9b).
Figure 3.
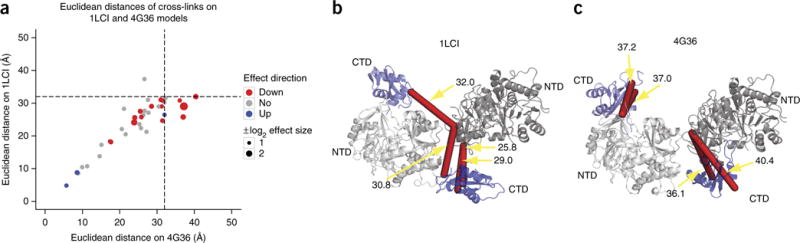
Comparison of qCX-MS and structural changes in the luciferase dimer. (a) Quantitative changes and effect sizes measured by qCX-MS and Euclidean distances comparing apo (1LCI dimer) and the active-conformation structural model of luciferase (4G36 dimer). The size of the data points corresponds to the absolute log2 value of the effect size. Dashed lines correspond to the maximum threshold imposed by the cross-linker (32 Å). Red and blue dots indicate significantly changed uxIDs (adjusted P value < 0.01 and absolute log2 fold change > 1). (b,c) Luciferase in its apo dimer configuration (1LCI) (b) and in its active dimer conformation (4G36) (c). Red lines in b indicate the cross-links that satisfy the distance threshold imposed by the cross-linker (32 Å) in the apo conformation; red lines in c indicate cross-links that exceed the distance threshold in the active conformation of luciferase and were found to be quantitatively decreased in the experiment. Cross-links in b and c correspond to the same cross-links but different topologies (selected on the basis of the shortest Euclidean distances). NTDs are in gray, and CTDs are in blue.
Overall, the analysis showed that out of 12 cross-links that showed a significant change (excluding cross-links to residues near the termini) and could be validated on the respective structures, 6 were explained by the rearrangement of the structure, 4 were explained by a ‘network effect’ (Supplementary Fig. 10) and the remaining 2 showed a significant change that could be explained by a reaction mechanism involving lysine residues that contact the substrate during the reaction cycle (Supplementary Table 6 and Supplementary Fig. 10a,b).
Conformational rearrangements of the bovine TRiC chaperonin
To test the performance of the qCX-MS method on a more complex system, we applied it to the 1-MDa protein complex TRiC. The TRiC chaperone consists of two rings, each consisting of eight different subunits, stacked back-to-back to form a hexadecameric structure32–36. An elaborate, ATP-driven conformational cycle links TRiC-mediated folding to opening and closure of a built-in lid, encapsulating the substrate in the central cavity37–40. Importantly, TRiC can be locked into several catalytically important biochemical states by different nucleotide analogs that mimic the different conformational states of TRiC during its ATPase cycle (Fig. 4a). The states that can be generated are apo (nucleotide-free), ATP-bound (by using the nonhydrolyzable ATP analog AMP-PNP), ADP-bound, and two ATP-hydrolysis transition-state analogs induced by ADP-AlFx and ATP-AlFx, respectively38. These nucleotides represent three open (apo, AMP-PNP and ADP) and two (partially) closed conformations (ATP-AlFx and ADP-AlFx) of TRiC. In the presence of functional ATP, the chaperonin is actively going through the catalytic cycle; thus cross-linking in this condition captures conformational states along the entire catalytic cycle.
Figure 4.
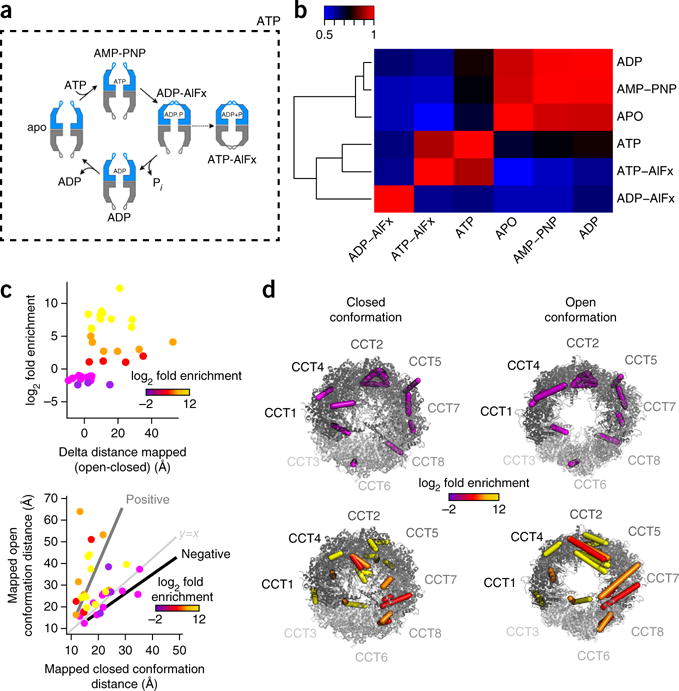
Conformational changes monitored for TRiC by qCX-MS. (a) TRiC conformational cycle. The diagram illustrates the conformational transitions TRiC undergoes throughout the ATPase cycle. The nucleotides that were used to generate the distinct biochemical states are indicated next to the TRiC conformational cartoons. The dashed border indicates the functional nucleotide ATP. In the presence of ATP, the chaperonin is actively going through the cycle; thus cross-linking in this condition captures conformational states along the entire conformational cycle. Adapted with permission from Cong, Y. et al. Symmetry-free cryo-EM structures of the chaperonin TRiC along its ATPase-driven conformational cycle. EMBO J. 31, 720–730 (2012). (b) Heat map of Pearson correlation coefficients between the different TRiC states. For correlation, the log10 areas of the cross-linked peptides were used. (c) Changes in the observed Euclidean distances and log2 fold enrichment between open and closed conformations. The quantitative data are relative to the apo state. Positive enrichment indicates enrichment in the closed-state conformations. The lower graph shows positively and negatively enriched cross-links illustrated on the open-and closed-state conformations. (d) Positively and negatively enriched cross-links mapped onto the open- and closed-conformation models of TRiC. The colors correspond to the enrichment range shown in c.
We generated a cross-linking data set under a series of different nucleotide conditions (apo, ATP-AlFx, AMP-PNP, ATP, ADP and ADP-AlFx; Supplementary Table 7 and Online Methods) that corresponded to the discrete conformational states in TRiC using two biochemical and two (or four) technical replicates (Supplementary Note 1 and Supplementary Fig. 11a–c).
In all LFQ-like experiments, we identified a total of 440 unique cross-linked peptides (307 intraprotein and 133 interprotein cross-links) mapping to 347 uxIDs (250 intraprotein and 97 interprotein restraints) using the xQuest and xProphet pipeline. We then used the identifications to extract the ion chromatograms of the cross-links using xTract (Supplementary Table 8, Supplementary Fig. 12a–e and Supplementary Results 3).
To globally assess whether we could discern the distinct biochemical states of TRiC on the basis of the qCX-MS data, we compared the measured intensities of the cross-linked peptides and the different states (Fig. 4b). This revealed two discernible clusters corresponding to the open and (partially) closed conformations (apo, AMP-PNP and ADP in the first cluster, and ATP, ATP-AlFx and ADP-AlFx in the second). This analysis showed that TRiC-ATP, which represents an average of the closed and open states, segregated the two clusters (Supplementary Results 3).
We next focused on the apo and ATP-AlFx conformations for a more comprehensive analysis of structural rearrangements, because the highest quality structures were available for these two states (Supplementary Note 1).
We first validated the cross-links and changes in their abundance using the available structural models for the open and closed states of TRiC. When we compared cross-links identified in both conformational states, we found that the log2 enrichment for a given cross-link was consistent with changes in the Cα-Cα lysine distance between the two sites mapped onto the structural models (Fig. 4c). We found 19 positively enriched cross-links (log2 fold enrichment from 1.07 to 12.31) that could be classified as 16 interprotein cross-links, 3 intraprotein cross-links and 13 negatively enriched cross-links (log2 fold enrichment from −1.01 to −2.41) that broke down into 9 interprotein cross-links and 4 intraprotein cross-links. Additionally, there were cross-links entirely unique to each state. Thus the abundance of identified cross-links can be used as a readout for the conformational change where the cross-links enriched in each state map onto each structure with distances consistent with the cross-link geometry (Fig. 4c). Several cross-links that exceeded the distance in the open models (high delta) and localized to apical domains that were flexible and separated in the open conformation but within a valid distance in the closed models showed positive enrichment (Fig. 4d). Similar but less consistent effects were observed for negative delta values. Furthermore, we observed a series of cross-links that rearranged at the ring-ring interface between the two opposite CCT2 subunits centered on the D2 axis of the complex. Previous work has demonstrated that the complex uses ATP asymmetrically and that CCT2 has a key role in this cycle37. A closer inspection of the cross-links identified in the region of the CCT2 interface showed changes in cross-link geometry that were indicative of structural rearrangements at this interface.
DISCUSSION
We describe xTract and the underlying TeXaS concept as an integrated workflow for qCX-MS applications. The software includes a statistical framework that takes the overall sparseness of qCX-MS data and the distribution over different sample fractions into account. xTract is compatible with different experimental designs so that no particular type of isotope-labeled reagent is required. Our dilution-series experiment demonstrated that the software produces accurate data from well-defined samples.
Many protein complexes undergo dynamic structural changes, for example, to catalyze biochemical reactions or to perform signaling or mechanistic tasks. Understanding the dynamics is often challenging because of the lack of structural models of different conformational states. If transitions are within the resolution of the cross-linking technology, qCX-MS provides an attractive opportunity to address these questions. qCX-MS provides a new dimension of information that is not easily accessible with established structural biology techniques, and, importantly, the technique does not rely on the availability of high-resolution structures.
A move from highly purified samples to samples isolated by affinity-purification methods14 will broaden the scope of the method, allowing for studies of the diversity of conformational and compositional states of protein complexes in their native cellular environments. Future work will be needed to further explore how qCX-MS data can be used to model conformational changes and interpret biochemical (reaction) mechanisms of different states of a protein complex.
METHODS
Methods and any associated references are available in the online version of the paper.
ONLINE METHODS
Dilution-series data set for model proteins
Cross-linking experiment
The proteins bovine serum albumin (BSA), bovine transferrin and chicken ovotransferrin (conalbumin), all obtained from Sigma-Aldrich, were dissolved in 20 mM HEPES-KOH, pH 8.3, and cross-linked at a protein concentration of 2 mg/ml with 1 mM disuccinimidyl suberate (DSS)-H12/D12, 1 mM DSS-H12 or 1 mM DSS-D12 (Creative Molecules Inc.), after which they were incubated for 30 min at 37 °C and 500 r.p.m. on a Thermomixer (Eppendorf) and quenched with 50 mM NH4HCO3 for 20 min.
Digestion and MS analysis
The proteins were evaporated to dryness in a vacuum centrifuge, dissolved in 50 μl of 8 M urea, reduced with 2.5 mM tris(2-carboxyethyl)phosphine hydrochloride (Pierce) at 37 °C for 30 min and subsequently alkylated with 5 mM iodoacetamide (Sigma-Aldrich) for 30 min at room temperature in the dark. For digestion, the samples were diluted to 5 M urea and digested with 1% (wt/wt) LysC (Wako Chemicals) for 2 h on an Eppendorf thermomixer at 37 °C and 500 r.p.m. Subsequently the samples were diluted to 1 M urea and further digested by 2% (wt/wt) trypsin (Promega). Digestion was carried out at 37 °C and 500 r.p.m. overnight and stopped by acidification to 1% (vol/vol) formic acid.
Peptides were purified using Sep-Pak tC18 cartridges (Waters) according to the manufacturer’s protocol. Enrichment of cross-linked peptides by peptide size-exclusion chromatography (SEC) was carried out as described previously24,41. LC-MS/MS analysis was carried out on an Orbitrap Elite mass spectrometer (Thermo Scientific) coupled to an Easy-nLC 1000 system (Thermo Scientific). Peptides from the SEC fractions were separated on a Thermo PepMap RSLC column (15 cm length, 75 μm inner diameter) with a 60-min gradient from 9% to 35% acetonitrile at a flow rate of 300 nl/min. The mass spectrometer was operated in data-dependent acquisition (DDA) mode with MS acquisition in the Orbitrap analyzer at 120,000 resolution and MS/MS acquisition in the linear ion trap at normal resolution after collision-induced dissociation. DDA was set up to select the five most abundant precursors with a charge state of +3 or higher.
Mixing scheme for MS analysis
For the LFQ-like data set, the proteins were mixed according to the dilution-series table (Supplementary Table 1) using two biochemical replicates. The samples were then processed using peptide SEC as described above. For MS analysis, the injected sample amount was normalized to the amount of BSA present in the samples. The LFQ-like data set comprised 48 individual MS experiments derived from four dilution steps, two biochemical replicates, two technical replicates and three fractions collected from the peptide size-exclusion fractionation.
For the differential isotopic labeling workflow, the dilutions were created according to the dilution-series table (Supplementary Table 1), using either DSS-H12 (light) or DSS-D12 (heavy) as the reference label. The samples were then processed using peptide SEC as described above. The differential isotopic labeling data set comprised 96 individual MS experiments, derived from two biochemical replicates (forward and reverse labeled), and three fractions measured in four technical replicates. (Four technical replicates were used to obtain the same number of data points for each cross-linked peptide as for the LFQ-like data set.)
Given this experimental outline, a cross-link was quantified using at least eight individual data points:
LFQ-like: light and heavy × two technical replicates × two biochemical replicates
Differential isotopic label: light or heavy (forward and reverse labeled) × four technical replicates
xQuest, xProphet and xTract analysis
The MS data were converted with MSconvert (from Proteowizard42) to the open mzXML format. For the xQuest search, the target sequences plus 25 additional random sequences from Escherichia coli were concatenated to a target database. The decoy database was generated as previously described3. xQuest search was performed using the standard xQuest definition file, but allowing for up to three missed cleavages. Searches for the LFQ-like and differential isotopic labeling workflows were performed individually, and xProphet (version 2.5.5) was run using the standard parameters with a minionsmatched parameter adjusted to 3. We exported results of identification (I.D.) analysis by selecting unique intraprotein cross-links, (FDR < 5% and delta AA > 0. For xTract analysis, the same parameters were used, but including redundant I.D.s.
The xTract analysis was carried out using xTract (version 1.0.0) with the standard parameters, meaning parameters defined in a parameter-definition file that can be obtained from the software. The relevant standard parameters that were used for the XIC extraction by xTract are listed in Supplementary Tables 9 and 10.
For post-validation using xTract Analyzer, we used an “all or nothing” validation by which a value was accepted only if there was a consistent signal observed for all or none of the replicates.
Luciferase cross-linking
Cross-linking experiment
Firefly luciferase (Sigma-Aldrich) was dissolved to a concentration of 0.5 mg/ml in 50 mM HEPES-KOH, pH 8.3, 5 mM MgCl2, 0.5 mM ethylenediamine tetra-acetic acid, 5% glycerol and 0.5 mM dithiothreitol and cross-linked with 1 mM DSS-H12/D12 (Creative Molecules Inc.) as described above for the dilution-series data set. For the active state, luciferase was pre-incubated with 50 μM luciferin for 10 min, and then 10 mM ATP and cross-linker were added and the luminescence was measured on a Synergy HT (BioTek) microplate reader using the standard parameters for luminescence measurements (Luminescence Endpoint) with the gain parameter adjusted to 25. For the differential isotopic labeling experiment, the same concentrations were used for the cross-linking reaction, and 50 μl of the light-and-heavy– and heavy-and-light–labeled samples were mixed afterward. For the Master-Mix sample, 25 μl of each label was used (forward, light/heavy, and reverse, heavy/light). All experiments were carried out in two biochemical replicates. Additionally, the samples were measured on the mass spectrometer in two technical replicates (LFQ-like workflow) or four (see dilution-series experiment for details) technical replicates (differential isotopic labeling workflow).
The samples were digested and processed as described above for the dilution-series data set.
xQuest, xProphet and xTract analysis
To generate a target database, we concatenated the sequences of luciferase (sp|P08659|LUCI_PHOPY) and 25 additional randomly selected E. coli proteins. The decoy database was generated with the standard protocol as described previously3. The C-terminal peptide of the decoy luciferase was virtually indistinguishable from the target sequence and was shuffled manually. xQuest search and xProphet and xTract analyses were carried out as described above for the dilution-series data set, with the same parameter set for XIC extraction.
Combination of p values and fold changes for the combined luciferase data set
To combine the significance values and fold changes from the LFQ-like and differential isotopic labeling data sets, we used the following approach. If a certain uxID was quantified in both data sets, the P values were combined using Fisher’s method for combining P values43. The fold change was combined using the mean calculated from both values. If a uxID was quantified in only one workflow, the p values and the fold change were used as such. The PP values were then corrected for multiple-hypothesis testing using the Benjamini-Hochberg approach44.
Cross-linking of TRiC samples
Cross-linking experiment
Purified bovine TRiC was cross-linked in the different nucleotide states, which are described in detail in reference 40. Additionally, one experiment was carried out in the presence of 1 mM ATP. All cross-linking experiments were carried out at a protein concentration of 1.2 mg/ml. Incubation times for the nucleotides before cross-linking were 60 min for ATP-AlFx and ADP-AlFx and 15 min for ATP, ADP and AMP-PNP. The cross-linking reaction was carried out with the addition of 1 mM DSS-H12/D12, 1 mM DSS-H12 or 1 mM DSS-D12. The cross-linking reactions were incubated for 30 min at 37 °C and 500 r.p.m. on a Thermomixer (Eppendorf) and quenched with 50 mM NH4HCO3 for 20 min. All experiments were carried out in two biochemical replicates. Additionally, the samples were measured on the mass spectrometer in two technical replicates (LFQ-like workflow) or four (see dilution-series experiment for details) technical replicates (differential isotopic labeling workflow).
The samples were digested and processed as described above for the dilution-series data set, with the exception that the seven most abundant precursors were selected for fragmentation in MS/MS analysis.
xQuest, xProphet and xTract analysis
To generate a target database, we concatenated the sequences of bovine TRiC, bovine tubulin (present as a contaminant) and trypsin. The decoy database was generated with the standard protocol as described previously3. xQuest search and xProphet and xTract analyses were carried out as described above for the dilution-series data set, with the same parameter set for XIC extraction.
Targeted extraction and statistical validation of peptide ion chromatograms (TeXaS)
The TeXaS algorithm, as outlined in Supplementary Figure 1a, and the xTract program were implemented in Perl (version 5.10).
In a first step, all cross-link identifications (cross-link–peptide-spectrum matches (CX–PSMs)) were exported from the xQuest and xProphet viewer (version 2.2.3) using the xTract specific comma separated value (csv) format containing the information on the individual CX-PSMs (scan number, sequence, modification, score, type of identification, m/z, charge, retention time, FDR and uxID). Thereby all scans that were reported using a user-specified FDR threshold were used. In case isotopically labeled cross-linkers were used, light and heavy scans are reported individually and are specified by the “type” attribute.
Preprocessing steps
In the first preprocessing step, the precursor intensities as reported by the mass spectrometer were read from the mzXML files and added to the xTract csv file using the scan numbers of the identifications. This information can be used by the xTract algorithm to determine the reference PSM and retention time for the XIC extraction. In the next step, decoy PSMs were generated using a fixed amino acid exchange table (Supplementary Table 9). The mass exchange table was generated to introduce small mass differences without creating an overlap with isotopic mass shifts.
Because mProphet uses the decoy I.D.s to parameterize the false positive distribution (Supplementary Fig. 1c), it is useful to generate a sufficient number of decoy I.D.s for the fitting procedure. The decoys that are generated for the XIC extraction are independent of the decoys used for the identification of cross-linked peptides. The decoys are used to estimate the FDRs as q-values of the extracted peak groups by mProphet (Supplementary Fig. 1d,e). The statistical validation of the extracted peak groups is necessary to obtain a high-quality data set of quantitative measurements. It allows the user to select an optimal q-value threshold where the sensitivity is maximized (i.e., all true positive peak groups are retained in the dataset while the q-value is kept at its minimum) (Supplementary Fig. 1e). This step is necessary to avoid misclassification of true positive peak groups as zero values (false negatives).
Multiple decoys can be generated on the basis of the target I.D.s, whereby the nth amino acid for every target I.D. is exchanged. Here n refers to the position of the amino acid in the corresponding iteration (starting from the C terminus) that is exchanged. This procedure of generating decoys preserves the properties of the target I.D. population (e.g., the number of I.D.s for a PSM and retention times) and alters only the mass of the I.D.s in a defined way.
In the second preprocessing step, the isotope abundance distributions were calculated by the external program IPC (Isotopic Pattern Calculator; http://isotopatcalc.sourceforge.net).
Description of the xTract algorithm
Parameters specified by the xTract parameter-definition file are read and used for the processing steps. These include the profile mzXML file name(s), the xTract csv file name(s) and, if specified, a retention-time normalization file. In the first step the profile mzXML file is read and the MS1 scans are indexed using a predefined m/z bin width (e.g., 10 ppm) for fast extraction of signals. In case multiple signals are present in an m/z bin, the maximum signal intensity is used if the signal exceeds a predefined intensity threshold (usually 1 × 10³).
Next, the theoretical isotope patterns and the identifications are loaded from the IPC file generated earlier and the xTract csv file, respectively. If a retention-time normalization file is used, all retention times are recalibrated to the retention-time scale of the current MS run.
In the next step, PSMs mapping to a single identification (defined by sequence, cross-link type, charge state and modification) are collected and grouped by ascending retention time as a PSM group.
For each PSM group, the PSMs are classified as PSMs either with MS2 evidence for the current MS run or without MS2 evidence for the current MS run. If an upper threshold for the number of PSMs is defined, PSMs with MS2 evidence are prioritized over PSMs without MS2 evidence, and the PSM number is reduced to the threshold value.
If PSMs are available that originate from the current MS run, these I.D.s are sorted by descending precursor intensity and combined with PSMs that do not originate from the present MS run; the reference PSM is defined as the PSM with the highest precursor intensity. If no PSM originates from the current MS run (inferred I.D.s), the reference PSM is defined by the maximum precursor intensity of the available PSMs from other MS runs, the maximum score, the median PSM or a histogram function, whereby the peptides are sorted into bins using the retention-time window that is selected for the XIC extraction and the PSM with the most associated scans is selected as reference PSM.
XIC extraction
XICs for every PSM group are extracted on the basis of the reference PSM.
First, the number of isotopes for the extraction is defined either by the use of a fixed number of isotopes for every PSM or automatically on the basis of the theoretical isotope-abundance distribution. In the latter case, the number of isotopes to be extracted is defined as the number of isotopes that are expected to be at least as intense as the monoisotopic peak and using additionally a maximum and minimum number of isotopes.
On the basis of the reference PSM, MS1 scans within the extraction retention-time tolerance (usually ±150 s) are queried using a defined m/z tolerance (usually 10 ppm for Orbitrap mass analyzers). Signals are retained only for scans with signals for all isotopes (m/z values can be used on the basis of either the acquired m/z value of the PSM or the theoretical m/z value defined by IPC).
Optionally, an inferred m/z value at m/z = monoisotopic m/z – 1/z can be queried. If signals are detected and exceed the intensity of the monoisotopic peak, these scans can be discarded, as the detected peak group likely originates from a different isotopic cluster.
Isotope peak groups
In the next step, the extracted signals are grouped into peak groups. First the signal intensities of the scans containing signals for all isotopes are summed and sorted by ascending retention time. Peak group start- and endpoints are initially assigned by the presence of signals in a series of connected scans, accounting only for scans with signals for all extracted isotopes. Next peak groups that are disconnected by a certain number of scans (i.e., three scans) are merged and considered as a unique peak group.
Scoring of peak groups
First the peak group maximum retention time (trmax) and the number of matched PSMs (scans) in each peak group (nMatchedIDs), allowing for a defined tolerance (typically ±15 s), are determined. Furthermore, all relative retention-time distances of the peak group apex to PSMs are determined.
Retention-time deviation scores (var_cdf_delta_TR_all_IDs, var_cdf_deltatr)
The retention-time deviation scores are probability-based scores using a (Gaussian) cumulative distribution function (CDF). Parameters that are used for the calculation are the expected deviation from the mean (0 s) and an expected s.d. (e.g., 50 s).
The first score (Pdtrall) calculates the mean distance of the PSMs in a peak group relative to the peak group apex and is defined by equation (1).
| (1) |
The second score (Pdtr) is defined by the distance of the peak group apex to the expected retention time and is defined by equation (2).
| (2) |
MatchOdds-based score
This score uses a binomial distribution to calculate the probability that a certain number of PSMs matches to a given peak group. The prior probability for matching is defined by the width of the peak group (including the tolerance for matching) and the queried retention-time space. The score is then transformed to a scale of 0–1, where a higher score reflects the case where the observed count is unlikely to be observed by chance. The score Pbinom is defined by equation (3), where k is the number of PSMs matched to the peak group, n is the total number of PSMs and p is the prior probability for matching the peak group.
| (3) |
Correlation and normalized spectral angle (nmsc) score
These scores are calculated on the basis of the comparison of theoretical and observed isotope intensities. var_corr corresponds to the Pearson correlation coefficient (PCC), and var_nmsc corresponds to the normalized spectral contrast angle described in reference 45.
Peak group and isotope-area calculation
The areas of the individual isotopes are calculated using a geometrical approach. For example, the area (Δ, equation (4)) between two adjacent peaks (A, B) with intensities Ai and Bi (where Ai < Bi) and the absolute retention time difference dTR is calculated as follows:
| (4) |
Finally the sum of all individual areas of the isotopes is calculated.
In the final step the XICs and peak groups including the scores and areas for the corresponding PSMs are reported using a simple XML file format. mProphet then uses the scores to train its error model and calculate FDRs for the peak groups.
Statistical analysis of peak groups using the mProphet workflow
In this step the peak groups are extracted from the XML file and formatted according to the input format specified by mProphet25. mProphet is a dedicated software to assign statistical confidence to peak groups corresponding to transition groups from selected reaction monitoring experiments using a target-decoy approach. Accordingly, all peak groups that correspond to a single extracted peptide, or cross-linked peptide, are treated and formatted as peak groups corresponding to a transition group. mProphet then uses linear discriminant analysis to train a model that best separates target from decoy peak groups and assigns a q-value to each peak group. This allows the user to rank the peak groups for a single extracted peptide and to assign a statistical confidence measure to all extracted peak groups.
Statistical analysis using the xTract-analyzer
In this step, the XICs of the individual cross-linked peptides are validated, and fold changes and statistical significance of the fold changes are calculated.
First the experiment definition that describes the experimental setup is loaded. In the experiment-definition file, the replicates (biological or technical), fractions and workflow for the MS experiments are defined. Next, the mProphet output file and the xTract XML file containing the XICs are parsed and the peak groups are annotated with the q-values as determined by mProphet. The threshold to validate individual extracted peptides (peak groups) can be automatically defined by using the mProphet statistics file. The threshold is defined as the smallest q-value corresponding to the largest sensitivity (Supplementary Fig. 1e), or it can be set manually. Next the peptides are bundled together by uxID and experiment into peptide ‘bags’, and the peptides are evaluated using the q-value threshold as defined by mProphet. The user can carry out further validation by comparing ratios of light to heavy peptides for an individual experiment across all technical replicates and/or by checking whether a certain peptide is or is not assigned a valid peak group consistently across all individual technical replicates. Peptides that are not validated according to the defined criteria are assigned a ‘violation’ count. Next the intensities of the extracted peak groups are normalized. The normalization can be carried out using predefined normalization factors or automatically by using either the mean or the median abundance of the peptides corresponding to an experiment. Optionally, an inclusion list can be defined to select a specific set of peptides that are used for intensity normalization.
In the third step, the signal intensities of the validated peptides are compared to those of the reference experiment. At this stage, peptides that failed the validation step are excluded from the analysis if they exceed a threshold of a maximum number of allowed violations. The intensity values that are used for the comparison can be selected on the basis of either the sum of all fractions or the maximum value within the fractions if a peptides has been detected in multiple factions (only relevant for peptides that overlap between SEC fractions). If a peptide was not detected in one experiment but was detected in the reference experiment (or vice versa), the fold change is estimated on the basis of the minimum detectable signal intensity (e.g., 1 × 10³ for Orbitrap Elite), and instead of the area, the intensity of the first isotope is used for the comparison. This is documented in the output file by the sign “>=” if the I.D. has not been detected in the reference experiment but was in the comparison experiment and by the sign “<=” for the opposite situation.
In the final step, the significance for each comparison is determined. A t-test that is provided by the Perl module Statistics:: TTest is performed on all comparisons, and the P values are corrected for multiple-hypothesis testing using either the Bonferroni method or the Benjamini-Hochberg method.
The method used for multiple-hypothesis correction can be defined by the user (the standard is the Benjamini-Hochberg method). The standard parameters that can be obtained from xTract-analyzer are defined in Supplementary Table 10. The method used for the correction depends on the experimental questions that are being addressed. Because our experiments focused on the discovery of an ensemble of cross-linked peptides that showed a significant change, we used the Benjamini-Hochberg method. For situations where a single cross-link that is indicative for a conformational state is being investigated, the Bonferroni method might be more appropriate. A detailed discussion of the different methods and their application is also provided in reference 46.
Finally, the comparisons are evaluated on the basis of the corrected P value using a user-defined significance level and a minimum log2 fold change.
Code availability
The software tools, usage instructions and raw data are available from http://proteomics.ethz.ch.
Structural modeling of luciferase
Protein-protein docking
The atomic coordinates for luciferase (PDB 1LCI) were obtained from the PDB47. Rosetta (build r55036) with the docking protocol31 was used to conduct protein-protein docking. First, the “relax” protocol was applied with default parameters to obtain Rosetta-like structures (relax.default.linuxgccrelease -relax:sequence-constrain_relax_to_start_coords). Then, the individual native and relaxed subunits were duplicated and renumbered. We then applied the full docking protocol with adapted parameters29 to the native and relaxed duplicated subunits (docking_protocol.default. linuxgccrelease -docking:spin -docking:docking_centroid_outer_cycles 10 -docking:docking_centroid_inner_cycles 50 -docking:dock_lowres_filter 10 1). We generated ~ 250,000 decoys per input structure and extracted PDB files including Rosetta scores (talaris2013 scoring function48), extract_pdbs. default.linuxgccrelease -in:file:rescore -in:file:fullatom.
Evaluation of cross-links on structural models
To independently assess the experimentally obtained cross-links for the apo cross-linking experiment with luciferase, we calculated the Euclidean distances of the models using a custom Perl program. All cross-links that could not be matched to two lysine residues on the monomers were excluded. The remaining cross-links were individually assessed using all possible configurations (inter-and intramolecular) on each structural model using an upper threshold of 32 Å for validation between the lysine Cα atoms. The number of satisfied cross-links was reported along with the total score of the Rosetta scoring function.
TRiC models for cross-link validation
TRiC
To investigate structural changes on TRiC, we used the models of the apo (open) and closed structures as described in reference 49. Euclidean Cα-Cα distances were calculated from the respective models using PyMOL (Schrödinger, LLC). The cross-links were individually assessed using all possible configurations (inter-and intramolecular) on the closed and open structural models using an upper threshold of 32 Å between the lysine Cα atoms. These computed Cα-Cα distances were then compared to the log2 enrichment scores derived across conformational states with respect to the nucleotide free reference state.
Supplementary Material
Acknowledgments
This work was supported by the European Union 7th Framework project PROSPECTS (Proteomics Specification in Time and Space; grant HEALTH-F4-2008-201648). R.A. is supported by European Research Council (ERC) advanced grant “Proteomics v.3.0” (grant 233226), ERC advanced grant “Proteomics 4D—the proteome in context” (grant 670821) and ETH Zurich. We thank M. Beck (EMBL Heidelberg) for helpful discussions.
Footnotes
AUTHOR CONTRIBUTIONS
T.W. performed cross-linking experiments, analyzed the data and wrote the software. L.A.J. analyzed data. G.R. and L.M. performed the docking analysis. H.L.R. and G.R. provided input for using mProphet. A.L. provided MS instrument support. J.F. and L.A.J. provided the TRiC samples. T.W., L.A.J., A.L. and R.A. designed the experiments. All authors contributed to the manuscript.
Note: Any Supplementary Information and Source Data files are available in the online version of the paper.
COMPETING FINANCIAL INTERESTS
The authors declare no competing financial interests.
References
- 1.Leitner A, et al. Probing native protein structures by chemical cross-linking, mass spectrometry, and bioinformatics. Mol Cell Proteomics. 2010;9:1634–1649. doi: 10.1074/mcp.R000001-MCP201. [DOI] [PMC free article] [PubMed] [Google Scholar]
- 2.Rappsilber J. The beginning of a beautiful friendship: cross-linking/mass spectrometry and modelling of proteins and multi-protein complexes. J Struct Biol. 2011;173:530–540. doi: 10.1016/j.jsb.2010.10.014. [DOI] [PMC free article] [PubMed] [Google Scholar]
- 3.Walzthoeni T, et al. False discovery rate estimation for cross-linked peptides identified by mass spectrometry. Nat Methods. 2012;9:901–903. doi: 10.1038/nmeth.2103. [DOI] [PubMed] [Google Scholar]
- 4.Mayne SLN, Patterton HG. Bioinformatics tools for the structural elucidation of multi-subunit protein complexes by mass spectrometric analysis of protein-protein cross-links. Brief Bioinform. 2011;12:660–671. doi: 10.1093/bib/bbq087. [DOI] [PubMed] [Google Scholar]
- 5.Trnka MJ, Baker PR, Robinson PJ, Burlingame AL, Chalkley RJ. Matching cross-linked peptide spectra: only as good as the worse identification. Mol Cell Proteomics. 2014;13:420–434. doi: 10.1074/mcp.M113.034009. [DOI] [PMC free article] [PubMed] [Google Scholar]
- 6.Yang B, et al. Identification of cross-linked peptides from complex samples. Nat Methods. 2012;9:904–906. doi: 10.1038/nmeth.2099. [DOI] [PubMed] [Google Scholar]
- 7.Rinner O, et al. Identification of cross-linked peptides from large sequence databases. Nat Methods. 2008;5:315–318. doi: 10.1038/nmeth.1192. [DOI] [PMC free article] [PubMed] [Google Scholar]
- 8.Politis A, et al. A mass spectrometry–based hybrid method for structural modeling of protein complexes. Nat Methods. 2014;11:403–406. doi: 10.1038/nmeth.2841. [DOI] [PMC free article] [PubMed] [Google Scholar]
- 9.Young MM, et al. High throughput protein fold identification by using experimental constraints derived from intramolecular cross-links and mass spectrometry. Proc Natl Acad Sci USA. 2000;97:5802–5806. doi: 10.1073/pnas.090099097. [DOI] [PMC free article] [PubMed] [Google Scholar]
- 10.Lasker K, et al. Molecular architecture of the 26S proteasome holocomplex determined by an integrative approach. Proc Natl Acad Sci USA. 2012;109:1380–1387. doi: 10.1073/pnas.1120559109. [DOI] [PMC free article] [PubMed] [Google Scholar]
- 11.Leitner A, et al. The molecular architecture of the eukaryotic chaperonin TRiC/CCT. Structure. 2012;20:814–825. doi: 10.1016/j.str.2012.03.007. [DOI] [PMC free article] [PubMed] [Google Scholar]
- 12.Bui KH, et al. Integrated structural analysis of the human nuclear pore complex scaffold. Cell. 2013;155:1233–1243. doi: 10.1016/j.cell.2013.10.055. [DOI] [PubMed] [Google Scholar]
- 13.Greber BJ, et al. Architecture of the large subunit of the mammalian mitochondrial ribosome. Nature. 2014;505:515–519. doi: 10.1038/nature12890. [DOI] [PubMed] [Google Scholar]
- 14.Herzog F, et al. Structural probing of a protein phosphatase 2A network by chemical cross-linking and mass spectrometry. Science. 2012;337:1348–1352. doi: 10.1126/science.1221483. [DOI] [PubMed] [Google Scholar]
- 15.Tosi A, et al. Structure and subunit topology of the INO80 chromatin remodeler and its nucleosome complex. Cell. 2013;154:1207–1219. doi: 10.1016/j.cell.2013.08.016. [DOI] [PubMed] [Google Scholar]
- 16.Joachimiak LA, Walzthoeni T, Liu CW, Aebersold R, Frydman J. The structural basis of substrate recognition by the eukaryotic chaperonin TRiC/CCT. Cell. 2014;159:1042–1055. doi: 10.1016/j.cell.2014.10.042. [DOI] [PMC free article] [PubMed] [Google Scholar]
- 17.Schmidt C, et al. Comparative cross-linking and mass spectrometry of an intact F-type ATPase suggest a role for phosphorylation. Nat Commun. 2013;4:1985. doi: 10.1038/ncomms2985. [DOI] [PMC free article] [PubMed] [Google Scholar]
- 18.Fischer L, Chen ZA, Rappsilber J. Quantitative cross-linking/mass spectrometry using isotope-labelled cross-linkers. J Proteomics. 2013;88:120–128. doi: 10.1016/j.jprot.2013.03.005. [DOI] [PMC free article] [PubMed] [Google Scholar]
- 19.Schmidt C, Robinson CV. A comparative cross-linking strategy to probe conformational changes in protein complexes. Nat Protoc. 2014;9:2224–2236. doi: 10.1038/nprot.2014.144. [DOI] [PMC free article] [PubMed] [Google Scholar]
- 20.Cappadona S, Baker PR, Cutillas PR, Heck AJ, van Breukelen B. Current challenges in software solutions for mass spectrometry-based quantitative proteomics. Amino Acids. 2012;43:1087–1108. doi: 10.1007/s00726-012-1289-8. [DOI] [PMC free article] [PubMed] [Google Scholar]
- 21.Mueller LN, et al. SuperHirn—a novel tool for high resolution LC-MS-based peptide/protein profiling. Proteomics. 2007;7:3470–3480. doi: 10.1002/pmic.200700057. [DOI] [PubMed] [Google Scholar]
- 22.Sturm M, et al. OpenMS—an open-source software framework for mass spectrometry. BMC Bioinformatics. 2008;9:163. doi: 10.1186/1471-2105-9-163. [DOI] [PMC free article] [PubMed] [Google Scholar]
- 23.Cox J, Mann M. MaxQuant enables high peptide identification rates, individualized p.p.b.-range mass accuracies and proteome-wide protein quantification. Nat Biotechnol. 2008;26:1367–1372. doi: 10.1038/nbt.1511. [DOI] [PubMed] [Google Scholar]
- 24.Leitner A, et al. Expanding the chemical cross-linking toolbox by the use of multiple proteases and enrichment by size exclusion chromatography. Mol Cell Proteomics. 2012;11014126:M111. doi: 10.1074/mcp.M111.014126. [DOI] [PMC free article] [PubMed] [Google Scholar]
- 25.Reiter L, et al. mProphet: automated data processing and statistical validation for large-scale SRM experiments. Nat Methods. 2011;8:430–435. doi: 10.1038/nmeth.1584. [DOI] [PubMed] [Google Scholar]
- 26.Nakatsu T, et al. Structural basis for the spectral difference in luciferase bioluminescence. Nature. 2006;440:372–376. doi: 10.1038/nature04542. [DOI] [PubMed] [Google Scholar]
- 27.Conti E, Franks NP, Brick P. Crystal structure of firefly luciferase throws light on a superfamily of adenylate-forming enzymes. Structure. 1996;4:287–298. doi: 10.1016/s0969-2126(96)00033-0. [DOI] [PubMed] [Google Scholar]
- 28.Sundlov JA, Fontaine DM, Southworth TL, Branchini BR, Gulick AM. Crystal structure of firefly luciferase in a second catalytic conformation supports a domain alternation mechanism. Biochemistry. 2012;51:6493–6495. doi: 10.1021/bi300934s. [DOI] [PMC free article] [PubMed] [Google Scholar]
- 29.Kahraman A, et al. Cross-link guided molecular modeling with ROSETTA. PLoS One. 2013;8:e73411. doi: 10.1371/journal.pone.0073411. [DOI] [PMC free article] [PubMed] [Google Scholar]
- 30.Brovko LI, Beliaeva EI, Ugarova NN. Subunit interactions in luciferase from the firefly Luciola mingrelica. Their role in the manifestation of enzyme activity and during thermoinactivation. Biokhimiia. 1982;47:760–766. [PubMed] [Google Scholar]
- 31.Gray JJ, et al. Protein-protein docking with simultaneous optimization of rigid-body displacement and side-chain conformations. J Mol Biol. 2003;331:281–299. doi: 10.1016/s0022-2836(03)00670-3. [DOI] [PubMed] [Google Scholar]
- 32.Bigotti MG, Clarke AR. Chaperonins: the hunt for the Group II mechanism. Arch Biochem Biophys. 2008;474:331–339. doi: 10.1016/j.abb.2008.03.015. [DOI] [PubMed] [Google Scholar]
- 33.Bigotti MG, Bellamy SR, Clarke AR. The asymmetric ATPase cycle of the thermosome: elucidation of the binding, hydrolysis and product-release steps. J Mol Biol. 2006;362:835–843. doi: 10.1016/j.jmb.2006.07.064. [DOI] [PubMed] [Google Scholar]
- 34.Hartl FU, Bracher A, Hayer-Hartl M. Molecular chaperones in protein folding and proteostasis. Nature. 2011;475:324–332. doi: 10.1038/nature10317. [DOI] [PubMed] [Google Scholar]
- 35.Horwich AL, Fenton WA, Chapman E, Farr GW. Two families of chaperonin: physiology and mechanism. Annu Rev Cell Dev Biol. 2007;23:115–145. doi: 10.1146/annurev.cellbio.23.090506.123555. [DOI] [PubMed] [Google Scholar]
- 36.Spiess C, Meyer AS, Reissmann S, Frydman J. Mechanism of the eukaryotic chaperonin: protein folding in the chamber of secrets. Trends Cell Biol. 2004;14:598–604. doi: 10.1016/j.tcb.2004.09.015. [DOI] [PMC free article] [PubMed] [Google Scholar]
- 37.Reissmann S, et al. A gradient of ATP affinities generates an asymmetric power stroke driving the chaperonin TRIC/CCT folding cycle. Cell Rep. 2012;2:866–877. doi: 10.1016/j.celrep.2012.08.036. [DOI] [PMC free article] [PubMed] [Google Scholar]
- 38.Meyer AS, et al. Closing the folding chamber of the eukaryotic chaperonin requires the transition state of ATP hydrolysis. Cell. 2003;113:369–381. doi: 10.1016/s0092-8674(03)00307-6. [DOI] [PubMed] [Google Scholar]
- 39.Reissmann S, Parnot C, Booth CR, Chiu W, Frydman J. Essential function of the built-in lid in the allosteric regulation of eukaryotic and archaeal chaperonins. Nat Struct Mol Biol. 2007;14:432–440. doi: 10.1038/nsmb1236. [DOI] [PMC free article] [PubMed] [Google Scholar]
- 40.Cong Y, et al. Symmetry-free cryo-EM structures of the chaperonin TRiC along its ATPase-driven conformational cycle. EMBO J. 2012;31:720–730. doi: 10.1038/emboj.2011.366. [DOI] [PMC free article] [PubMed] [Google Scholar]
- 41.Leitner A, Walzthoeni T, Aebersold R. Lysine-specific chemical cross-linking of protein complexes and identification of cross-linking sites using LC-MS/MS and the xQuest/xProphet software pipeline. Nat Protoc. 2014;9:120–137. doi: 10.1038/nprot.2013.168. [DOI] [PubMed] [Google Scholar]
- 42.Chambers MC, et al. A cross-platform toolkit for mass spectrometry and proteomics. Nat Biotechnol. 2012;30:918–920. doi: 10.1038/nbt.2377. [DOI] [PMC free article] [PubMed] [Google Scholar]
- 43.Fisher RA. Statistical Methods for Research Workers. Oliver and Boyd: 1925. [Google Scholar]
- 44.Benjamini Y, Hochberg Y. Controlling the false discovery rate: a practical and powerful approach to multiple testing. J R Stat Soc Series B Stat Methodol. 1995;57:289–300. [Google Scholar]
- 45.Toprak UH, et al. Conserved peptide fragmentation as a benchmarking tool for mass spectrometers and a discriminating feature for targeted proteomics. Mol Cell Proteomics. 2014;13:2056–2071. doi: 10.1074/mcp.O113.036475. [DOI] [PMC free article] [PubMed] [Google Scholar]
- 46.Noble WS. How does multiple testing correction work? Nat Biotechnol. 2009;27:1135–1137. doi: 10.1038/nbt1209-1135. [DOI] [PMC free article] [PubMed] [Google Scholar]
- 47.Bernstein FC, et al. The Protein Data Bank: a computer-based archival file for macromolecular structures. J Mol Biol. 1977;112:535–542. doi: 10.1016/s0022-2836(77)80200-3. [DOI] [PubMed] [Google Scholar]
- 48.Leaver-Fay A, et al. Scientific benchmarks for guiding macromolecular energy function improvement. Methods Enzymol. 2013;523:109–143. doi: 10.1016/B978-0-12-394292-0.00006-0. [DOI] [PMC free article] [PubMed] [Google Scholar]
- 49.Leitner A, et al. Chemical cross-linking/mass spectrometry targeting acidic residues in proteins and protein complexes. Proc Natl Acad Sci USA. 2014;111:9455–9460. doi: 10.1073/pnas.1320298111. [DOI] [PMC free article] [PubMed] [Google Scholar]
Associated Data
This section collects any data citations, data availability statements, or supplementary materials included in this article.