

Abstract
Objective
Socioeconomic disadvantage may contribute to poor health through immune-related biological mechanisms. We examined the associations between socioeconomic status, as measured by annual household income, and T-cell markers of aging, including the ratios of CD4 and CD8 effector cells to naïve cells (E:N ratio) and the CD4:CD8 T-cell ratio. We hypothesized that participants with a lower income would have higher E:N ratios and lower CD4:CD8 ratios compared to participants with a higher income, and that these associations would be partially mediated by elevated cytomegalovirus (CMV) IgG antibody levels, a virus implicated in aging and clonal expansion of T-cells.
Methods
Data were from 79 individuals who participated in the population-based Detroit Neighborhood Health Study. We used linear regression to quantify the association between a $10,000 decrease in income and each ratio outcome.
Results
Adjusting for age, sex, race, smoking, medication use, and lifetime history of mental health conditions, lower income was associated with a 0.41 (95% CI: 0.09, 0.72) log-unit increase in the CD4 E:N ratio and a 0.20 (95% CI: 0.02, 0.39) log-unit increase in the CD8 E:N ratio. CMV IgG antibody level partially mediated these associations.
Conclusions
Our study suggests that low socioeconomic status is associated with immunological aging as measured by the E:N ratio and that impaired immune control of CMV may partially mediate these associations.
Keywords: Socioeconomic status, Cytomegalovirus, Immunosenescence, Immunity, Aging, DNHS
Introduction
Addressing persistent socioeconomic disparities in health continues to be a national priority.(1–4) Numerous conceptual models demonstrating how social disadvantage influences biology have highlighted the immune system as a fundamental pathway linking socioeconomic status and health.(5–7) At the same time, advances in immunology have identified key processes involved in immune system aging – otherwise known as immunosenescence – that could help explain why some individuals have worse health outcomes as they age than others and why some individuals respond more poorly to vaccines and other interventions that target the immune system. As individuals age, they experience a change in the cellular composition of the T-cell compartment, which in its most extreme form is characterized by an inversion of the CD4+:CD8+ T-cell ratio, a decrease in naïve T-cells, and an accumulation of memory T-cells, especially late-stage differentiated CD8+ T-cells.(8–11) The latter at least partly consists of anergic T-cells which show evidence of dysfunctionality,(12) suggesting that their accumulation may be a compensatory mechanism to maintain essential T-cell memory to pathogens. Several lines of evidence suggest that the maintenance of an adequate level of functional T-cell memory to persistent infections is crucial for individual survival, at least at advanced age.(13, 14) Differences in immune phenotypes between younger and older people are therefore likely to reflect their life-long history of exposures(8) as well as their capacity for mounting adequate responses to challenge.(15) The importance of these immune measures to survival of elderly people is illustrated in the longitudinal studies establishing the “immune risk profile” predicting 2-, 4- and 6-year mortality.(10, 14, 16) To date, limited population-based research has examined these salient biomarkers of immunosenescence that may provide key information about the role of the immune system in the etiology of social health disparities.
The majority of population-based research studies that have examined the impact of socioeconomic status on biological pathways have focused on biomarkers of the cardiovascular system and metabolic processes.(17, 18) For this reason, prior studies of the association between socioeconomic status and the immune system are largely limited to biomarkers implicated in general inflammatory processes of the immune system, such as CRP and IL-6.(19–24) Some studies have also assessed antibodies to specific herpesviruses as surrogate markers of alterations in cell-mediated immunity.(25, 26) More recently, emerging research on telomeres has provided molecular information on cellular aging of cells in relation to exposure to stressors, including socioeconomic disadvantage.(27, 28) While these biomarkers have provided fundamental insights on general immune processes and molecular aging, none have provided specific information on the integrity of the immune system, which is possible to assess using immunological techniques that measure the distribution of cellular phenotypes of the T-cell compartment.
Socioeconomic status has also been associated with an increased risk for specific infections that have been posited to be key drivers of immunosenescence. In particular, exposure to highly prevalent cytomegalovirus (CMV)—a herpesvirus that, once acquired, persists as a latent infection—is thought to be a primary contributor to age-related declines in T-cell mediated immunity. Indeed, a growing body of evidence suggests that, as individuals age, clonal expansion of CMV-specific memory T-cells triggered in response to repeated subclinical CMV reactivation gradually depletes the reservoir of naïve T-cells, resulting in reduced ability to mount an effective immune response to novel pathogens and vaccinations.(14, 29–33) Moreover, prolonged periods of exposure to psychosocial stress have been shown to induce reactivation of CMV.(34) Given that persons of low socioeconomic status experience more psychosocial stressors over the life course(35) and are also more likely to be seropositive for CMV(26) than persons exposed to less socioeconomic disadvantage, it is plausible that CMV partially mediates the association between socioeconomic status and alterations in immune cell phenotypes considered characteristic of aging.
To the best of our knowledge, no community-based studies have specifically examined the association between socioeconomic status and the distribution of T-cell phenotypes in middle-aged adults, nor whether these associations are mediated by immune response to CMV. In the present study, we address this critical gap in the literature using data from a subset of individuals drawn from a population-based sample of adults (median age 45) who participated in the Detroit Neighborhood Health Study. Specifically, we examined the associations between annual household income level—a marker of socioeconomic status, CMV IgG antibody level, and the distribution of T-cell phenotypes as measured by the effector to naïve (E:N) T-cell ratio in both the CD4+ and CD8+ T-cell subsets and the CD4+:CD8+ T-cell ratio. We hypothesized that participants with a lower annual household income level would have higher E:N ratios and a lower CD4+:CD8+ ratio compared to participants with a higher annual household income level, and that these associations would be partially mediated by impaired immune control of CMV as reflected by higher circulating immunoglobulin G (IgG) antibody levels.
Materials and Methods
Study Population
Data were derived from the Detroit Neighborhood Health Study (DNHS) (2008–2013), a population-based longitudinal study of 2081 adults aged 18 or older living in Detroit. DNHS participants were selected through a two-stage area probability sample of households within Detroit city limits. One adult was selected from each household to participate in a 40 minute survey that included questions on participants’ sociodemographics, neighborhood characteristics, physical and mental health, social support, exposure to stressful events, and substance use behaviors. The survey instruments included reliable scales that have been validated or used in comparable research in the past, and the survey was pilot tested before each study wave.(36–38) Surveys were conducted via computer-assisted telephone interviewing (CATI). Wave 1 (2008–2009) survey participants (N=1547), from which the study sample were drawn, were representative of the Detroit population in terms of age, sex, race, income level, and educational attainment.(39) More detailed information on sampling frame, recruitment procedures, and sample characteristics have been published previously.(40)
All Wave 1 respondents were also given the opportunity to provide a venous blood specimen, of which 501 (32.4%) participants agreed to provide a sample. Participants were asked to fast for eight hours prior to the blood draw. Serum samples were processed within two hours and stored at −80 C°. Compared to the overall sample, individuals who consented to the venipuncture collection were more likely to have lower annual household income level (47.5% versus 63.5%, p<0.001) and education (42.9% versus 48.3%, p =0.0466) levels. Of the 501 individuals who provided a venipuncture sample, 484 (96.6%) were previously tested for CMV and HSV-1 IgG antibody levels, a subset of which were purposively sampled to be tested for markers of immune aging (N=100, 20.7%), with the goal of creating a sample balanced on educational levels and age. Of these individuals, 79 (79%) reported information on annual household income level and were included in the final analysis. The DNHS was approved by the institutional review boards at the University of Michigan and the University of North Carolina at Chapel Hill.
Assessment of socioeconomic status
Socioeconomic status was assessed in the telephone survey and measured as self-reported pre-tax annual household income from all sources. For this analysis, we derived a continuous measure for household income level with income coded as the midpoint of the reported income brackets; $10,000 was used for individuals who reported a household income level below $10,000 and $75,000 was used for top-coded incomes over $75,000. For the purpose of descriptive analyses, household income level was dichotomized with a cut-point at the upper tertile (≥ $35,000/year).
Quantification of CMV IgG antibody level
Frozen serum samples were shipped on dry ice to the Stanley Neurovirology Laboratory of the Johns Hopkins University School of Medicine in Baltimore, Maryland to be tested for the presence and quantity of serum IgG antibodies to CMV via solid phase enzyme-linked immunosorbent assays (ELISAs), as described previously (41). Briefly, diluted aliquots of serum were reacted with antigen bound to a solid-phase surface. Quantitation of virus-specific IgG was determined by reaction of bound antibodies with enzyme labeled anti-human IgG and enzyme substrate; optical densities were read by spectrophotometric instrumentation. For each sample, the antibody levels were expressed as the ratio of the optical density of a test sample to that of a standard sample assayed in each test run. Individuals were categorized as seropositive for CMV if their OD ratio value was ≥1.0.
Ascertainment of T-cell phenotypes
T-cell subsets from frozen peripheral blood mononuclear cell (PBMC) samples were analyzed using 10-color flow cytometry methods described previously (42) by the Tübingen Ageing and Tumor Immunology Group at the University of Tübingen, Germany. All staining steps were performed in PFEA buffer (PBS, 2% FCS, 2 mM EDTA and 0.01% Azide). Cryopreserved PBMC were thawed and treated with human immunoglobulin, GAMUNEX and ethidium monoazide (EMA) for 10 minutes on ice to block Fc receptors on the cells and label non-viable cells. Cells were then stained with a primary anti-KLRG-1 antibody (kindly provided by Prof. HP Pircher, Freiburg, Germany) for 20 min at 4°C followed by staining with Pacific-Orange-conjugated goat-anti-mouse secondary antibody for another 20 min on ice. Mouse serum was added for 15 minutes to block non-specific binding to anti-mouse secondary antibody, followed by addition of directly-conjugated monoclonal antibodies (mAb), CD3-AlexaFluor 700, CD4-PerCP, CD8-APC-Cy7, CD27-APC, CD28-PE, CD45RA-Pacific Blue, CCR7-PE-Cy7 and CD57-FITC (purchased from Becton-Dickinson, Heidelberg, Germany). After 20 minutes incubation on ice in the dark, cells were washed twice and measured immediately on a BD-LSR-II flow cytometer using FACSDiva software. The spectral overlap between all channels was calculated automatically by the BD FACSDiva software, after measuring negative and single-color controls. DNHS samples were compared to PBMCs from the same healthy donor included in each separate sample run as a standard to detect any technical bias in measurement. Flow cytometry data were analyzed using FlowJo software (Tree Star, Portland, OR) and T-cell subsets were characterized by surface expression as described previously (43). T-cell data consisted of percentages of T-cells (CD3+) out of total lymphocytes characterized as CD4 T-cells (CD3+CD4+CD8−) or CD8 T-cells (CD3+CD8+CD4−). CD4 and CD8 T-cells were further analyzed based on surface expression of markers to determine the percentage of naïve T-cells (N, CCR7+CD45RA+CD27+CD28+) and the percentage of end-stage non-proliferative effector cells (E, CCR7−CD45RA+CD27−CD28−, also known as TEMRA) (44). These data were used to generate three outcomes for the analysis: (1) differentiated effector/naïve (E:N; CCR7−CD45RA+CD27−CD28−/CCR7+CD45RA+CD27+CD28+) among CD4 T-cells, (2) E:N ratio among CD8 T-cells, and (3) CD4:CD8 ratio. The three T-cell outcomes were treated as continuous variables and natural log-transformed to approximate a normal distribution.
Assessment of covariates
Covariates hypothesized to be potential confounders of the association between annual household income level and markers of immune aging included age, sex, race/ethnicity, smoking status, use of medications that may affect immune function, and lifetime history of mental health conditions. These factors have been shown to predict other measures of immune status and are also correlated with annual household income level. Age in years was centered about the median and analyzed as a continuous variable. Race was categorized as black and non-black. Smoking status was defined based on lifetime cigarette use (ever or never). Medications were assessed at the blood draw, at which time clinicians recorded the name, dosage, and frequency of all prescription and over-the-counter medications taken by the participant in the past month. Medications were classified based on the Centers for Disease Control and Prevention (CDC) Ambulatory Care Drug Database System(45) into treatment categories that could be correlated with immune function (i.e., antimicrobial agents, cardiovascular-renal drugs, central nervous system medications, metabolic and nutrient agents, hormones and agents affecting hormonal mechanisms, immunologic agents, oncolytics, and drugs used for relief of pain). For analytical purposes, medication usage was dichotomized as currently taking any medication that may affect immune function or not. Lifetime history of mental health conditions was coded as a dichotomous variable and included generalized anxiety disorder, major depressive disorder, and post-traumatic stress disorder. Assessment and validation of these conditions in the DNHS has been described previously.(38)
Statistical analysis
All statistical analyses were carried out using SAS version 9.3 (SAS Institute, Inc., Cary, NC). Descriptive statistics were used to describe the overall sociodemographic and clinical characteristics of the study populations. Counts and proportions were used to assess the distribution of categorical variables and medians with interquartile ranges (IQR) were used for continuous variables. Using ordinary least-squares (OLS) linear regression, we also assessed the age-adjusted associations between each sociodemographic and clinical characteristic and the three T-cell outcome measures.
Next, we used OLS linear regression to estimate the associations between annual household income level and the T-cell outcome measures. These models were first adjusted for age, sex and race, and then additionally adjusted for smoking status and medication use. To assess whether the associations between annual household income level and the T-cell outcomes were mediated by CMV IgG antibody level, we decomposed the total effect estimates into direct effects (i.e. effects of income level on the T-cell outcomes not mediated through CMV IgG antibody level) and indirect effects (i.e. effects of income level on the T-cell outcomes mediated through CMV IgG antibody level). The direct effects were estimated by adding CMV IgG antibody level as an adjustment factor in the OLS regression models. To estimate the indirect effect, we used the INDIRECT macro(46) in SAS to implement the bootstrapping procedures described by Preacher and Hayes.(47) Briefly, 95% bootstrap confidence intervals (CI) were obtained using 5000 bootstrap samples with replacement and were shifted and scaled to correct for bias, producing bias-corrected and accelerated confidence intervals.(48, 49) For all analyses, estimates with a P value <0.05 were considered statistically significant.
Some have argued that seronegative individuals should be excluded from analyses of stress-related reactivation of herpesvirus antibody titers to ensure that any observed associations cannot be attributed to underlying differences in seropositivity.(50) While individuals with CMV OD ratio values of <1.0 are typically considered seronegative, the use of this cut-off level has been arbitrarily defined. We therefore chose to retain individuals with CMV IgG levels below this level (N=18, 23%) in the present study. We did, however, conduct sensitivity analyses excluding individuals with CMV OD ratio values <1.0 to assess the impact of including these individuals on our findings. Furthermore, to provide insight into the factors underlying the observed associations and to inform future meta analyses, we examined the Spearman’s rank correlation coefficients comparing each component of the T-cell outcomes and CMV with each other, as well as with each study covariate.
Results
The overall sociodemographic and clinical characteristics of the 79 study participants are shown in Table 1. Participants were a median of 45 years of age (IQR: 35-56), 50 (63%) were female, and 69 (80%) were black. Approximately half (N=38, 48%) of the participants had attained at most a high school education and 57 (72%) reported an annual household income level of less than $35,000. The majority (N=61, 77%) of participants were CMV seropositive and the median CMV IgG antibody level was 3.6 OD ratio units (IQR: 1.3–6.6).
Table 1.
Sociodemographic and clinical characteristics of 79 participants in the Detroit Neighborhood Health Study.
| Characteristic | Overall | Annual household income | |
|---|---|---|---|
| <$35K N=57 |
≥$35K N=22 |
||
| Age in years, median (IQR) | 45 (35, 56) | 44 (36, 54) | 50 (35, 56) |
| Gender, N (%) | |||
| Female | 50 (63.3) | 36 (63.2) | 14 (63.6) |
| Male | 29 (36.7) | 21 (36.8) | 8 (36.4) |
| Race, N (%) | |||
| Black | 63 (79.7) | 48 (84.2) | 15 (68.2) |
| Non-black | 16 (20.2) | 9 (15.8) | 7 (31.8) |
| Education, N (%) | |||
| ≤High school | 38 (48.1) | 32 (56.1) | 6 (27.3) |
| >High school | 41 (51.9) | 25 (43.9) | 16 (72.7) |
| Annual Household Income, median (IQR) | $20,000 ($10,000 – $42,500) | -- | -- |
| Medication usea, N (%) | |||
| Yes | 32 (42.1) | 24 (44.4) | 8 (36.4) |
| No | 44 (57.9) | 30 (55.6) | 14 (63.6) |
| Lifetime history of mental health condition,b N (%) | |||
| Yes | 41 (51.9) | 32 (56.1) | 9 (40.9) |
| No | 38 (48.1) | 25 (43.9) | 13 (59.1) |
| Cigarette use in lifetime, N (%) | |||
| Yes | 48 (60.8) | 40 (70.2) | 8 (36.4) |
| No | 31 (39.2) | 17 (29.8) | 14 (63.6) |
| CMV serostatus, N (%) | |||
| Seropositive | 61 (77.2) | 48 (84.2) | 13 (59.1) |
| Seronegative | 18 (22.8) | 9 (15.8) | 9 (40.9) |
| CMV IgG antibody level, median (IQR) | 3.64 (1.29, 6.57) | 4.46 (2.33, 7.20) | 2.31 (0.71, 4.37) |
| CD4 E:N ratio, median (IQR) | 0.05 (0.00, 0.20) | 0.07 (0.00, 0.21) | 0.00 (0.00, 0.10) |
| CD8 E:N ratio, median (IQR) | 1.25 (0.37, 3.72) | 1.63 (0.48, 4.20) | 0.52 (0.16, 1.81) |
| CD4:CD8 ratio, median (IQR) | 2.18 (1.65, 2.75) | 2.12 (1.61, 2.66) | 2.38 (1.75, 3.14) |
| PBMC count (Millions of cells), median (IQR) | 21 (18, 27) | 22 (18, 28) | 20 (17, 24) |
Abbreviations: CMV, cytomegalovirus; E:N ratio, ratio of end-stage non-proliferative effector cells (E; CCR7−CD45RA+CD27−CD28− or TEMRA) to naïve T-cells (N; CCR7+CD45RA+CD27+CD28+)
Medications included antimicrobial agents, cardiovascular-renal drugs, central nervous system medications, metabolic and nutrient agents, hormones and agents affecting hormonal mechanisms, immunologic agents, oncolytics, and drugs used for relief of pain.
Mental health conditions included generalized anxiety disorder, major depressive disorder, and post-traumatic stress disorder.
Table 2 shows the age-adjusted associations between participant demographic and clinical characteristics and the three T-cell outcomes. Older age, lower annual household income level, CMV seropositivity, and elevated CMV IgG antibody level were associated with a more immunosenescent phenotype as measured by both the CD4 E:N ratio and the CD8 E:N ratio. For every 10 years increase in age, individuals had a 0.51 (95% CI: 0.08, 0.93) unit increase in log CD4 E:N ratio and a 0.53 (95% CI: 0.29, 0.77) unit increase in log CD8 E:N ratio. A $10,000 decrease in annual household income level was associated with a 0.37 (95% CI: 0.08, 0.66) unit increase in log CD4 E:N ratio and a 0.15 (95% CI: −0.02, 0.32) unit increase in log CD8 E:N ratio. Compared to CMV seronegative individuals, CMV seropositive individuals had a 3.80 (95% CI: 2.46, 5.14) unit increase in log CD4 E:N ratio and each unit increase in CMV IgG antibody level was associated with a 0.49 (95% CI: 0.31, 0.67) unit increase log CD4 E:N ratio. CMV seropositive individuals also had a 1.15 (95% CI: 0.28, 2.02) unit increase in log CD8 E:N ratio compared to seronegative individuals and each unit increase in CMV IgG antibody level was associated with a 0.18 (95% CI: 0.07, 0.29) unit increase in log CD8 E:N ratio. Females had a more favorable CD8 E:N ratio (β: −0.91, 95% CI: −1.69, −0.13) compared to males, but no other significant differences between the sexes was observed. No other demographic or clinical variables were significantly associated with CD4 or CD8 E:N ratios and no significant associations were found between any of the study variables and the CD4:CD8 ratio.
Table 2.
Age adjusted associations between participant characteristics and the distribution of T-cell phenotypes among 79 participants in the Detroit Neighborhood Health Study.
| β (95% CI) | |||
|---|---|---|---|
| Log CD4 E:N Ratio | Log CD8 E:N Ratio | Log CD4:CD8 Ratio | |
| Each 10-year increase in age | 0.51 (0.08, 0.93)** | 0.53 (0.29, 0.77)** | −0.00 (−0.07, 0.06) |
| Gender | |||
| Female | −0.13 (−1.55, 1.28) | −0.91 (−1.69, −0.13)** | 0.15 (−0.05, 0.36) |
| Male | REF | REF | REF |
| Race | |||
| Black | 1.02 (−0.62, 2.66) | 0.23 (−0.71, 1.17) | −0.10 (−0.35, 0.14) |
| Non-black | REF | REF | REF |
| Education | |||
| ≤High school | −0.16 (−1.48, 1.16) | 0.31 (−0.44, 1.06) | −0.00 (−0.20, 0.19) |
| >High school | REF | REF | REF |
| Each $10K decrease in annual household income | 0.37 (0.08, 0.66)** | 0.15 (−0.02, 0.32)* | −0.03 (−0.07, 0.02) |
| Medication usea | |||
| Yes | −0.47 (−1.92, 0.98) | −0.36 (−1.21, 0.49) | 0.04 (−0.17, 0.25) |
| No | REF | REF | REF |
| Lifetime history of mental health conditionb | |||
| Yes | −0.17 (−1.50, 1.15) | −0.18 (−0.93, 0.57) | −0.05 (−0.24, 0.15) |
| No | REF | REF | REF |
| Cigarette use in lifetime | |||
| Yes | 0.69 (−0.66, 2.03) | 0.29 (−0.48, 1.06) | −0.08 (−0.28, 0.12) |
| No | REF | REF | REF |
| CMV serostatus | |||
| Seropositive | 3.80 (2.46, 5.14)** | 1.15 (0.28, 2.02)** | −0.13 (−0.36, 0.11) |
| Seronegative | REF | REF | REF |
| Each 1 unit increase in CMV IgG antibody level | 0.49 (0.31, 0.67)** | 0.18 (0.07, 0.29)** | −0.01 (−0.04, 0.02) |
Abbreviations: CMV, cytomegalovirus; E:N ratio, ratio of end-stage non-proliferative effector cells (E; CCR7−CD45RA+CD27−CD28− or TEMRA) to naïve T-cells (N; CCR7+CD45RA+CD27+CD28+)
p value <0.10
p value <0.05
Medications included antimicrobial agents, cardiovascular-renal drugs, central nervous system medications, metabolic and nutrient agents, hormones and agents affecting hormonal mechanisms, immunologic agents, oncolytics, and drugs used for relief of pain.
Mental health conditions included generalized anxiety disorder, major depressive disorder, and post-traumatic stress disorder.
The associations between annual household income level and the T-cell outcomes adjusted for covariates are shown in Figure 1. Adjusting only for demographic covariates (age, sex, and race), each $10,000 decrease in annual household income level was associated with a 0.35 (95% CI: 0.05, 0.64) unit increase in log CD4 E:N ratio and a 0.16 (95% CI: −0.01, 0.32) unit increase in log CD8 E:N ratio. The associations were slightly stronger after additional adjustment for smoking status, medication use, and lifetime history of mental health conditions (β: 0.41, 95% CI: 0.09, 0.72 for log CD4 E:N ratio and β: 0.20, 95% CI: 0.02, 0.39 for log CD8 E:N ratio). Lower income level was also associated with a marginal decrease in the log CD4:CD8, but the associations were not statistically significant (Figure 1).
Figure 1. Associations between each $10K decrease in annual household income and the distribution of T cell phenotypes among 79 participants in the Detroit Neighborhood Health Study.
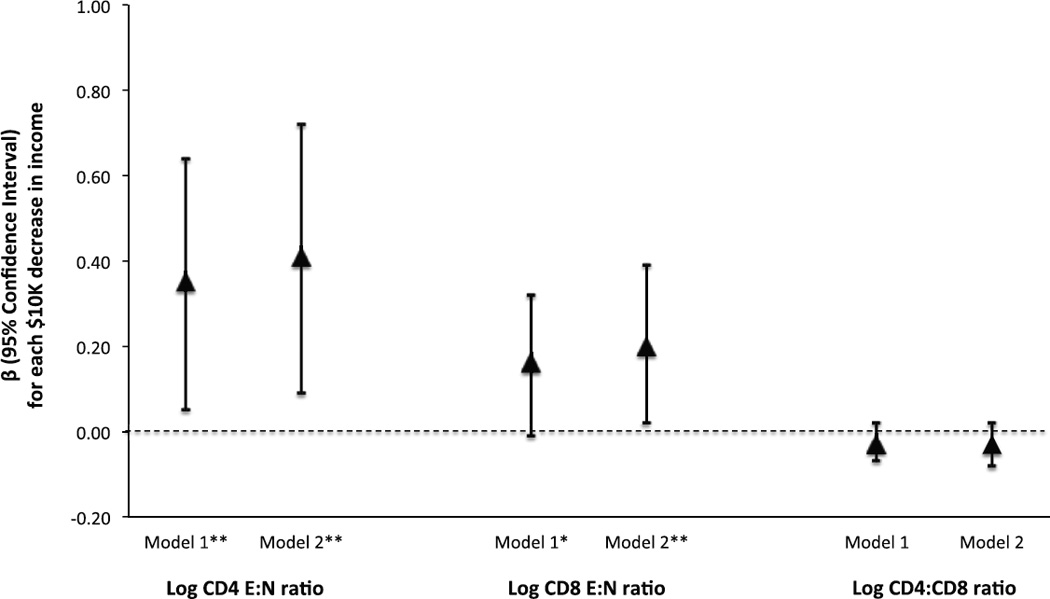
Abbreviations: CMV, cytomegalovirus; E:N ratio, ratio of end-stage non-proliferative effector cells (E; CCR7−CD45RA+CD27−CD28− or TEMRA) to naïve T-cells (N; CCR7+CD45RA+CD27+CD28+)
Triangles and corresponding bars indicate the β and 95% confidence intervals for a log unit increase in each outcome associated with a $10,000 decrease in annual household income.
*p value <0.10
**p value <0.05
Model 1: adjusted for age, sex and race.
Model 2: adjusted for age, sex, race, smoking status, medication use, and lifetime history of mental health conditions.
Figure 2 shows the results of the mediation analysis, which suggests that the association between annual household income level and the E:N ratio in the CD4 and CD8 T-cell subsets was significantly mediated by CMV IgG antibody level. Compared to the total effect, the direct effect of each $10,000 decrease in income level on the log CD4 E:N ratio not mediated through CMV IgG antibody level was attenuated and no longer statistically significant (β: 0.19, 95% CI: −0.09, 0.47) (Figure 2a). Moreover, the indirect effect of each $10,000 decrease in annual household income level on log CD4 E:N ratio mediated through CMV IgG antibody level was statistically significant (β: 0.22, 95% CI: 0.08, 0.39) (Figure 2a). The direct effect of each $10,000 decrease in income level on log CD8 E:N ratio not mediated through CMV IgG antibody level was also attenuated compared to the total effect and no longer statistically significant (β: 0.11, 95% CI: −0.07, 0.29) (Figure 2b). Although statistically significant, the indirect effect of annual household income level on log CD8 E:N ratio mediated through CMV IgG antibody level accounted for a smaller portion of the total effect compared to the direct effect (β: 0.09, 95% CI: 0.02, 0.21) (Figure 2b). Consistent with the total effect estimates, neither the direct nor the indirect effects were significant for the CD4:CD8 ratio (Figure 2c).
Figure 2. Estimation of the direct and indirect effects of each $10,000 decrease in annual family income on the distribution of T-cell phenotypes among 79 participants in the Detroit Neighborhood Health Study.

Abbreviations: CMV, cytomegalovirus; E:N ratio, ratio of end-stage non-proliferative effector cells (E; CCR7−CD45RA+CD27−CD28− or TEMRA) to naïve T-cells (N; CCR7+CD45RA+CD27+CD28+)
*p value <0.10
**p value <0.05
Tables S1 and S2 show the results of the sensitivity analyses. The results of the primary analysis excluding CMV seronegative individuals are shown in Table S1. Although the estimates were in the same direction as in the primary analysis, they were attenuated and no longer statistically significant. The Spearman’s rank correlation coefficients comparing each component of the T-cell outcomes and CMV with each other, as well as with each study covariate, are shown in Table S2.
Discussion
In the present study, we assessed the distribution of T-cell phenotypes associated with aging by socioeconomic status as measured by annual household income level and determined whether socioeconomic differentials in these markers of immune aging were mediated by CMV IgG antibody levels. We found that lower income level was significantly associated with an increased ratio of end-stage non-proliferative effector T-cells to naïve T-cells in both the CD4 and CD8 T-cell subsets. Indeed, an additional $10,000 decrease in income level was roughly associated with the same increase in CD4 E:N ratio as we observed for an eight year increase in chronological age and with the same increase in CD8 E:N ratio as we observed for a four year increase in chronological age. Moreover, our results indicated that these associations were significantly mediated by CMV IgG antibody level. Although not statistically significant, we also observed that lower income was associated with a decreased CD4:CD8 ratio. Taken together, these results suggest that individuals exposed to socioeconomic disadvantage may experience advanced immune aging compared to individuals exposed to less socioeconomic disadvantage, and that the observed income gradients in immune aging may be partially explained by immune response to CMV.
To the best of our knowledge, this is the first community-based study to examine the association between socioeconomic status and the distribution of T-cell phenotypes associated with aging. Our novel findings build upon existing evidence from prior studies that have linked psychosocial stressors such as socioeconomic status, immune biomarkers such as CMV IgG antibody levels, and other markers of biological aging such as leukocyte telomere length. For example, using data from a nationally representative sample of 9721 adult participants in the US-based National Health and Nutrition Examination Survey (NHANES), we found that less education and lower income were associated with higher levels of CMV IgG antibodies.(25) Indeed, these measures of socioeconomic status were even more predictive of CMV IgG antibody level than age.(25) Further evidence is provided from a recent study by Rector et al., which found consistent associations between multiple measures of psychosocial stress, including anxiety, depression, vital exhaustion, and lower subjective mental health, and CMV IgG antibody levels among a large occupational cohort in Germany.(34) The association between psychosocial stress and biological aging is also supported by prior studies that have linked psychosocial stressors with reduced leukocyte telomere length-a molecular marker of cellular aging.(27, 28, 51) For example, using data from NHANES, Needham et al. found that lower socioeconomic status as measured by education attainment, but not income, was significantly associated with reduced leukocyte telomere length.(27) Moreover, both CMV seropositivity and elevated IgG antibody levels have been associated with reduced telomerase activity.(52) While telomeres are key molecular markers for understanding cellular aging, assessment of the distribution of T-cell phenotypes provides novel information regarding the biologic integrity of the immune system. Further studies that incorporate phenotypic measures of T-cells along with measures of telomeres could provide a robust understanding of how exposure to stressors may influence the molecular mechanics and ultimately biological changes in the immune system.
Although far fewer studies have been conducted, evidence is also beginning to confirm the association between psychosocial stress and more specific biomarkers of immunosensescence as measured by the distribution of T-cell phenotypes comparable to those we assessed in our study. For example, Sommershof et al. examined the association between traumatic stress exposure and T-cell differentiation in a small case-control study conducted among 46 individuals living in Germany.(53) T-cell subpopulations were classified as naïve (CD45RA+ CCR7+), central memory (TCM: CD45RA− CCR7+) and effector memory (TEM: CD45RA− CCR7− and TEMRA: CD45RA+CCR7−) cells, and the authors found that a diagnosis of posttraumatic stress disorder (PTSD) was associated with a marked reduction in the proportion of naïve T-cells and an increase in the proportion of central (TCM) and effector (TEM) memory T-cells compared to non-PTSD individuals. Although not statistically significant, the authors also observed the same pattern for trauma exposed non-PTSD individuals, suggesting a dose-response in the severity of stressor exposure and immune deregulation.(53) We likewise observed robust results for the association between socioeconomic status and two of the T-cell measures we examined in this study, specifically the CD4 E:N ratio and the CD8 E:N ratio. Due to our limited sample size, we were unable to examine finer gradients of income level to test for a dose response relationship between annual household income level and these T-cell phenotypes. Given the robust associations we observed between dichotomous income level and the E:N ratios in a relatively small sample, future studies with finer assessments of income level in larger samples are warranted.
Although the effect was in the expected direction, we observed less robust and non-significant results for the association between income level and the CD4:CD8 ratio. This may be due in part to the younger age range of our study participants, as over 80% were less than 60 years of age. Indeed, a prior study conducted among a population-based sample in Sweden found that the prevalence of individuals with an inverted CD4:CD8 ratio (i.e. CD4:CD8 ratio <1) doubles from 8% among 20-59 year olds to 16% among 60-94 year olds (16). In our study, the median CD4:CD8 ratio was 2.18, with an interquartile range of 1.65–2.75. Thus, it is likely that we lacked sufficient variation for this outcome in our sample due to the relatively younger age of participants. Given that an inverted CD4:CD8 ratio has been associated with increased mortality (54), future studies should continue to assess how psychosocial factors such as socioeconomic disadvantage affect this ratio as individuals age. However, alternative biomarkers should additionally be considered when assessing the impact of psychosocial stress on immune aging, especially in younger populations.
An important strength of our study is that our sample was drawn from a population-representative sample with a high representation of African Americans and individuals with a range of socioeconomic status. However, our study was limited by a small sample size, which reduced precision of effect estimates and may have also limited our ability to detect statistical significance in some instances. Despite this, we observed several robust associations between income and the E:N ratio in both the CD4 and CD8 T-cell subsets suggesting that these markers are very sensitive to socioeconomic differentials and warrant further investigation in larger samples and other settings. Moreover, our specific goals were to estimate the association between socioeconomic disadvantage and the distribution of T-cell phenotypes, and to assess the mediating role of CMV IgG antibody level. The contribution of other mediating pathways, such as those related to diet and exercise, should also be investigated in future studies. Our mediation analyses should be interpreted with caution given the cross-sectional nature of this study and it should be noted that we use the word “effect” as a proxy for “association” in order to be consistent with the language used in the literature on mediation analysis,(55) which seeks to distinguish between direct and indirect effects. However, data from NHANES showed that non-Hispanic blacks in the US are exposed to CMV by 16 years of age.(56) Therefore, it is likely that CMV infection preceded the T-cell outcomes, which were assessed in middle age. Nonetheless, future studies should consider testing for CMV specific IgM to definitively rule out new CMV infections.
Results from the present study should also be interpreted in light of the fact that individuals who consented to the venipuncture collection and were therefore eligible to be included in the analysis sub-sample were slightly more likely to have a lower annual household income level and education compared to the overall Wave 1 sample, which may have introduced some degree of selection bias. We attempted to minimize this bias by purposively sampling the T-cell sub-sample participants with a goal of creating a sample balanced on education. Indeed, there were no statistically significant differences in sociodemographic characteristics between the full Wave 1 sample and the sub-sample that was tested for markers of immune aging except for in the age distributions, with the sub-sample being slightly younger than the full sample (see Supplemental Table S3). The difference in the age distributions was likely due to the fact that we also purposively sampled with a goal of balancing on age in order to ensure adequate representation across a range of ages. The younger age of the sub-sample compared to the full sample may have also contributed to the subsample having a higher representation of individuals in the lowest income bracket compared to the full Wave 1 sample (i.e., 31.6% with an income <$10K versus 20.5%), although overall the difference in income was not statistically significant (see Supplemental Table S3).
The present study provides a first estimate of the association between socioeconomic status and key cellular markers implicated in immunosenescence in a community-based sample. Our results suggest that there are strong socioeconomic disparities in immunosenescence and that stress-related CMV reactivation could play an important role in this pathway. Importantly, if CMV is predictive of T-cell immunosenence and acts as a mediator of socioeconomic differentials in immunological aging, then interventions that focus on preventing CMV infection or reducing the adverse effects of stress on immune control of CMV may serve to ameliorate social disparities in immune aging. Moreover, CMV IgG antibody levels may provide a potentially important marker for use in social science studies that strive to understand how social determinants influence biology and cellular markers of aging. Indeed, CMV antibody levels have been assayed in several large population-based cohort studies and can readily be evaluated in blood spots at a much lower cost than T-cell phenotyping.(57) Given that immunosenescence is linked to an increase in infectious and non-infectious disease susceptibility as well as mortality, (8, 58, 59) further population level studies of the association between socioeconomic status and immunological markers of aging are urgently needed.
Supplementary Material
Acknowledgments
The Detroit Neighborhood Health Study, which provided data for this secondary analysis, was funded by the National Institutes of Health (grant numbers: DA22720 [DNHS], DA022720-S1 [DNHS PhenX], and RC1MH088283 [DNHS Epigenetics]). The funders had no role in study design, data collection and analysis, decision to publish, or preparation of the manuscript.
Abbreviations
- CDC
Centers for Disease Control and Prevention
- CI
Confidence intervals
- CATI
Computer-assisted telephone interviewing
- CMV
Cytomegalovirus
- DNHS
Detroit Neighborhood Health Study
- E
Effector
- ELISAs
Enzyme-linked immunosorbent assays
- EMA
Ethidium monoazide
- IgG
Immunoglobulin G
- IQR
Interquartile ranges
- mAb
Monoclonal antibodies
- N
Naïve
- NHANES
National Health and Nutrition Examination Survey
- OLS
Ordinary least-squares
- PBMC
Peripheral blood mononuclear cell
Footnotes
Conflicts of Interest: None to declare.
References
- 1.Adler NE, Stewart J. Health disparities across the lifespan: meaning, methods, and mechanisms. Annals of the New York Academy of Sciences. 2010;1186:5–23. doi: 10.1111/j.1749-6632.2009.05337.x. 10.1111/j.1749-6632.2009.05337.x) [DOI] [PubMed] [Google Scholar]
- 2.Braveman Pa, Cubbin C, Egerter S, Williams DR, Pamuk E. Socioeconomic disparities in health in the United States: what the patterns tell us. American journal of public health. 2010;100(Suppl):S186–S196. doi: 10.2105/AJPH.2009.166082. 10.2105/AJPH.2009.166082) [DOI] [PMC free article] [PubMed] [Google Scholar]
- 3.Centers for Disease Control and Prevention. CDC Health Disparities and Inequalities Report — United States, 2013. MMWR. 2013;62 [PubMed] [Google Scholar]
- 4.S. National Center for Health. "Health, United States, 2011: With Special Feature on Socioeconomic Status and Health". Hyattsville, MD: 2012. [PubMed] [Google Scholar]
- 5.Seeman TE, Crimmins E. Social environment effects on health and aging: integrating epidemiologic and demographic approaches and perspectives. Ann N Y Acad Sci. 2001;954:88–117. doi: 10.1111/j.1749-6632.2001.tb02749.x. published online EpubDec ( [DOI] [PubMed] [Google Scholar]
- 6.Steptoe A, Marmot M. The role of psychobiological pathways in socio-economic inequalities in cardiovascular disease risk. Eur Heart J. 2002;23:13–25. doi: 10.1053/euhj.2001.2611. published online EpubJan. [DOI] [PubMed] [Google Scholar]
- 7.Crimmins EM, Kim JK, Seeman TE. Poverty and biological risk: the earlier "aging" of the poor. The journals of gerontology. Series A, Biological sciences and medical sciences. 2009;64:286–292. doi: 10.1093/gerona/gln010. 10.1093/gerona/gln010) [DOI] [PMC free article] [PubMed] [Google Scholar]
- 8.Pawelec G. Hallmarks of human “immunosenescence”: adaptation or dysregulation? Immunity and Ageing. 2012;9 doi: 10.1186/1742-4933-9-15. 10.1186/1742-4933-9-15) [DOI] [PMC free article] [PubMed] [Google Scholar]
- 9.Weiskopf D, Weinberger B, Grubeck-Loebenstein B. The aging of the immune system. Transplant international : official journal of the European Society for Organ Transplantation. 2009;22:1041–1050. doi: 10.1111/j.1432-2277.2009.00927.x. published online EpubNov (10.1111/j.1432-2277.2009.00927.x). [DOI] [PubMed] [Google Scholar]
- 10.Wikby A, Maxson P, Olsson J, Johansson B, Ferguson FG. Changes in CD8 and CD4 lymphocyte subsets, T cell proliferation responses and non-survival in the very old: the Swedish longitudinal OCTO-immune study. Mechanisms of ageing and development. 1998;102:187–198. doi: 10.1016/s0047-6374(97)00151-6. published online EpubMay 15 ( [DOI] [PubMed] [Google Scholar]
- 11.Wikby A, Johansson B, Olsson J, Lofgren S, Nilsson BO, Ferguson F. Expansions of peripheral blood CD8 T-lymphocyte subpopulations and an association with cytomegalovirus seropositivity in the elderly: the Swedish NONA immune study. Experimental gerontology. 2002;37:445–453. doi: 10.1016/s0531-5565(01)00212-1. published online EpubJan-Mar ( [DOI] [PubMed] [Google Scholar]
- 12.Ouyang Q, Wagner WM, Zheng W, Wikby A, Remarque EJ, Pawelec G. Dysfunctional CMV-specific CD8(+) T cells accumulate in the elderly. Experimental gerontology. 2004;39:607–613. doi: 10.1016/j.exger.2003.11.016. published online EpubApr (10.1016/j.exger.2003.11.016). [DOI] [PubMed] [Google Scholar]
- 13.Derhovanessian E, Maier AB, Hahnel K, Zelba H, de Craen AJ, Roelofs H, Slagboom EP, Westendorp RG, Pawelec G. Lower proportion of naive peripheral CD8+ T cells and an unopposed pro-inflammatory response to human Cytomegalovirus proteins in vitro are associated with longer survival in very elderly people. Age. 2013;35:1387–1399. doi: 10.1007/s11357-012-9425-7. published online EpubAug (10.1007/s11357-012-9425-7). [DOI] [PMC free article] [PubMed] [Google Scholar]
- 14.Hadrup SR, Strindhall J, Kollgaard T, Seremet T, Johansson B, Pawelec G, thor Straten P, Wikby A. Longitudinal studies of clonally expanded CD8 T cells reveal a repertoire shrinkage predicting mortality and an increased number of dysfunctional cytomegalovirus-specific T cells in the very elderly. Journal of immunology. 2006;176:2645–2653. doi: 10.4049/jimmunol.176.4.2645. published online EpubFeb 15 ( [DOI] [PubMed] [Google Scholar]
- 15.Derhovanessian E, Maier AB, Beck R, Jahn G, Hahnel K, Slagboom PE, de Craen AJ, Westendorp RG, Pawelec G. Hallmark features of immunosenescence are absent in familial longevity. Journal of immunology. 2010;185:4618–4624. doi: 10.4049/jimmunol.1001629. published online EpubOct 15 (10.4049/jimmunol.1001629). [DOI] [PubMed] [Google Scholar]
- 16.Wikby A, Mansson IA, Johansson B, Strindhall J, Nilsson SE. The immune risk profile is associated with age and gender: findings from three Swedish population studies of individuals 20–100 years of age. Biogerontology. 2008;9:299–308. doi: 10.1007/s10522-008-9138-6. published online EpubOct (10.1007/s10522-008-9138-6). [DOI] [PubMed] [Google Scholar]
- 17.Crimmins E, Vasunilashorn S, Kim JK, Alley D. Biomarkers related to aging in human populations. Advances in clinical chemistry. 2008;46:161–216. doi: 10.1016/s0065-2423(08)00405-8. [DOI] [PMC free article] [PubMed] [Google Scholar]
- 18.Steptoe A. Psychosocial biomarker research: integrating social, emotional and economic factors into population studies of aging and health. Social cognitive and affective neuroscience. 2011;6:226–233. doi: 10.1093/scan/nsq032. 10.1093/scan/nsq032). [DOI] [PMC free article] [PubMed] [Google Scholar]
- 19.Carroll JE, Cohen S, Marsland AL. Early childhood socioeconomic status is associated with circulating interleukin-6 among mid-life adults. Brain, behavior, and immunity. 2011;25:1468–1474. doi: 10.1016/j.bbi.2011.05.016. published online EpubOct (10.1016/j.bbi.2011.05.016). [DOI] [PMC free article] [PubMed] [Google Scholar]
- 20.Friedman EM, Herd P. Income, education, and inflammation: differential associations in a national probability sample (The MIDUS study) Psychosomatic medicine. 2010;72:290–300. doi: 10.1097/PSY.0b013e3181cfe4c2. published online EpubApr (10.1097/PSY.0b013e3181cfe4c2). [DOI] [PMC free article] [PubMed] [Google Scholar]
- 21.Gruenewald TL, Cohen S, Matthews KA, Tracy R, Seeman TE. Association of socioeconomic status with inflammation markers in black and white men and women in the Coronary Artery Risk Development in Young Adults (CARDIA) study. Social science & medicine. 2009;69:451–459. doi: 10.1016/j.socscimed.2009.05.018. published online EpubAug (10.1016/j.socscimed.2009.05.018). [DOI] [PMC free article] [PubMed] [Google Scholar]
- 22.Koster A, Bosma H, Penninx BW, Newman AB, Harris TB, van Eijk JT, Kempen GI, Simonsick EM, Johnson KC, Rooks RN, Ayonayon HN, Rubin SM, Kritchevsky SB. A. B. C. S. Health, Association of inflammatory markers with socioeconomic status. J Gerontol A Biol Sci Med Sci. 2006;61:284–290. doi: 10.1093/gerona/61.3.284. published online EpubMar ( [DOI] [PubMed] [Google Scholar]
- 23.Petersen KL, Marsland AL, Flory J, Votruba-Drzal E, Muldoon MF, Manuck SB. Community socioeconomic status is associated with circulating interleukin-6 and C-reactive protein. Psychosomatic medicine. 2008;70:646–652. doi: 10.1097/PSY.0b013e31817b8ee4. published online EpubJul (10.1097/PSY.0b013e31817b8ee4). [DOI] [PubMed] [Google Scholar]
- 24.Pietras SA, Goodman E. Socioeconomic status gradients in inflammation in adolescence. Psychosomatic medicine. 2013;75:442–448. doi: 10.1097/PSY.0b013e31828b871a. published online EpubJun (10.1097/PSY.0b013e31828b871a). [DOI] [PMC free article] [PubMed] [Google Scholar]
- 25.Dowd JB, Aiello AE. Socioeconomic differentials in immune response. Epidemiology. 2009;20:902–908. doi: 10.1097/EDE.0b013e3181bb5302. published online EpubNov (10.1097/EDE.0b013e3181bb5302). [DOI] [PMC free article] [PubMed] [Google Scholar]
- 26.Dowd JB, Aiello AE, Alley DE. Socioeconomic disparities in the seroprevalence of cytomegalovirus infection in the US population: NHANES III. Epidemiology and infection. 2009;137:58–65. doi: 10.1017/S0950268808000551. published online EpubJan (10.1017/S0950268808000551). [DOI] [PMC free article] [PubMed] [Google Scholar]
- 27.Needham BL, Adler N, Gregorich S, Rehkopf D, Lin J, Blackburn EH, Epel ES. Socioeconomic status, health behavior, and leukocyte telomere length in the National Health and Nutrition Examination Survey, 1999–2002. Social science & medicine. 2013;85:1–8. doi: 10.1016/j.socscimed.2013.02.023. published online EpubMay (10.1016/j.socscimed.2013.02.023). [DOI] [PMC free article] [PubMed] [Google Scholar]
- 28.Needham BL, Fernandez JR, Lin J, Epel ES, Blackburn EH. Socioeconomic status and cell aging in children. Social science & medicine. 2012;74:1948–1951. doi: 10.1016/j.socscimed.2012.02.019. published online EpubJun (10.1016/j.socscimed.2012.02.019). [DOI] [PubMed] [Google Scholar]
- 29.Derhovanessian E, Maier AB, Hahnel K, Beck R, de Craen AJ, Slagboom EP, Westendorp RG, Pawelec G. Infection with cytomegalovirus but not herpes simplex virus induces the accumulation of late-differentiated CD4+ and CD8+ T-cells in humans. The Journal of general virology. 2011;92:2746–2756. doi: 10.1099/vir.0.036004-0. published online EpubDec (10.1099/vir.0.036004-0). [DOI] [PubMed] [Google Scholar]
- 30.Khan N, Shariff N, Cobbold M, Bruton R, Ainsworth JA, Sinclair AJ, Nayak L, Moss PA. Cytomegalovirus seropositivity drives the CD8 T cell repertoire toward greater clonality in healthy elderly individuals. Journal of immunology. 2002;169:1984–1992. doi: 10.4049/jimmunol.169.4.1984. published online EpubAug 15 ( [DOI] [PubMed] [Google Scholar]
- 31.Pawelec G. Immunosenenescence: role of cytomegalovirus. Experimental gerontology. 2014;54:1–5. doi: 10.1016/j.exger.2013.11.010. published online EpubJun (10.1016/j.exger.2013.11.010). [DOI] [PubMed] [Google Scholar]
- 32.Pawelec G, Derhovanessian E. Role of CMV in immune senescence. Virus research. 2011;157:175–179. doi: 10.1016/j.virusres.2010.09.010. published online EpubMay (10.1016/j.virusres.2010.09.010). [DOI] [PubMed] [Google Scholar]
- 33.Pawelec G, Derhovanessian E, Larbi A, Strindhall J, Wikby A. Cytomegalovirus and human immunosenescence. Reviews in medical virology. 2009;19:47–56. doi: 10.1002/rmv.598. published online EpubJan (10.1002/rmv.598). [DOI] [PubMed] [Google Scholar]
- 34.Rector JL, Dowd JB, Loerbroks A, Burns VE, Moss PA, Jarczok MN, Stalder T, Hoffman K, Fischer JE, Bosch JA. Consistent associations between measures of psychological stress and CMV antibody levels in a large occupational sample. Brain, behavior, and immunity. 2014;38:133–141. doi: 10.1016/j.bbi.2014.01.012. published online EpubMay (10.1016/j.bbi.2014.01.012). [DOI] [PubMed] [Google Scholar]
- 35.Kristenson M, Eriksen HR, Sluiter JK, Starke D, Ursin H. Psychobiological mechanisms of socioeconomic differences in health. Social science & medicine. 2004;58:1511–1522. doi: 10.1016/S0277-9536(03)00353-8. published online EpubApr (10.1016/S0277-9536(03)00353-8 S0277953603003538 [pii]). [DOI] [PubMed] [Google Scholar]
- 36.Horesh D, Lowe SR, Galea S, Uddin M, Koenen KC. Gender Differences in the Long-Term Associations between Posttraumatic Stress Disorder and Depression Symptoms: Findings from the Detroit Neighborhood Health Study. Depression and anxiety. 2014 doi: 10.1002/da.22267. published online EpubJul 10 (10.1002/da.22267). [DOI] [PMC free article] [PubMed] [Google Scholar]
- 37.Goldmann E, Aiello A, Uddin M, Delva J, Koenen K, Gant LM, Galea S. Pervasive exposure to violence and posttraumatic stress disorder in a predominantly African American Urban Community: the Detroit Neighborhood Health Study. Journal of traumatic stress. 2011;24:747–751. doi: 10.1002/jts.20705. published online EpubDec (10.1002/jts.20705). [DOI] [PMC free article] [PubMed] [Google Scholar]
- 38.Uddin M, Aiello AE, Wildman DE, Koenen KC, Pawelec G, de Los Santos R, Goldmann E, Galea S. Epigenetic and immune function profiles associated with posttraumatic stress disorder. Proceedings of the National Academy of Sciences of the United States of America. 2010;107:9470–9475. doi: 10.1073/pnas.0910794107. published online EpubMay 18 (10.1073/pnas.0910794107). [DOI] [PMC free article] [PubMed] [Google Scholar]
- 39.United States Census Bureau. "2005–2007 American Community Survey 3-Year Estimates" [Google Scholar]
- 40.Uddin M, Aiello AE, Wildman DE, Koenen KC, Pawelec G, de Los Santos R, Goldmann E, Galea S. Epigenetic and immune function profiles associated with posttraumatic stress disorder. Proceedings of the National Academy of Sciences of the United States of America. 2010;107:9470–9475. doi: 10.1073/pnas.0910794107. 10.1073/pnas.0910794107). [DOI] [PMC free article] [PubMed] [Google Scholar]
- 41.Dickerson FB, Boronow JJ, Stallings C, Origoni AE, Ruslanova I, Yolken RH. Association of serum antibodies to herpes simplex virus 1 with cognitive deficits in individuals with schizophrenia. Archives of General Psychiatry. 2003;60:466–472. doi: 10.1001/archpsyc.60.5.466. 10.1001/archpsyc.60.5.466). [DOI] [PubMed] [Google Scholar]
- 42.Derhovanessian E, Theeten H, Hähnel K, Van Damme P, Cools N, Pawelec G. Cytomegalovirus-associated accumulation of late-differentiated CD4 T-cells correlates with poor humoral response to influenza vaccination. Vaccine. 2013;31:685–690. doi: 10.1016/j.vaccine.2012.11.041. published online EpubFeb 11 (10.1016/j.vaccine.2012.11.041). [DOI] [PubMed] [Google Scholar]
- 43.Derhovanessian E, Maier AB, Beck R, Jahn G, Hähnel K, Slagboom PE, de Craen AJM, Westendorp RGJ, Pawelec G. Hallmark features of immunosenescence are absent in familial longevity. Journal of immunology (Baltimore, Md. : 1950) 2010;185:4624. doi: 10.4049/jimmunol.1001629. published online EpubOct 15 (10.4049/jimmunol.1001629). [DOI] [PubMed] [Google Scholar]
- 44.Romero P, Zippelius A, Kurth I, Pittet MJ, Touvrey C, Iancu EM, Corthesy P, Devevre E, Speiser DE, Rufer N. Four functionally distinct populations of human effector-memory CD8+ T lymphocytes. Journal of immunology (Baltimore, Md. : 1950) 2007;178:4119, 4112. doi: 10.4049/jimmunol.178.7.4112. published online EpubMay 01 ( [DOI] [PubMed] [Google Scholar]
- 45.Centers for Disease Control and Prevention. 2005 [Google Scholar]
- 46.Hayes A. 2012 [Google Scholar]
- 47.Preacher KJ, Hayes AF. Asymptotic and resampling strategies for assessing and comparing indirect effects in multiple mediator models. Behavior research methods. 2008;40:879–891. doi: 10.3758/brm.40.3.879. published online EpubAug ( [DOI] [PubMed] [Google Scholar]
- 48.Efron B. Better bootstrap confidence intervals. Journal of the American Statistical Association. 1987;82:171–185. [Google Scholar]
- 49.Efron B, Tibshrani R. An introduction to the bootstrap. Boca Raton, FL: Chapman & Hall; 1993. [Google Scholar]
- 50.Dowd JB, Palermo T, Chyu L, Adam E, McDade TW. Re: Childhood adversity and cell-mediated immunity in young adulthood. Brain, behavior, and immunity. 2013;34:176. doi: 10.1016/j.bbi.2013.08.003. published online EpubNov (10.1016/j.bbi.2013.08.003). [DOI] [PubMed] [Google Scholar]
- 51.Litzelman K, Witt WP, Gangnon RE, Nieto FJ, Engelman CD, Mailick MR, Skinner HG. Association between informal caregiving and cellular aging in the survey of the health of wisconsin: the role of caregiving characteristics, stress, and strain. American journal of epidemiology. 2014;179:1340–1352. doi: 10.1093/aje/kwu066. published online EpubJun 1 (10.1093/aje/kwu066). [DOI] [PMC free article] [PubMed] [Google Scholar]
- 52.Dowd JB, Bosch JA, Steptoe A, Blackburn EH, Lin J, Rees-Clayton E, Aiello AE. Cytomegalovirus is associated with reduced telomerase activity in the Whitehall II cohort. Experimental gerontology. 2013;48:385–390. doi: 10.1016/j.exger.2013.01.016. published online EpubApr (10.1016/j.exger.2013.01.016). [DOI] [PMC free article] [PubMed] [Google Scholar]
- 53.Sommershof A, Aichinger H, Engler H, Adenauer H, Catani C, Boneberg EM, Elbert T, Groettrup M, Kolassa IT. Substantial reduction of naive and regulatory T cells following traumatic stress. Brain, behavior, and immunity. 2009;23:1117–1124. doi: 10.1016/j.bbi.2009.07.003. published online EpubNov (10.1016/j.bbi.2009.07.003). [DOI] [PubMed] [Google Scholar]
- 54.Strindhall J, Skog M, Ernerudh J, Bengner M, Lofgren S, Matussek A, Nilsson BO, Wikby A. The inverted CD4/CD8 ratio and associated parameters in 66-year-old individuals: the Swedish HEXA immune study. Age. 2013;35:985–991. doi: 10.1007/s11357-012-9400-3. published online EpubJun (10.1007/s11357-012-9400-3). [DOI] [PMC free article] [PubMed] [Google Scholar]
- 55.Richiardi L, Bellocco R, Zugna D. Mediation analysis in epidemiology: methods, interpretation and bias. International journal of epidemiology. 2013;42:1511–1519. doi: 10.1093/ije/dyt127. published online EpubOct (10.1093/ije/dyt127). [DOI] [PubMed] [Google Scholar]
- 56.Colugnati FA, Staras SA, Dollard SC, Cannon MJ. Incidence of cytomegalovirus infection among the general population and pregnant women in the United States. BMC infectious diseases. 2007;7:71. doi: 10.1186/1471-2334-7-71. 10.1186/1471-2334-7-71) [DOI] [PMC free article] [PubMed] [Google Scholar]
- 57.Dowd JB, Aiello AE, Chyu L, Huang YY, McDade TW. Cytomegalovirus antibodies in dried blood spots: a minimally invasive method for assessing stress, immune function, and aging. Immunity & ageing : I & A. 2011;8:3. doi: 10.1186/1742-4933-8-3. 10.1186/1742-4933-8-3) [DOI] [PMC free article] [PubMed] [Google Scholar]
- 58.Dorrington MG, Bowdish DM. Immunosenescence and novel vaccination strategies for the elderly. Frontiers in immunology. 2013;4:171. doi: 10.3389/fimmu.2013.00171. 10.3389/fimmu.2013.00171) [DOI] [PMC free article] [PubMed] [Google Scholar]
- 59.Lang PO, Govind S, Aspinall R. Reversing T cell immunosenescence: why, who, and how. Age. 2013;35:609–620. doi: 10.1007/s11357-012-9393-y. published online EpubJun (10.1007/s11357-012-9393-y). [DOI] [PMC free article] [PubMed] [Google Scholar]
Associated Data
This section collects any data citations, data availability statements, or supplementary materials included in this article.