

Abstract
Quantitating and understanding the physical forces responsible for the interactions of biomolecules is fundamental to the biological sciences. Addressing this question for membrane proteins is especially challenging because they are embedded within cellular bilayers that provide a unique medium in which hydrophobic sequences must fold. Knowledge of the energetics of protein-lipid interactions is thus vital to understand cellular processes involving membrane proteins. Here we used a host-guest mutational strategy to calculate the Gibbs free energy changes of water-to-lipid transfer for the aromatic side chains Trp, Tyr, and Phe as a function of depth in the membrane. This work reveals an energetic gradient in transfer free energies for Trp and Tyr, where transfer was most favorable to the membrane interfacial region and comparatively less favorable into the bilayer center. The transfer energetics follow the concentration gradient of polar atoms across the bilayer normal that is naturally occurring in biological membranes. Additional measurements revealed nearest neighbor coupling in the dataset influenced by a network of aromatic side chains in the host protein. Together, this work shows aromatic side chains contribute significantly to membrane protein stability through either aromatic-aromatic interactions or placement at the membrane interface.
Graphical abstract
Introduction
Membranes are physical barriers of the cell that enclose and protect cellular processes. Proteins that fold into the membrane are important for sensing and reacting to biological signals in the extracellular environment. Some ways that membrane proteins respond to such stimuli are through ligand binding, allostery, or conformational change. Because a significant amount of membrane protein surface area is embedded within the bilayer, the magnitudes of membrane protein-lipid interactions are essential to interrogate the stabilities and structures of these biologically-relevant states. Moreover, because membrane proteins comprise about 60% of drug targets,1 a complete understanding of membrane protein interactions is vital for interpreting disease-causing mutations and will aid in the design and improvement of drugs.
The chemistry of side chains defines membrane protein structures within lipid bilayers. For example consider the hydrophobic effect in protein folding, where the exclusion of nonpolar side chains by water is a large entropic driving force for the unfolded-to-folded transition.2 For soluble proteins, hydrophobic collapse shapes the native structure by largely burying nonpolar side chains in the interior while leaving polar/charged groups facing bulk water.3 Similarly, nonpolar side chains in membrane proteins are enriched on the folded protein surface where they are exposed to the phospholipid solvent.4
In addition, the first membrane protein crystal structures revealed a striking pattern in the spatial positioning of lipid-facing Trp and Tyr side chains along the bilayer normal.5 This observation was confirmed by Wallin et al. with an analysis of side chain distributions in cytochrome C oxidase.6 This analysis has since been extended by independent studies from Ulmschneider et al. and Senes et al. with large sets of α-helical crystal structures, which showed the statistical enrichment of Trp and Tyr at the interfacial region.7,8 In addition to Trp and Tyr, Phe also shows a similar enrichment in β-barrel structures as demonstrated by Hsieh et al. and Slusky & Dunbrack.9,10 These side chains form an aromatic “belt” around the protein located at the water-hydrocarbon interface that has been proposed to “anchor” membrane protein structure to the bilayer.11
Trp and Tyr are composed of an aromatic ring and contain heavy atoms that are traditional hydrogen bond donors. Jacobs et al. have shown that Trp pentapeptides partition into the interfacial region of 1,2-dioleoyl-sn-glycero-3-phosphocholine (DOPC) membranes. These authors noted that the amphiphilic character of the Trp side chains is important for interfacial localization as this region provides a complimentary chemical environment.12 Correspondingly, Wimley and White have shown that Trp, Tyr, and Phe partition with favorable free energies in water-to-interface measurements with a rank order of Trp>Phe>Tyr.13 However, traditional hydrogen bonding may be less important than previously thought. In a nuclear magnetic resonance (NMR) study by Yau et al., the location of Trp analogs (including indene, which lacks hydrogen bond donors) in a 1-palmitoyl-2-oleoyl-sn-glycero-3-phosphocholine (POPC) membrane showed all analogs partitioned near the glycerol region. This suggests that the preference for this area of the membrane is not dependent on hydrogen bonding alone. Instead, the authors concluded that the large, flat shape of Trp may be responsible for exclusion from the hydrophobic core because entropically this packing would be unfavorable.14
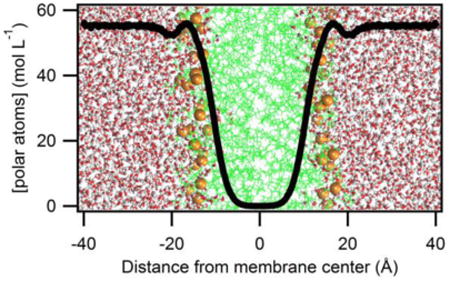
Experimental studies with model systems have attempted to address this question of energetics in membranes. As Wolfenden recently reviewed, a simple conclusion is not straightforward because the chemical nature of non-polar solvents and the solubility of water within them can change the rank order of water-to-solvent transfer free energies.15 And it is well established that the water concentration in a membrane is not constant. As shown by Wiener, Wimley & White, the biological membrane naturally possesses a gradient of polarity due largely to a changing water density across the bilayer.16,17 MacCallum & Tieleman described this steep concentration gradient as occurring on a nanometer length scale.18 Overall, it is clear that this property of the lipid bilayer represents a sharply changing chemical environment for side chain-lipid interactions. From a physical chemistry view, the energetic contributions of side chains to membrane protein folding should reflect this changing environment within an actual membrane.
In this work, we measured the water-to-lipid transfer free energies for the Trp, Tyr, and Phe side chains as a function of depth across the bilayer normal. As opposed to non-polar solvents our experiments use actual lipid-bilayers that contain the polarity gradient found in biological membranes. Such bilayers are also well described by MD simulations and provide atomistic views of the structure that may inform on the energetics. We found that Trp and Tyr thermodynamically prefer the membrane interface, which is more hydrated than the membrane center. The energy data were well modeled using the concentration of polar atoms present at host sites calculated from a neat DLPC MD simulation. Our results are the first to show experimentally that aromatic side chains favorably contribute to membrane protein stability in a membrane depth-dependent manner in which partitioning to the interface is favored over burial in the center.
Results
Aromatic side chain energies are most favorable at the membrane interface
Figure 1A shows the host sites for mutagenesis in outer membrane phospholipase A (OmpLA, native to Escherichia coli, all variants are shown in Table S1). Figure 1B shows the thermodynamic cycle used to calculate the Gibbs free energy of water-to-lipid transfer relative to alanine mutations. We verified that all variants fold reversibly and are enzymatically active when folded (Figures S1-2).
Figure 1.

The thermodynamic cycle illustrating how water-to-lipid side chain energies are calculated. (A) Shown is a snapshot from a MD simulation of OmpLA (pdb 1qd5)19 embedded in a DLPC membrane. Lipid tails are shown in green lines and phosphorous atoms as gold spheres. Highlighted in cyan are the Cα atoms of host sites with residue numbers indicated. This image was created using VMD.20 (B) The thermodynamic cycle used to determine side chain hydrophobicity. Vertical reactions are experimentally accessible with chemical denaturation. Horizontal reactions are theoretically possible, but not accessible by experiment. The abbreviation Aro is used to describe any of Trp, Tyr, or Phe side chains.
Folding titrations using chemical denaturation were fit (Figure S3) to determine the folding free energies (Table S2) of all variants, and ΔΔG°W,L were calculated (Table S3) according to the equation shown in Figure 1B. For variants 173Y and 173W the transfer free energies were determined with a reference state where Y195 was mutated to Ala (e.g. 173A-195A). We gained a data point in the Trp and Tyr data from our double variant cycle analysis with site 195 presented in the next section.
Shown in Figure 2A-B are the transfer free energies determined for the aromatic side chains. These data indicate that all lipid-facing point mutations to the aromatic side chains either maintained (ΔΔG°W,L near zero) or increased (negative ΔΔG°W,L) the folding stability of OmpLA relative to Ala mutations. Moreover, we observed an energetic gradient for Trp and Tyr where the greatest contribution to membrane protein stability was found for sites located in the membrane interface. For Trp it can be observed that the free energy of stabilization approaches -3.5 kcal mol-1 in the interfacial region; Trp sites located near the membrane center are only stabilizing by about -1 kcal mol-1. Similar behavior was found for Tyr, where the stabilization energy approaches -2.5 kcal mol-1 in the interfacial region but is only about -0.5 kcal mol-1 at the membrane center. In contrast, Phe showed no strong depth-dependence with stabilization energies in the range of -2 to -3 kcal mol-1 across the entire bilayer.
Figure 2.

Aromatic side chain water-to-lipid transfer free energies show a depth-dependence correlated with the concentration of polar atoms at the membrane positions of host sites. Side chain identities are located in the top-left of each panel in one letter codes; shown in the lower-left corners are the coefficient of determinations (R2) from linear fits. Each fit is shown in black, and the confidence bands at a 95% interval are shown in the grey shaded region. The beginning of the interfacial region is indicated as dashed lines and is defined as the maximal position of the carbonyl functional groups (12 Å, occurs at 39 M [polar atoms]). Standard errors are shown from independent titrations (n=2). (A) Transfer free energies plotted as s function of the depth of host sites. Intercept for these fits are -0.474, 0.164, and -2.293 kcal mol-1 for Trp, Tyr, and Phe respectively. Slopes are -0.199, -0.163, and -0.027 kcal mol-1Å-1 for Trp, Tyr, and Phe respectively. (B) Transfer free energies plotted as a function of the [polar atoms] at the depths of host sites are shown on a log scale. From the linear fits, slopes were found to be -0.0486, -0.0491, and -0.0132 kcal L mol-2 and intercepts were determined to be -1.263, -0.423, and -2.313 kcal mol-1 for Trp, Tyr and Phe, respectively.
Hydrophobicity is a defining force in protein folding and water-to-nonpolar transfer free energies are intimately related to the re-arrangement of water molecules. When a hydrophobic molecule (i.e. hydrophobe) is placed in water it is unable to participate in hydrogen bonding, which causes an ordering of water molecules around the hydrophobe. This ordering of water disrupts the hydrogen bonding network present in liquid water. However, if this hydrophobe is transferred from water into a hydrophobic medium, there is an overall gain in entropy of the system because the bulk water gains higher configurational entropy. This increase in entropy is a large component of the free energy of this transfer (e.g. -TΔS). Because the membrane naturally possesses a changing density of polar atoms, we hypothesized that depth-dependent side chain hydrophobicities reflect this physical property.
To test this idea we sought a correlation between the transfer free energy data (ΔΔG°W,L) with the concentration of polar atoms present at the depths of host sites. The SI methods, Figures S4-8 and Tables S6-8 describe the procedure used to arrive at Figure 2B. Fits to these data indicated that the concentration polar atoms at host sites was best correlated with our measurements (Table S9). Further inspection of the Trp and Tyr fits show that transfer free energies are flat in the membrane center, indicating that the hydrophobicity is constant where the concentration of polar atoms is also constant. This analysis shows the concentration of polar atoms across the membrane normal is an important parameter in modeling water-to-lipid transfer free energies.
Aromatic-aromatic interactions can make significant contributions to the cooperative folding energies of membrane proteins
In addition to a depth dependence of the energetics across the bilayer normal, we identified significant aromatic interactions with a native Tyr (residue number 195) upon introduction of either Tyr or Trp side chains at host site 173 (Figure 3A). These pairs are located on the lipid-facing surface and sites are on adjacent strands, which form a cross-strand interaction. Cooperative interaction energies for YY pairs (Y195 and 173Y) or YW pairs (Y195 and 173W) were derived from double variant cycles following the method of Serrano et al.21 We additionally measured the interaction energy of a “flipped” WY pair (195W and 173Y). Folding data for these variants are shown in supplemental Figure S9, folding free energy notations of variants are shown in Table S10. Double variant cycles are illustrated in Figure 3A and show the magnitudes of interaction energies between these pairs varied from favorable (-2.12 ± 0.19 and -0.67 ± 0.42 kcal mol-1 for YY and YW, respectively) to unfavorable (+0.25 ± 0.42 kcal mol-1 for WY).
Figure 3.
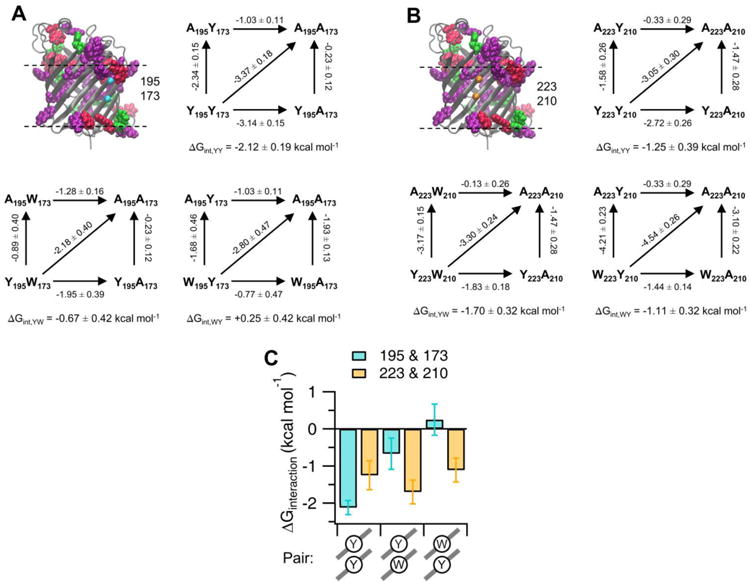
The coupling of aromatic pairwise interactions is influenced by an aromatic network. (A) Coupling energetics measured at sites 195 and 173. In cyan spheres are the Cα of host sites on the lipid-facing surface of OmpLA. Double variant cycles used to determine the interaction energies between aromatic pairs are shown. The interaction energy is calculated as previously described21 and is underneath each cycle. Numbers by the arrows indicate the difference in stabilities between variants and are in units of kcal mol-1. Highlighted are the aromatic side chains Trp (pink), Tyr (purple), and Phe (green) from a WT MD simulation and planes of the phosphorous atoms are shown as dashed lines. (B) Same as in (A) for pairs measured at sites 223 and 210, shown as orange spheres. (C) Summary of the measured interaction energies. The cross-strand pair types are illustrated schematically below the bar graph. Standard errors are shown from independent titrations (n=2). Protein images were generated using VMD.20
The physical explanation for these results is complex. Interaction energies between aromatic pairs may vary because of the chemical composition, the orientation of these side chains or other factors such as protein or lipid environment. Despite being composed of identical side chains, the interaction magnitudes between YW and the flipped WY pairs were the most different from each other. Confounding a simple interpretation is the observation that the interaction magnitudes of FF or YY pairs were found to be identical (-1.3 kcal mol-1) when introduced on the surface of the soluble protein barnase.21 An additional factor for consideration is that inspection of the side chains surrounding site 195 in the crystal structure of OmpLA reveals that it is part of a larger aromatic network composed of Trp and Tyr side chains located at the membrane interface (Figure 3A).
To test if an aromatic network could influence the pairwise energetics, we engineered these aromatic pairs at different host sites (A223 and A210) that were devoid of aromatics within the surrounding side chains and located at the same z-depth in the membrane as sites 195 and 173 (Figure 3B). Double variant cycles at these sites are shown in Figure 3B, and folding free energies are in Table S10 and Figure S9. As shown in Figure 3C (gold), compared with magnitudes at sites 195 and 173 (cyan), these experiments revealed that the interaction energies were instead favorable in all cases and within error of each other at this control location. Taken together, these data demonstrated that aromatic-aromatic interactions are influenced by the presence of aromatic networks.
Discussion
Using double variant cycle analysis of membrane protein folding into lipid vesicles, we measured the water-to-lipid transfer free energies of aromatic amino acid side chains as a function of the depth in the bilayer. In contrast to an early study,22 our measurements indicate a thermodynamic enhancement for Trp and Tyr at the membrane interface as compared to the bilayer center. Our work shows that the depth-dependent free energy changes are well described by the concentration of polar atoms present in the membrane polarity gradient. We rationalize that the physical basis for our results is dominated by the interactions between aromatic groups and water and is therefore modulated by the steeply changing concentration of water across the bilayer. In contrast to hydrophobicity measurements carried out in non-polar solvents, our usage of phospholipid bilayers as our hydrophobic “solvent” allows us to naturally access this steeply changing gradient in our interrogation of water-to-bilayer solvation energies. For this reason, we expect that our findings will be generally applicable to bilayers composed of many lipid types and membrane thicknesses. For instance, the head group identity should not significantly affect the polar atom concentration gradient, especially near the membrane center. Similarly, the energetic gradient is relevant to membranes with greater hydrophobic thicknesses than employed here because increases in hydrophobic thickness will only enlarge the z-range over which the water concentrations are essentially constant (and low) in the center of the bilayer.
In addition to aromatic placement at the membrane interface, aromatic-aromatic pairwise interactions can be significant to membrane protein stability. As observed previously23 the magnitudes of these coupling energies can be on the order of the transfer free energies alone. However, it is also clear that these nearest neighbor interactions will depend on the local environment as one pair (195W/173Y) was found to show an unfavorable coupling energy that may have been influenced by nearby aromatic clusters. Further investigation of this issue is required to elucidate the energetic and structural details of such interactions, which can be important because such networks are enriched in thermophilic proteins24 and line the drug pockets of many enzymes.25
Membrane protein structures are known to be enriched in aromatic side chains forming aromatic “belts” in protein regions located at the bilayer interface. Our energetic trends recapitulate this fundamental observation and provide strong evidence for the energetic “anchoring” that is often invoked by this structural motif. Excellent quantitative agreement is found with the Wimley-White interfacial scale for Trp and Tyr (Figure S10).13 However, a quantitative comparison between our energetic values and previous translocon-derived,26 statistical,9 or computational estimates18,27 results in a low correlation coefficient (Table S11-12 and Figures S10-11). We rationalize this by suggesting that these various methods measure the energetics in very different ways. For example, the experimentally-derived translocon data has a different reference state than utilized in our experiments here.28 Moreover, pseudo Boltzmann energies from statistical analyses measuring the frequency of lipid-facing amino acids8,9 do not account for the possibility that lipid-facing residues may also be there to play a functional role. Finally, potentials of mean force calculations derived from prior MD simulations depend on the accuracy of the force fields that do not generally account for the polarizability intrinsic to aromatic side chain chemistry.29
In conclusion, our results bring clarity to an understanding of how the steeply changing polarity gradient of the biological lipid bilayer can modulate the energetics of membrane proteins. At the same time, the nearest neighbor coupling energies uncover increasing complexity in the forces stabilizing them.
Supplementary Material
Acknowledgments
We thank Margo Goodall, Dr. Nathan Zaccai, and the QB3 macrolab for assistance in cloning the variants in this study and Dr. Patrick Fleming for guidance on the molecular dynamics simulations.
Funding Sources: This work was funded by grants NIH R01 GM079440 and T32 GM008403.
Abbreviations
- AIC
Aikaike's information criterion
- DLPC
1,2-didodecanoyl-sn-glycero-3-phosphocholine
- DOPC
1,2-dioleoyl-sn-glycero-3-phosphocholine
- LUV
large unilamellar vesicles
- MD
molecular dynamics
- OmpLA
outer membrane phospholipase A
- PMF
potential of mean force
- POPC
1-palmitoyl-2-oleoyl-sn-glycero-3-phosphocholine
- VMD
visual molecular dynamics
Footnotes
Supporting Information: The supporting information is available free of charge via the Internet at http://pubs.acs.org.
Supporting information includes methods, tables, and figures.
Author Contributions: The manuscript was written through contributions of all authors. / All authors have given approval to the final version of the manuscript.
References
- 1.Yildirim MA, Goh KI, Cusick ME, Barabasi AL, Vidal M. Nat Biotechnol. 2007;25:1119. doi: 10.1038/nbt1338. [DOI] [PubMed] [Google Scholar]
- 2.Dill KA. Biochemistry. 1990;29:7133. doi: 10.1021/bi00483a001. [DOI] [PubMed] [Google Scholar]
- 3.Rose GD, Geselowitz AR, Lesser GJ, Lee RH, Zehfus MH. Science. 1985;229:834. doi: 10.1126/science.4023714. [DOI] [PubMed] [Google Scholar]
- 4.Rees DC, DeAntonio L, Eisenberg D. Science. 1989;245:510. doi: 10.1126/science.2667138. [DOI] [PubMed] [Google Scholar]
- 5.Schiffer M, Chang CH, Stevens F. Protein Eng. 1992;5:213. doi: 10.1093/protein/5.3.213. [DOI] [PubMed] [Google Scholar]
- 6.Wallin E, Tsukihara T, Yoshikawa S, von Heijne G, Elofsson A. Protein Sci. 1997;6:808. doi: 10.1002/pro.5560060407. [DOI] [PMC free article] [PubMed] [Google Scholar]
- 7.Ulmschneider MB, Sansom MS, Di Nola A. Proteins: Struct Funct Bioinf. 2005;59:252. doi: 10.1002/prot.20334. [DOI] [PubMed] [Google Scholar]
- 8.Senes A, Chadi DC, Law PB, Walters RF, Nanda V, Degrado WF. J Mol Biol. 2007;366:436. doi: 10.1016/j.jmb.2006.09.020. [DOI] [PubMed] [Google Scholar]
- 9.Hsieh D, Davis A, Nanda V. Protein Sci. 2012;21:50. doi: 10.1002/pro.758. [DOI] [PMC free article] [PubMed] [Google Scholar]
- 10.Slusky JS, Dunbrack RL., Jr Bioinformatics. 2013;29:2122. doi: 10.1093/bioinformatics/btt355. [DOI] [PMC free article] [PubMed] [Google Scholar]
- 11.Killian JA, von Heijne G. Trends Biochem Sci. 2000;25:429. doi: 10.1016/s0968-0004(00)01626-1. [DOI] [PubMed] [Google Scholar]
- 12.Jacobs RE, White SH. Biochemistry. 1989;28:3421. doi: 10.1021/bi00434a042. [DOI] [PubMed] [Google Scholar]
- 13.Wimley WC, White SH. Nat Struct Biol. 1996;3:842. doi: 10.1038/nsb1096-842. [DOI] [PubMed] [Google Scholar]
- 14.Yau WM, Wimley WC, Gawrisch K, White SH. Biochemistry. 1998;37:14713. doi: 10.1021/bi980809c. [DOI] [PubMed] [Google Scholar]
- 15.Wolfenden R. J Gen Physiol. 2007;129:357. doi: 10.1085/jgp.200709743. [DOI] [PMC free article] [PubMed] [Google Scholar]
- 16.Wiener MC, White SH. Biophys J. 1992;61:434. doi: 10.1016/S0006-3495(92)81849-0. [DOI] [PMC free article] [PubMed] [Google Scholar]
- 17.White SH, Wimley WC. Biochim Biophys Acta. 1998;1376:339. doi: 10.1016/s0304-4157(98)00021-5. [DOI] [PubMed] [Google Scholar]
- 18.MacCallum JL, Bennett WF, Tieleman DP. Biophys J. 2008;94:3393. doi: 10.1529/biophysj.107.112805. [DOI] [PMC free article] [PubMed] [Google Scholar]
- 19.Snijder HJ, Ubarretxena-Belandia I, Blaauw M, Kalk KH, Verheij HM, Egmond MR, Dekker N, Dijkstra BW. Nature. 1999;401:717. doi: 10.1038/44890. [DOI] [PubMed] [Google Scholar]
- 20.Humphrey W, Dalke A, Schulten K. J Mol Graph. 1996;14:33. doi: 10.1016/0263-7855(96)00018-5. [DOI] [PubMed] [Google Scholar]
- 21.Serrano L, Bycroft M, Fersht AR. J Mol Biol. 1991;218:465. doi: 10.1016/0022-2836(91)90725-l. [DOI] [PubMed] [Google Scholar]
- 22.Hong H, Rinehart D, Tamm LK. Biochemistry. 2013;52:4413. doi: 10.1021/bi400344b. [DOI] [PMC free article] [PubMed] [Google Scholar]
- 23.Hong H, Park S, Jimenez RH, Rinehart D, Tamm LK. J Am Chem Soc. 2007;129:8320. doi: 10.1021/ja068849o. [DOI] [PubMed] [Google Scholar]
- 24.Kannan N, Vishveshwara S. Protein Eng. 2000;13:753. doi: 10.1093/protein/13.11.753. [DOI] [PubMed] [Google Scholar]
- 25.Chourasia M, Sastry GM, Sastry GN. Int J Biol Macromol. 2011;48:540. doi: 10.1016/j.ijbiomac.2011.01.008. [DOI] [PubMed] [Google Scholar]
- 26.Hessa T, Meindl-Beinker NM, Bernsel A, Kim H, Sato Y, Lerch-Bader M, Nilsson I, White SH, von Heijne G. Nature. 2007;450:1026. doi: 10.1038/nature06387. [DOI] [PubMed] [Google Scholar]
- 27.Lin M, Gessmann D, Naveed H, Liang J. J Am Chem Soc. 2016;138:2592. doi: 10.1021/jacs.5b10307. [DOI] [PMC free article] [PubMed] [Google Scholar]
- 28.Capponi S, Heyden M, Bondar AN, Tobias DJ, White SH. Proc Natl Acad Sci. 2015;112:9016. doi: 10.1073/pnas.1424483112. [DOI] [PMC free article] [PubMed] [Google Scholar]
- 29.Tsuzuki S, Uchimaru T. Curr Org Chem. 2006;10:745. [Google Scholar]
Associated Data
This section collects any data citations, data availability statements, or supplementary materials included in this article.