Abstract
Conducting and analyzing clinical trials in vulnerable neonates are extremely challenging. The aim of this analysis is to develop a morphine population pharmacokinetics (PK) model using data collected during a randomized control trial in neonates with Abstinence Syndrome (NAS). Three compartment morphine structural PK model after intravenous (IV) administration from previously published work was utilized as prior, while allometric scaling method with physiological consideration was used to extrapolate PK profile from adults to pediatrics. Absorption rate constant and bioavailability were estimated in neonates with abstinence syndrome after oral administration of diluted tincture of opium (DTO). Goodness-of fit plots along with normalized prediction distribution error and bootstrap method were performed for model evaluation. We successfully extrapolated the PK profile from adults to pediatrics after IV administration. The estimated first-order absorption rate constant and bioavailability were 0.751 hour-1 and 48.5%, respectively. Model evaluations showed that the model can accurately and precisely describe the observed data. The population pharmacokinetic model we derived for morphine after oral administration of DTO is reasonable and acceptable; therefore, it can be used to describe the PK and guide future studies. The integration of the previous population PK knowledge as prior information successfully overcomes the logistic and practical issue in vulnerable neonate population.
Keywords: morphine, diluted tincture of opium, bioavailability, population pharmacokinetic model, neonate, neonatal abstinence syndrome
Introduction
Neonatal Abstinence Syndrome (NAS) is a clinical syndrome of opiate withdrawal in neonates exposed to drugs prenatally via chronic maternal opiate use. The syndrome is comprised of a combination of central nervous system, digestive system and autonomic system abnormalities after birth that results from uninhibited excitatory neurotransmitter release from the neurons that have been chronically exposed to opiates in utero. The main symptoms include tremors, hyperactive reflexes, disturbed sleep, poor feeding and failure to thrive. Neonates at risk of NAS are monitored closely with physiologic scoring systems1 to rate severity of withdrawal and determine when non-pharmacologic therapies have failed and pharmacologic therapy is warranted. Morphine is the standard first line pharmacotherapy in Neonatal Abstinence Syndrome (NAS)2. The current population pharmacokinetic (PK) analysis was based on data collected in a randomized controlled trial of adjunct therapy with clonidine vs placebo in prenatally exposed neonates treated with diluted tincture of opium (DTO) for NAS3.
The active ingredient of DTO is morphine, with every 1 ml of DTO containing 0.04 mg morphine equivalent. There are many studies investigating the pharmacology of parenteral morphine in neonates, but there are currently no studies of the PK of enteral morphine in neonates. Several publications describing the population PK of morphine in pediactrics4–8 have been published. Bouwmeester4 and Anand6 used the maturation model to describe the physiological development of clearance and volume of distribution. Knibbe7 developed another model to account for the maturation and development of clearance and volume of distribution in pediatrics. Holford5 evaluated the models above and updated their previous model published in 20086. While Krekel9 provide another review of Bouwmeester's and Knibbe's models, Wang et al8 published another morphine PK model in adults and pediatrics using an empirical exponent on the commonly used allometric scaling. However, all of these models focused on intravenous administration of morphine.
The general lack of PK knowledge about enteral DTO or morphine in neonates leaves the clinician to empiric dosing of the opiate and often leads to undertreatment of the symptoms while the dose is titrated to maximal effect and NAS is brought under symptomatic control. The extended titration phase as well as weaning off phase result in increased duration of hospital stay. The aim of this analysis is to elucidate the PK properties of enteral morphine in neonates using prior knowledge on pharmacology of morphine, concepts of pediatric physiological maturation as well as data collected from the large randomized controlled trial mentioned above. The current work will provide an opportunity to assess exposures at different doses and dosing regimens of enteral morphine in neonates with NAS.
Methods
Clinical Trial Design
The clinical trial was approved by the Johns Hopkins institutional review board (ClinicalTrials.gov: NCT00510016). Informed consent was obtained from the parents of each neonate. The objective of the clinical trial was to determine if oral clonidine as an adjunct therapy to DTO would reduce the duration of opioid detoxification in neonatal abstinence syndrome resulting from in utero methadone and/or heroine exposure. Modified Finnegan Scores1,10 (MFS, range from 0 to 40) were used as a symptom evaluation tool for the guidance of pharmacotherapy. After informed consent had been obtained, a total of 80 patients who required pharmacologic therapy as indicated by MFS threshold were randomized equally to either the DTO only or the DTO plus clonidine groups. Morphine PK samples were collected in the DTO arm only. The treatment regimen involves three phases. During the first phase, all neonates were started on 0.2 mL of DTO (0.08 mg morphine equivalent) orally every 4 hours. Then, DTO was incrementally escalated to 0.3, 0.4, and 0.5 mL (0.12, 0.16 and 0.2 mg morphine equivalent) every 4 hours, then to 0.5, 0.7, and 0.9 mL (0.2, 0.28 and 0.36 mg morphine equivalent) every 3 hours until withdrawal symptoms were controlled (defined as average MFS in 24 hours period <9). In the second phase, when symptoms were controlled, neonates were continued on the DTO dose that controlled symptoms for at least another 48 hours (stabilization). Finally in the third phase, the neonates entered the medication weaning phase. DTO was deescalated by increments of 0.05 mL per dose every 24 hours as long as MFS remained in the target range. Further details of the trial methods and the clinical results were published in 20093.
During the clinical trial, two to three plasma samples were collected per neonate based on clinical convenience. No nominal sampling time points were designed in the protocol. Morphine was isolated by solid phase extraction and plasma concentration was analyzed by LC/MS/MS method utilizing deuterated internal standard at the NMS Labs (Willow Grove, PA).
Population PK Model
Our strategy for building a PK model for neonates was to borrow strength from prior models. There are five prior IV models reported with potential difference. Owing to the sparse nature of data, the development of the PK model involved two major steps: 1) We evaluated the suitability of the prior models to extend to neonates; and 2) a population PK model after oral administration of DTO/morphine was built based on the best structural IV model in the previous step and plasma data collected from the current clinical trial.
Prior IV Model Evaluation
Extrapolation of Structural PK Model after Intravenous Administration into Pediatrics
Four of the five IV morphine PK models represented in Table 1 were built in pediatrics or pediatrics plus adults to predict PK profiles over the entire lifespan4,5,7,8. However, Lotsch's model12 was built only in healthy adults after IV administration with rich sampling as opposed to sparse sampling in the other four studies. Therefore, Lotsch's model was extrapolated to pediatrics using the allometric scaling approach in three steps before we evaluated the rest of the IV morphine models in adults and pediatrics.
Table 1. Summary of Previously Published Morphine IV Models.
| Publication | Demographics | PK Model | Parameterization | |||||
|---|---|---|---|---|---|---|---|---|
| Bouwmeester4 | Number of subjects: 184 Number of samples: 1856 Mean age: 195 (range: 0-1070) days Mean body weight: 5.9 (range: 1.9-16.8) kg |
1-Compartment Model |
|
|||||
| Holford5 | Number of subjects: 875 Number of samples: 1598 PNA: 0.27 (SD: 0.26, range: 0–2.84) weeks, PMA: 27.35 (SD: 2.31, range: 23–32) weeks Body weight: 1.04 (SD: 0.35, range: 0.42–2.44) kg with data from Bouwmeester4 |
2-Compartment Model |
|
|||||
| Knibbe7 | Number of subjects: 248 Number of samples: 792 Median body weight: 3.58kg (25–75 percentile: 2.2 - 7.0); Median PNA: 33 (25–75 percentile: 0.95 - 203) days Median PMA: 41.9 (25–75 percentile: 35.6 - 62.6) weeks |
2-Compartment Model |
tvCL = CLstd•(Wt)1.44 Liter/hour tvV1 = V1std•(Wt)Liter tvQ2 = Q2std Liter/hour tvV2 = V2std•(Wt)Liter |
|||||
| Wang8 | Number of subjects: 475 Number of samples: 9494 Body weight range: 0.56-85 kg Age range: 0.1 days-36 years |
2-Compartment Model |
|
|||||
| Lotsch | Number of subjects: 8 Number of samples: 152 Mean PNA: 26.4 years Mean body weight: 70.5 kg |
3-Compartment Model | (No body weight, PMA and PNA was used for parameterization) |
PMA: post menstrual age
PNA: post-natal age
First, we used the three compartment morphine PK model by Lotsch that is based on rich sampling after IV administration in healthy adults as the base model.12 Second, body weight based allometric scaling was added onto the volumes of distribution (V1, V2 and V3), the systematic clearance (CL), and the inter-compartment clearance (Q2 and Q3) with an exponent of 1, 0.75 and 0.75 respectively.13 Last, the age effect of maturation on relative change in clearance and central volume of distribution after adjustment for body weight were also modeled. The maturation of drug metabolizing enzymes starts prenatally – in the case of morphine, mainly UGT 2B714. Hence, we modeled the relative maturation of morphine clearance as a function of post-menstrual age (PMA) as in a previous publication 5:
| (1) |
HillCL is the Hill coefficient for clearance that defines the steepness of the maturation curve, and CLmat50 is the PMA at which clearance was 50% of the mature adult value. Morphine is mainly distributed in extracellular water, which is represented by the central volume of distribution in the three compartment model. The physiological maturation of extracellular water as a percentage of body weight was modeled from previous work15 and used to adjust the maturation of morphine central volume of distribution in neonates. Since the maturation of extracellular water is due to postnatal adjustment to environment and activities, the extracellular water maturation curve was described by an exponential model as a function of postnatal age (PNA) as shown in Figure 1. The exponential maturation function is given below:
Figure 1.
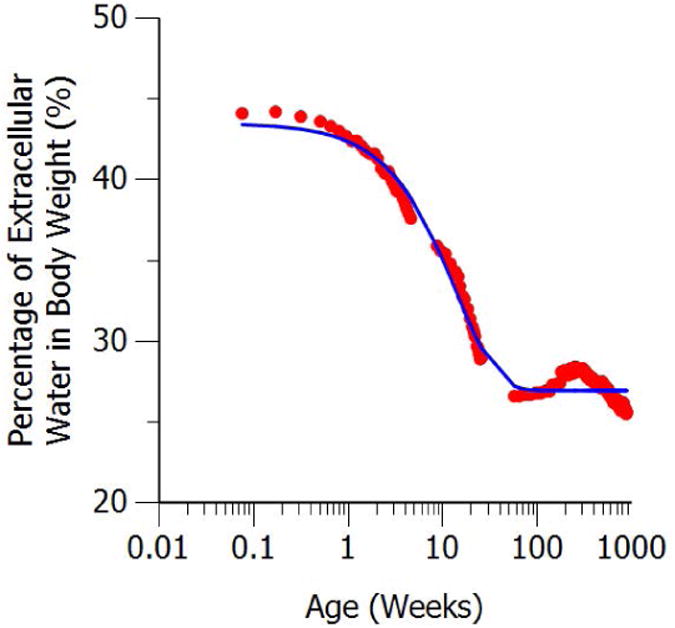
Maturation of extracellular body water as a percentage of body weight. The red solid dots represent digitized data from previous work. The solid blue line represents model fit
| (2) |
The final model with the appropriate covariates for typical value of clearance (tvCL), central compartment volume of distribution (tvV1), inter-compartment clearance (tvQ2, tvQ3) and peripheral compartment volume of distributions (tvV2, tvV3) are shown as follows:
| (3) |
| (4) |
| (5) |
| (6) |
| (7) |
| (8) |
tvCL and tvV were predicted from the equations above using the covariates PMA, PNA and Wt (body weight in kilograms). The rest of the parameters in the equation, described below, were fixed to the values obtained from the previous publication as seen in Table 2. CLstd and V1std are the clearance and the volume of distribution for the body weight of 70 kg respectively. Tvol is the maturation half-life of the PNA age-related changes of V1, and β vol is a parameter estimating the fractional difference from V1std at birth. Q2std, Q3std are the inter-compartment clearance for body weight of 70kg and V2std, V3std are the corresponding volume of distributions for the body weight of 70 kg. Since the relative change of other body composition such as intracellular water and body fat is negligible, it will not dramatically influence V2 and V3. Also, no maturation effect was considered for inter-compartment clearances Q2 and Q3. Thus, no maturation function was added onto V2, V3 and Q2, Q3.
Table 2. Population PK parameter estimates for the final model and corresponding bootstrap estimates.
| Parameter | Units | FOCE-I | Bootstrap (n=200) | ||
|---|---|---|---|---|---|
| Point Estimate | BSV | Median | BSV | ||
| 95% Confidence Interval | 95% Confidence Interval | 95% Percentile Interval | 95% Percentile Interval | ||
| Ka | 1/hour | 0.751 (0.196, 1.31) | 0.732 (0.562, 0.908) | ||
| F | % | 48.5 (38.9, 58.2) | 45.5 (37.9, 53.7) | ||
| Vstd* | Liter | 17.8 | 17.8 | ||
| CLstd* | Liter/hour | 75.3 | 58.3% (38.9%, 67.2%)# | 75.3 | 48.1% (33.1%, 66.0%) |
| V2std* | Liter | 87.3 | 87.3 | ||
| Q2std* | Liter/hour | 136 | 136 | ||
| V3std* | Liter | 199 | 199 | ||
| Q3std* | Liter/hour | 19.5 | 19.5 | ||
| CLmat50* | weeks | 58.3 | 58.3 | ||
| HillCL* | 3.6 | 3.6 | |||
| Tvol$ | weeks | 9.65 | 9.65 | ||
| βvol$ | 0.614 | 0.614 | |||
| Proportional Error | 44.9% (35.3%, 54.6%) | 47.9% (38.1%, 62.8%) | |||
Parameters were estimated from extracellular water maturation curve14 and fixed in population pharmacokinetics modeling procedure.
The confidence interval of BSV on CL was calculated based on the BSV on CL and the corresponding SE assuming t-distribution with 88 degrees of freedom.
External Evaluation of Morphine Pharmacokinetics Model after IV administration in Adults and Pediatrics
Five IV morphine PK models as listed in Table 1 were evaluated (including Bouwmeester 20044, Knibbe 20097, Holford 20125, Wang 20138 and the one we developed above based on Lotsch 200212) in adults and pediatric populations based on population predictions using digitized mean concentration time profiles from previously published morphine PK studies in healthy adults16,17, neonates, infants and children after surgery18–20 and leukemia patients in children21 (individual data). These concentration time profiles were digitized from the publications using GetData Graph Digitizer (version 2.24.0.25). Predictions of these concentration time profiles were based on the IV administration models mentioned above, as well as study design and demographics given in the publications, including administration route (bolus/infusion), dose, postnatal age, postmenstrual age and body weight. The comparison of those observed and predicted PK profiles after administration of IV morphine in pediatric patients were used as model external evaluation.
Oral PK Model in Neonates with Abstinence Syndrome
Based on the external evaluation of the IV morphine models in adults and pediatrics, the aforementioned structural model we developed based on Lotsch's adults IV morphine model best predicted the external source of data; therefore, it was employed as the starting point for estimating the oral PK parameters. A first-order absorption rate constant (Ka) and bioavailability (F) were added to model we developed to account for oral administration of morphine. The final three compartment PK model with first order oral administration of morphine is as follows:
| (9) |
| (10) |
| (11) |
| (12) |
where, Aa is the amount of morphine in the absorption compartment. A1 is the amount in the central compartment. A2 and A3 are the amount in the two corresponding peripheral compartments. Bioavailability (F) and absorption rate constant (Ka) were estimated by fixing all the parameters from the previously built IV morphine administration model.
Statistical Model
Between Subject Variability
Between Subject Variability (BSV) was modeled assuming a log-normal distribution:
| (13) |
where, Pi is the individual PK parameter for patient i, such as CLi, tvP is the typical value of that PK parameter such as tvCL, ηp,i is the corresponding between subject variability for patient i which is assumed to follow normal distribution with mean 0 and variance of ωp2. BSV was estimated from the data in this study.
Within Subject Variability
Within Subject Variability (WSV) was modeled using a proportional residual error model as follows:
| (14) |
Where Observed Concentrationi,j and Ci,j are the observed and individual predicted morphine concentration in the central compartment for patient i at time j, respectively, εi,j is corresponding proportional error term.
Internal Evaluation of PopPK Model in Neonates
Model evaluation was based on various goodness‐of‐fit indicators, including comparisons based on the minimum objective function value (OFV), visual inspection of diagnostic scatter plots, and evaluation of estimates of population fixed and random effect parameters.
Normalized Prediction Distribution Error22 (NPDE) analysis was performed in Phoenix and NPDE R package23 (version 2) in R 3.1.2. Two hundreds replications of simulation were generated for each observation in the original dataset using the final model in Phoenix. NPDE versus time after dose (TAD) were used to determine whether trends were present.
Nonparametric bootstrap method using Phoenix was used to evaluate the precision of parameter estimation in the final model24,11. 200 replications were generated by re-sampling from the observed morphine concentration dataset and PK parameters were estimated for each replicates separately. The median and corresponding 95% percentile interval (2.5th and 97.5th percentiles) obtained from the 200 sets of parameter estimations were compared to the estimation from FOCE-I.
All the modeling was performed using Phoenix NLME 1.4 (Certara, L.P., 210 North Tucker Boulevard Suite 350, St. Louis, MO 63101 USA). The first order conditional estimation method with interaction (FOCE-I) was used in the population modeling process. All the plots were generated using Phoenix or R 3.1.2 (R Foundation for Statistical Computing, Vienna, Austria).
Results
Eighty eight blood samples from 34 neonates were used to build the population PK model after oral administration of DTO. Six neonates (17.6%) were preterm (defined as gestational age less than 34 weeks) and the rest (82.4%) were full-term. Twenty one neonates (61.8%) were African-American and the rest (38.2%) were Caucasian. At the beginning of treatment, the average body weight was 2.9±0.4 kg (mean ± SD); post-menstrual age (PMA) was 39.1±2.1 weeks and post-natal age (PNA) was 2.0±0.9 days.
Population PK Model
Prior IV Model Evaluation
A three compartment structural model with allometric scaling approach and physiologic considerations successfully extrapolated the IV morphine PK profile from adults to pediatrics. PK parameters from a healthy adult IV model, including CLstd, Q2std, Q3std, Vstd, V2std and V3std, are provided in Table 2. The maturation effect on clearance and volume were modeled as a function of PMA and PNA respectively. As previously published5, the time to reach 50% maturation of clearance relative to adults was 58.3 weeks. Similarly, the time to reach 50% maturation of volume relative to adults was 9.65 weeks and the relative difference at birth compared to the adult value was 0.614.
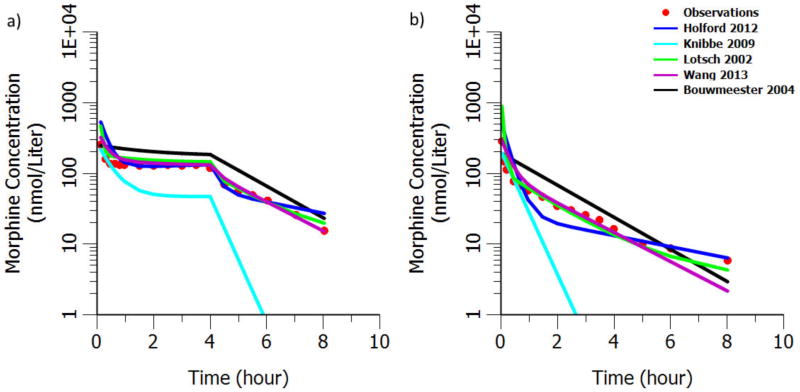
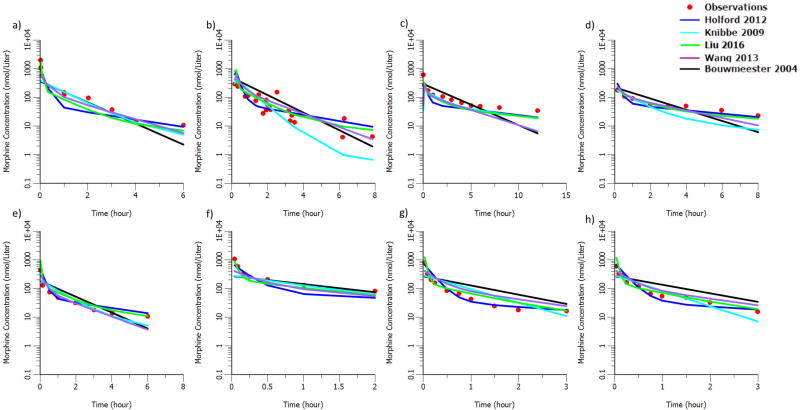
The comparison of the observed and predicted PK profiles after IV morphine administration in healthy adult and pediatric patients is shown in Figure 2 and 3 separately. There is a high consistency between our model (indicated as Lotsch 2002 in Figure 2 and Liu 2016 in Figure 3) predictions and the observations in both adult and pediatric populations. Though most of the previously published morphine models can predict the observed concentrations on similar level as shown in Figure 2 and 3, comparisons with them have shown that our model and Wang's model predict not only the levels but the shape of the concentration time profile as well.
Figure 2.
External evaluation of morphine structural models a) after IV bolus administration of morphine 0.14 mg/kg plus infusion of 0.05mg/kg/hour for 4hours in 20 healthy adults with mean age 24.6 years and mean body weight 74.2kg17. b) after IV bolus administration 10mg/70kg in 6 healthy volunteers with mean body weight 71.4kg and mean age 25.8 years16.
Figure 3.
External evaluation of morphine structural model after intravenous bolus administration a) in infants undergoing elective surgery (mean age 21 months)19. b) in children with leukemia undergoing therapeutic lumbar puncture (median age 5.5 years and median weight 20.0 kg)21 c) in neonates (N=10, mean age 1.1 days and mean weight 3.5kg)18 d) in neonates (N=10, mean age 29 days and mean weight 3.9kg)18 e) in infants (N=7, mean age 112 days and 6.2kg)18 f) in infants (N=5, mean age 0.3 years and mean weight 5.3kg)20 g) in children (N=5, mean age 3.7 years and mean weight 16.3kg)20 h) in children (N=4, mean age 6.4 years and mean weight 22.3kg)20
Oral PK Model in Neonates with Abstinence Syndrome
The structural PK parameters of the IV model being fixed, the first order absorption rate constant was estimated to be 0.751 hour-1 and the bioavailability was 48.5% in neonates with abstinence syndrome. Between subject variability (BSV) could only be estimated on clearance. The estimated proportional residual error was 44.9%. The model parameter estimates are shown in Table 2.
Internal Evaluation of PopPK Model in Neonates
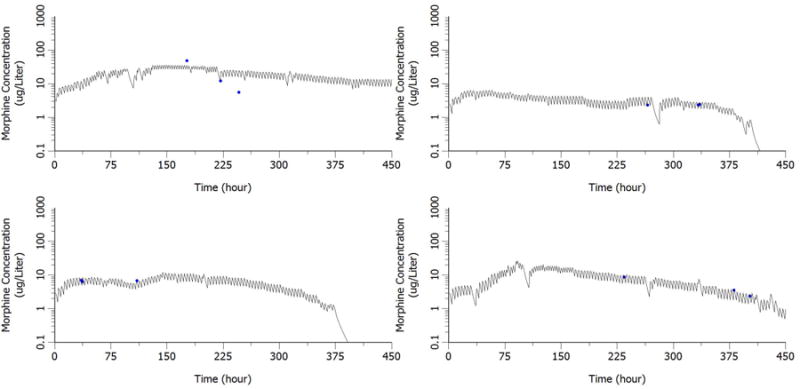
Goodness-of-fit plots including population prediction of concentration (PRED) versus observation and individual prediction of concentration (IPRED) versus observation are shown in Figure 4. No obvious model misspecification and bias were found from these two diagnostic plots. Bayesian individual concentration time profiles during the entire study were simulated based on post hoc PK parameter estimates in four representative subjects. The comparison between the simulated PK profiles and the observed concentrations in representative neonates are given in Figure 5.
Figure 4.
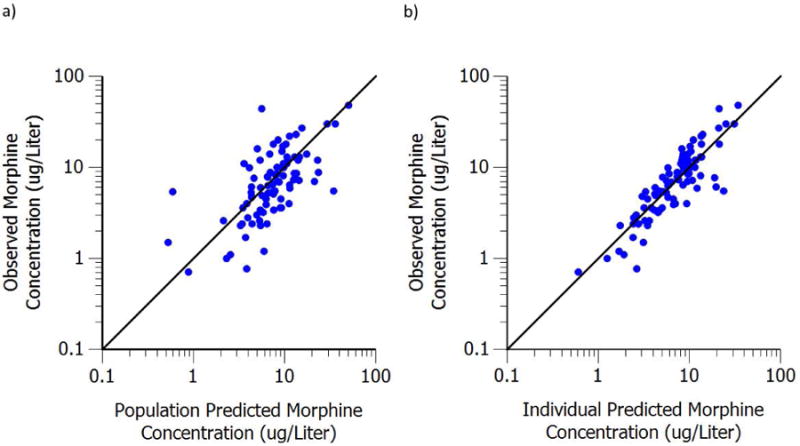
a) Population predicted plasma concentration versus observed plasma concentration. b) Individual predicted plasma concentration versus observed plasma concentration
Figure 5. Comparison of post hoc PK profiles with observed concentration in representative neonate.
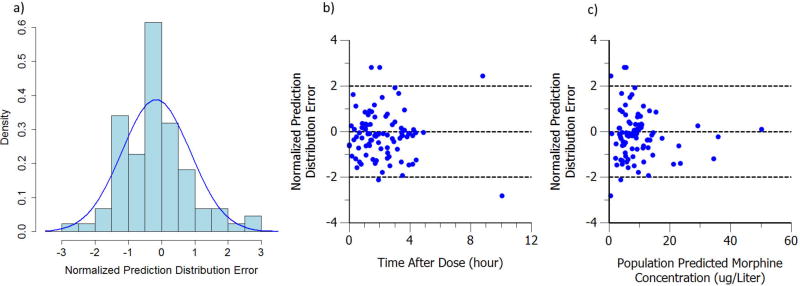
The histogram plot of NPDE along with corresponding normal distribution curve is shown in Figure 6a. No trends were visible in the NPDE versus Time after Dose (TAD) and Population Predicted Morphine Concentration (PRED) plot as shown in Figure 6b and 6c. Evaluation of the NPDE distribution shows that the model adequately describes the observed data.
Figure 6.
a) Histogram of normalized prediction distribution error. The blue curve is the normal distribution with corresponding mean (-0.169) and standard deviation (1.03). b) Normalized prediction distribution error versus time after dose. c) Normalized prediction distribution error versus population prediction. The three dash lines represent NPDE (CWRES) = -2, 0 and 2 separately
Bootstrapping was performed as described in the methods. From the original dataset of 34 patients, 200 replicates were generated. Based on the re-estimation of the PK parameters in the 200 replications, the bootstrap median and 95% percentile interval are shown in Table 1. All the point estimates from FOCE-I are comparable to the bootstrap median and fall within the 95% bootstrap percentile interval. The comparison between FOCE-I estimation and bootstrap estimation shows that the model is stable and can precisely describe the observed data.
Discussion
Neonates are one of the most challenging populations for researchers to conduct clinical trials with, and thus they remain therapeutic orphans in that the PK and PD of many drugs are understudied. Due to lack of robust PK understanding, the dosing and clinical therapeutic effect are not optimized. The situation is even more dire for clinical indications not included in FDA approved drug labels, such as treatment of NAS. The current clinical trial provides a unique opportunity to characterize the PK knowledge of orally dosed morphine in patients with NAS. Prior PK knowledge of morphine, physiologic knowledge and sparse data from the current trial were successfully integrated to describe the PK of enteral morphine in neonates with NAS.
Rich sampling in vulnerable neonate population is very challenging, especially for observational studies. There are both logistic and resource limitations such as obtaining consent from parents and availability of clinical staff for collecting rich invasive data that are not part of standard treatment. However, it is these observational studies which render us with valuable information to improve therapeutics in the future. The well-known pioneering work of population pharmacokinetics of phenobarbital in neonates25 is a good example of deriving meaningful PK information using observational sparse sampling data. A reasonable estimate of bioavailability and other PK parameters is extremely useful for optimizing therapy. If we don't possess rich prior knowledge, analyzing such observational data is impossible. In the case of morphine, we have excellent prior knowledge regarding its PK. Further, not analyzing and reporting such data especially from vulnerable patients poses ethical issues. We elected to perform exhaustive research to make the best of the available data to steer future research in this area.
Due to the sparse sampling feature in previously published IV morphine PK models, it is very challenging to capture the shape of the profile. Moreover, all the observed PK profiles in rich sampling pediatric studies have shown a multi-phase disposition. Therefore, it is expected that Bouwmeester's one compartment PK model cannot describe the shape of the curve well as seen by the black line in Figure 2 and 3. It is to be noted that we ignored a bilirubin effect originally present in Bouwmeester's model, as the data that we were predicting into did not provide any information on bilirubin. The inclusion of this bilirubin effect, that decreased the prediction of morphine clearance, would have increased the magnitude of over prediction of morphine concentration that was already present.
Meanwhile, Knibbe's model which was developed based on data from pediatrics younger than 3 years, cannot provide good prediction in adult population as it has a 1.44 exponent on body weight. The exponent is mostly expected to be around 0.75 in children, adolescents and adults13. Though Wang's model predict well in both pediatric and adult population, it lacks physiological and pharmacological interpretation on its parameters due to forcing the exponent on body weight as a function of body weight itself. Our model on the other hand inherits the highly informed structural PK model derived from rich sampling after morphine IV administration in adults as compared to the previously published morphine PK models in pediatrics. The use of allometric scaling approach with age maturation models facilitated a better extrapolation from adult to pediatrics. In external evaluation of the structural IV model, the predictions are in good agreement with the observed PK profile in both adults and pediatrics (Figure 2 and 3). The external evaluation results strongly suggest the high reliability of the structural IV model and provided the confidence to employ this IV model as the starting point for estimating the oral PK parameters in neonates. The adult PK model, knowledge in pharmacology and physiology attribute to our understanding of oral morphine PK in neonates, even with our sparse sampling design.
The previously published population PK model of morphine from which we borrowed the maturation curve of clearance5 as prior in this study found that clearance is different between preterm and full term neonates. They interpreted this difference as the result of mechanical ventilation, and not an inherent physiologic difference between preterm and full term neonates or maturation in PMA. Although 6 of 34 neonates were preterm in our study, they were not adjusted by the ventilation scaling factor used in the Holford publication for two main reasons. First, the preterm neonates in our clinical trial were very close in age to full term neonates given the average PMA was 34.5 weeks (compared to 27.35 weeks in their publication). Second, preterm neonates in our study did not receive mechanical ventilation after delivery.
The estimated oral bioavailability of 46.3% in neonates is higher than the observed rectal bioavailability of 35% after hydrogel administration (4 to 43 months) and the observed rectal bioavailability after the administration of morphine solution (5 to 31 months) of 27% in infants and children19. Also, the estimated oral bioavailability in neonates is higher than the oral bioavailability of 23.9% in healthy adults26. The higher bioavailability in neonates and the decreasing trend in bioavailability from neonates to adults fits well with our understanding of the physiology which dictates morphine disposition. There is lower expression of UGT2B7 per unit of hepatocyte in neonates; this is the major enzyme that is responsible for the metabolism of morphine and it is accounted for by the age effect in the clearance model. Additionally, the smaller liver size is accounted for by body weight in the clearance model, and both of these physiologic differences result in lower metabolic function and morphine clearance. This lower systemic metabolic function leads to lower systemic clearance and first-pass effect after oral administration resulting in higher bioavailability.
Recently, allelic variability in OCT1 was proven partly responsible for the racial difference observed in morphine clearance between Caucasians and African-Americans. This study used a population approach to estimate pharmacologic parameters after the administration of IV morphine in children27,28. However, in our study, genotype of OCT1 was not collected and the race covariate did not influence the clearance based on the visual inspection of post hoc PK parameter estimates.
Conclusion
Overall, the population PK model of morphine after oral administration of DTO is reasonable and acceptable, and can be used to guide future studies by simulating exposure under different dosing regimens among various neonates with NAS. The integration of the previous population PK knowledge as prior information served to confirm the previous model and reaffirm the physiologic basis of extrapolation to neonates. Furthermore, this approach is an efficient way to combine multiple prior studies with sparse neonatal data in order to make big decisions with little data. We feel that this approach is especially valuable in this vulnerable population.
Acknowledgments
This study was funded by a Thomas Wilson grant, an institutional research grant from Johns Hopkins Hospital, General Clinical Research Center, and was supported by National Institute on Drug Abuse grant IR21DAO16288. In addition, the Clinical Pharmacology NIH training grant 5T32GM066691 supported the second author during this work.
The authors would like to thank all the patients, nurses and physicians who were part of the parent clinical trial. Thank you to Tarrah Ezell for her patience in data collection and confirmation.
Footnotes
Author Contribution: Tamorah Lewis and Estelle Gauda designed and conducted the clinical trial, Tao Liu, Tamorah Lewis, Jogarao Gobburu and Vijay Ivaturi analyzed data, Tao Liu, Tamorah Lewis, Jogarao Gobburu and Vijay Ivaturi wrote the manuscript.
Conflict of Interest: The authors declare no conflict of interest.
References
- 1.Finnegan LP, Connaughton JF, Kron RE, Emich JP. Neonatal abstinence syndrome: assessment and management. Addict Dis. 1975;2(1-2):141–58. [PubMed] [Google Scholar]
- 2.Kocherlakota P. Neonatal Abstinence Syndrome. Pediatrics. 2014;134(2):e547–e561. doi: 10.1542/peds.2013-3524. [DOI] [PubMed] [Google Scholar]
- 3.Agthe aG, Kim GR, Mathias KB, et al. Clonidine as an Adjunct Therapy to Opioids for Neonatal Abstinence Syndrome: A Randomized, Controlled Trial. Pediatrics. 2009;123(5):e849–e856. doi: 10.1542/peds.2008-0978. [DOI] [PMC free article] [PubMed] [Google Scholar]
- 4.Bouwmeester NJ. Developmental pharmacokinetics of morphine and its metabolites in neonates, infants and young children. Br J Anaesth. 2004;92(2):208–217. doi: 10.1093/bja/aeh042. [DOI] [PubMed] [Google Scholar]
- 5.Holford NHG, Ma SC, Anderson BJ. Prediction of morphine dose in humans. Paediatr Anaesth. 2012;22(3):209–22. doi: 10.1111/j.1460-9592.2011.03782.x. [DOI] [PubMed] [Google Scholar]
- 6.Anand KJS, Anderson BJ, Holford NHG, et al. Morphine pharmacokinetics and pharmacodynamics in preterm and term neonates: secondary results from the NEOPAIN trial. Br J Anaesth. 2008;101(5):680–689. doi: 10.1093/bja/aen248. [DOI] [PMC free article] [PubMed] [Google Scholar]
- 7.Knibbe CaJ, Krekels EHJ, van den Anker JN, et al. Morphine glucuronidation in preterm neonates, infants and children younger than 3 years. Clin Pharmacokinet. 2009;48(6):371–85. doi: 10.2165/00003088-200948060-00003. [DOI] [PubMed] [Google Scholar]
- 8.Wang C, Sadhavisvam S, Krekels EHJ, et al. Developmental changes in morphine clearance across the entire paediatric age range are best described by a bodyweight-dependent exponent model. Clin Drug Investig. 2013;33(7):523–534. doi: 10.1007/s40261-013-0097-6. [DOI] [PubMed] [Google Scholar]
- 9.Krekels EHJ, Tibboel D, Danhof M, Knibbe CaJ. Prediction of morphine clearance in the paediatric population : how accurate are the available pharmacokinetic models? Clin Pharmacokinet. 2012;51(11):695–709. doi: 10.1007/s40262-012-0006-9. [DOI] [PubMed] [Google Scholar]
- 10.Finnegan L, Connaughton JJ, K R. Basic and Therapeutic Aspects of Perinatal Pharmacology. New York, NY: Raven; 1995. A scoring system for evaluation and treatment of the neonatal abstinence syndrome: a new clinical and research tool; pp. 139–152. [Google Scholar]
- 11.Parke J, Holford NH, Charles BG. A procedure for generating bootstrap samples for the validation of nonlinear mixed-effects population models. Comput Methods Programs Biomed. 1999;59(1):19–29. doi: 10.1016/s0169-2607(98)00098-4. [DOI] [PubMed] [Google Scholar]
- 12.Lötsch J, Skarke C, Schmidt H, Liefhold J, Geisslinger G. Pharmacokinetic modeling to predict morphine and morphine-6-glucuronide plasma concentrations in healthy young volunteers*. Clin Pharmacol Ther. 2002;72(2):151–162. doi: 10.1067/mcp.2002.126172. [DOI] [PubMed] [Google Scholar]
- 13.West GB, Brown JH, Enquist BJ. A general model for the origin of allometric scaling laws in biology. Science. 1997;276(5309):122–126. doi: 10.1126/science.276.5309.122. [DOI] [PubMed] [Google Scholar]
- 14.Coffman BL, Rios GR, King CD, Tephly TR. Human UGT2B7 catalyzes morphine glucuronidation. Drug Metab Dispos. 1997;25(1):1–4. [PubMed] [Google Scholar]
- 15.Evans William E, Schentag JS, William JJ. Applied pharmacokinetics:Principles of Therapeutic Drug Monitoring. Lippincott Williams & Wilkins; Vancouver, WA: 1992. [Google Scholar]
- 16.Stuart-Harris R, Joel SP, McDonald P, Currow D, Slevin ML. The pharmacokinetics of morphine and morphine glucuronide metabolites after subcutaneous bolus injection and subcutaneous infusion of morphine. Br J Clin Pharmacol. 2000;49(3):207–214. doi: 10.1046/j.1365-2125.2000.00141.x. [DOI] [PMC free article] [PubMed] [Google Scholar]
- 17.Lötsch J, Weiss M, Kobal G, Geisslinger G. Pharmacokinetics of morphine-6-glucuronide and its formation from morphine after intravenous administration. Clin Pharmacol Ther. 1998;63:629–639. doi: 10.1016/S0009-9236(98)90086-8. [DOI] [PubMed] [Google Scholar]
- 18.Pokela ML, Olkkola KT, Seppälä T, Koivisto M. Age-related morphine kinetics in infants. Dev Pharmacol Ther. 1993;20(1-2):26–34. doi: 10.1159/000457538. [DOI] [PubMed] [Google Scholar]
- 19.Lundeberg S, Beck O, Olsson GL, Boreus LO. Rectal administration of morphine in children. Pharmacokinetic evaluation after a single-dose. Acta Anaesthesiol Scand. 1996;40(4):445–51. doi: 10.1111/j.1399-6576.1996.tb04467.x. [DOI] [PubMed] [Google Scholar]
- 20.Olkkola KT, Maunuksela EL, Korpela R, Rosenberg PH. Kinetics and dynamics of postoperative intravenous morphine in children. Clin Pharmacol Ther. 1988;44(2):128–136. doi: 10.1038/clpt.1988.127. [DOI] [PubMed] [Google Scholar]
- 21.Hain RD, Hardcastle A, Pinkerton CR, Aherne GW. Morphine and morphine-6-glucuronide in the plasma and cerebrospinal fluid of children. Br J Clin Pharmacol. 1999;48(1):37–42. doi: 10.1046/j.1365-2125.1999.00948.x. [DOI] [PMC free article] [PubMed] [Google Scholar]
- 22.Brendel K, Comets E, Laffont C, Mentré F. Evaluation of different tests based on observations for external model evaluation of population analyses. J Pharmacokinet Pharmacodyn. 2010;37(1):49–65. doi: 10.1007/s10928-009-9143-7. [DOI] [PMC free article] [PubMed] [Google Scholar]
- 23.Comets E, Brendel K, Mentré F. Computing normalised prediction distribution errors to evaluate nonlinear mixed-effect models: the npde add-on package for R. Comput Methods Programs Biomed. 2008;90(2):154–66. doi: 10.1016/j.cmpb.2007.12.002. [DOI] [PubMed] [Google Scholar]
- 24.Yafune A, Ishiguro M. Bootstrap approach for constructing confidence intervals for population pharmacokinetic parameters. I: A use of bootstrap standard error. Stat Med. 1999;18:581–599. doi: 10.1002/(sici)1097-0258(19990315)18:5<581::aid-sim47>3.0.co;2-1. [DOI] [PubMed] [Google Scholar]
- 25.Grasela TH, Donn SM. Neonatal population pharmacokinetics of phenobarbital derived from routine clinical data. Dev Pharmacol Ther. 1985;8(6):374–383. doi: 10.1159/000457062. [DOI] [PubMed] [Google Scholar]
- 26.Hoskin PJ, Hanks GW, Aherne GW, Chapman D, Littleton P, Filshie J. The bioavailability and pharmacokinetics of morphine after intravenous, oral and buccal administration in healthy volunteers. Br J Clin Pharmacol. 1989;27(4):499–505. doi: 10.1111/j.1365-2125.1989.tb05399.x. [DOI] [PMC free article] [PubMed] [Google Scholar]
- 27.Sadhasivam S, Krekels EHJ, Chidambaran V, et al. Morphine clearance in children: does race or genetics matter? J Opioid Manag. 2012;8(4):217–26. doi: 10.5055/jom.2012.0119. [DOI] [PubMed] [Google Scholar]
- 28.Fukuda T, Chidambaran V, Mizuno T, et al. OCT1 genetic variants influence the pharmacokinetics of morphine in children. Pharmacogenomics. 2013;14(10):1141–51. doi: 10.2217/pgs.13.94. [DOI] [PMC free article] [PubMed] [Google Scholar]


