Abstract
Background
The objective of this study was to measure myocardial blood flow (MBF) in humans using 99mTc-tetrofosmin and dynamic single photon emission computed tomography (SPECT).
Methods
Dynamic SPECT using 99mTc-tetrofosmin and dynamic positron emission tomography (PET) was performed on a group of 16 patients. The SPECT data were reconstructed using a 4D-spatiotemporal iterative reconstruction method. The data corresponding to 9 patients were used to determine the flow-extraction curve for 99mTc-tefrofosmin while data from the remaining 7 patients were used for method validation. The nonlinear tracer correction parameters A and B for 99mTc-tefrofosmin were estimated for the 9 patients by fitting the flow-extraction curve for K1 values estimated with 99mTc-tefrofosmin using SPECT and MBF values estimated with 13N-NH3 using PET. These parameters were then used to calculate MBF and coronary flow reserve (CFR) in three coronary territories (LAD, RCA, and LCX) using SPECT for an independent cohort of 7 patients. The results were then compared with that estimated with 13N-NH3 PET. The flow dependent permeability surface-area product (PS) for 99mTc-tefrofosmin was also estimated.
Results
The estimated flow extraction parameters for 99mTc-tefrofosmin was found to be A=0.91±0.11, B=0.34±0.20 (R2 = 0.49). The range of MBF in LAD, RCA, and LCX was 0.44 ml/min/g to 3.81 ml/min/g. The MBF between PET and SPECT in the group of independent cohort of 7 patients showed statistically significant correlation, r = 0.71 (p < 0.001). However, the corresponding CFR correlation was moderate r = 0.39 yet statistically significant (p = 0.037). The PS for 99mTc-tefrofosmin was (0.091 ± 0.10) * MBF = (0.32 ± 0.16).
Conclusions
Dynamic cardiac SPECT using 99mTc-tetrofosmin and a clinical two-headed SPECT/CT scanner can be a useful tool for estimation of MBF.
Keywords: dynamic SPECT, myocardial blood flow quantification, tracer kinetics, ammonia PET
INTRODUCTION
Myocardial perfusion imaging (MPI) using single photon emission computed tomography (SPECT) remains an important tool in the diagnosis and risk stratification of patients with coronary artery disease (CAD).1 Although the conventional approach of visual assessment can be a direct and persuasive practice for diagnosing ischemia, it often fails to predict existence of homogeneous global reduction of myocardial perfusion due to flow limiting multi-vessel disease.2-5 A credible approach to overcome this limitation is to quantify regional myocardial blood flow (MBF) and coronary flow reserve (CFR) during exercise.4,5
Absolute quantification of regional MBF is a more sensitive approach for detecting CAD and flow related abnormalities, and will become a critical component of cost-saving initiative for screening CAD patients for medical intervention and/or referral to cardiac catheterization.6 Significant technical developments in recent years have increased the awareness of the clinical value of MBF quantification in humans.6, 7 Recently, a number of studies using a dedicated cardiac SPECT camera were performed to calculate myocardial perfusion index (MPI) and CFR using commonly available SPECT radiotracers.8-10
In this paper, we present the utility of dynamic cardiac SPECT to estimate the MBF and CFR in a rest/stress protocol using 99mTc-tetrofosmin with a conventional two-headed SPECT/CT camera (Infinia Hawkeye 4, GE Healthcare) and validate the method with 13N-NH3 PET in a population of 16 patients. Our method is unique in that we have employed the B-spline based spatiotemporal reconstruction11 of the dynamic data acquired in humans as the camera rotates continuously to capture the dynamics of the tracer activity in the myocardium and blood pool. To our knowledge, this is the first such study to quantify MBF in patients using a clinical two-headed SPECT/CT system and 99mTc-tetrofosmin and to correlate it with MBF measured using 13N-NH3 PET.
METHODS
Sixteen patients (12 males, 4 females, mean age 73) with known or suspected CAD referred by cardiologists (EHB, YY, or AB) were recruited at the University of California San Francisco (UCSF) Imaging Center to study the clinical feasibility of the new rest/pharmacologically-induced stress dynamic SPECT MPI continuous-acquisition protocol. Patient demographics and medical histories related to coronary risk factors were also assessed. All patients also underwent a dynamic 13N-NH3 PET study within 12 months (median = 1 month and mean = 3.3 months) of the dynamic SPECT study. Multiple modalities relevant to assessment of patients’ normal/abnormal condition are shown in Table 1. Note that the same patient underwent two or more studies.
Table 1.
Studies performed.
| Modalities | Normal | Abnormal | Total |
|---|---|---|---|
| Dynamic SPECT ¶ | 7 | 9 | 16 |
| PET/SPECT MPI | 2 | 5 | 7 |
| Dynamic PET | 8 | 8 | 16 |
|
Coronary
Angiography |
1 | 1 | 2 |
Normal or abnormal for the dynamic SPECT studies was determined by the results of conventional pharmacological stress MPI, dynamic PET MPI and/or coronary angiogram.
There were no revascularization procedures, percutaneous coronary intervention (PCI), balloon angioplasty or stent, or coronary bypass graft surgery (CABG) between the dynamic SPECT study and dynamic PET and/or diagnostic coronary angiography. Patients who had previous history of PCI and CABG were included in the study.
Informed verbal consents were obtained during the initial contact, and written consents were obtained prior to the scan. Patients received full information about the potential risk and benefit of their participation before signing the written consent. The study was approved by the Committee on Human Research (CHR), the Institutional Review Board (IRB) at UCSF, and the Human and Animal Research Committee (HARC) at Lawrence Berkeley National Laboratory (LBNL).
Imaging Protocols
Dynamic cardiac SPECT MPI
Single day low/high-dose rest/pharmacologic stress (20 min/20 min) protocol was performed using a dual head SPECT/CT system (Infinia Hawkeye 4, GE Healthcare). Each patient was instructed to fast at least 4 hours and not to smoke or consume anything containing caffeine or xanthine 24 hours prior to the test. All imaging protocols began with a dynamic rest followed by dynamic pharmacologic stress acquisition. Transmission CT images (helical acquisition, 5 mm slice thickness, 80 slices) were acquired immediately after the SPECT acquisitions for image registration and attenuation correction. In addition, approximately a 30-minute interval was adhered to between the rest and stress studies.
The scanner detector heads equipped with low-energy high-resolution (LEHR) collimators were configured in the H-mode (i.e., oriented 180° to each other) for the dynamic acquisition. Two views with a 3° increment every second and a total of 120 projection images (60 views from each camera head) per minute were acquired. The rotation speed of each camera head was 2 minute per rotation. Projection data were binned into 128×128 detector pixels having a pixel size of 4.4×4.4 mm2.
The rest dynamic SPECT acquisition began immediately prior to the radiotracer IV injection with patients lying in the supine position. Once the scanner heads (configured in H-mode) began rotating, each patient manually received an IV bolus injection (10-20 second duration) of approximately 370 MBq (10 mCi) of 99mTc-tetrofosmin (Myoview; GE Healthcare). For the stress study, each patient was given a 0.4 mg IV injection of the stress agent regadenoson (Lexiscan; Astellas Pharma, Inc.) followed by a dose of 925 MBq (25 mCi) of 99mTc-tetrofosmin approximately 30 to 60 sec later. Heart rate, blood pressure, and oxygen saturation were monitored, and 12-lead electrocardiograms (ECG) were recorded every minute after the regadenoson injection.
PET perfusion imaging
All 16 patients also underwent dynamic 13N-NH3 PET rest/stress MPI scans (15 min/15 min) using a PET/CT scanner (Discovery VCT, GE Healthcare) using an established protocol for clinical cardiac PET-MPI studies at our institution. This protocol includes a rest scan with 740 MBq (20 mCi) of 13N-NH3, and then pharmacologic stress with 740 MBq (20 mCi) of 13N-NH3 using regadenoson as used in the dynamic SPECT studies. Like with the SPECT studies, transmission CT was acquired for each patient for image registration and attenuation correction.
Image Reconstruction
The dynamic SPECT data for each patient were reconstructed using the 4-dimensional maximum likelihood expectation maximization (ML-EM) algorithm applicable to spatiotemporal image reconstruction in emission tomography, a software package developed by LBNL/UCSF12 for the continuous rotation two-headed detector system.13 Since the data were distributed over a single energy window with a photo peak at 140 keV, scattering correction was not applied. However, collimator response and partial volume correction were modeled explicitly during iterative reconstruction by incorporating the point-spread-function (PSF) in the system matrix. Blurring due to cardiac, respiratory or patient motion were neglected. But cross-contamination due to spillover between myocardium and left and right ventricles was corrected during fitting of the time activity curves (TACs) to compartment models (see below).
All SPECT attenuation-corrected reconstructed dynamic data were sampled uniformly at 5 sec intervals. A Gaussian filter (with kernel size=9 and standard deviation=1.7 mm corresponding to 4.0 mm full-width half-maximum (FWHM)) was applied to each of the reconstructed frames of the 3D SPECT data.
Similarly, PET data were reconstructed and post-processed using vendor-provided 2D filtered back projection software tool. The processed PET images were sampled with 5 sec duration for the first 3 minutes, 60 sec for the next two minutes, and 5 min thereafter with a total of 40 dynamic frames for kinetic analysis.
Estimation of Perfusion and Myocardial Blood Flow
The myocardium was oriented along the long-axis/short-axis view and subdivided into 17 segments from basal through mid-cavity to apical regions using the PMOD Cardiac PET Modeling Tool (PCARDP) (PMOD Technologies, Zurich, Switzerland). The time activity curves (TACs) for all segments as well as activity concentrations of left and right ventricular blood pools for each rest-stress pair were extracted. The leftover background activity in the stress data from the rest study was subtracted. The corresponding uptake and washout rates were estimated using a one-tissue compartment model for 99mTc-tetrofosmin, which has been shown to be sufficient for 99mTc-sestamibi14
| (1) |
where Cm(t) and Clv are the activities of the myocardium and left ventricular cavity, while K1 and K2 are the tracer uptake and wash-out rates, respectively. The double spillover correction15 in the myocardium from the left and right ventricle was also implemented.
For 13N-NH3, an irreversible two-tissue compartment model was implemented based on the work of Hutchins et al.16 To allow the fitting of the data over an extended period, an exponential metabolite correction was included as described by van den Hoff et al.,17 with a delay time t0=0.48 min and half-life T1/2=6.69 min. The extraction-corrected MBF were then calculated by using the estimated K1 values from 13N-NH3.18
For the quantification of regional MBF (F) with dynamic SPECT, the measured K1 values for 99mTc-tetrofosmin were incorporated into the Renkin-Crone (RC) model of the Krogh cylinder.19-21 The relationship between K1 of 99mTc-tetrofosmin and estimated MBF (F) was assumed to follow a generalized RC model,
| (2) |
where A and B are free parameters that were estimated by fitting the flow values estimated from dynamic 13N-NH3 PET. This model (Equation 2) was compared with the equivalent model assuming that the permeability surface-area product (PS) (ml/min/g) of the blood capillaries depends on the flow,20
| (3) |
Here PS = α * F + β with α and β to be determined by fitting the experimental K1 data with the flow measured with 13N-NH3 PET.
Nine out of sixteen patients were used for the estimation of the parameters A and B, or α and β. The K1 values in three vascular territories (LAD, RCA and LCX) for 99mTc-testrofosmin using dynamic SPECT were plotted against the corresponding extraction corrected flow values by using the relation originally obtained by Schelbert et. al.18 for 13N-NH3. A best fit was obtained with a weighted least-squares algorithm. After estimating the extraction parameters A and B for 99mTc-tetrofosmin, the territorial MBFs were calculated in Equation 2 using a nonlinear fixed-point iteration method. A similar fitting method was employed for the estimation of α and β in Equation 3.
Method Validation
Our method of validation was similar to the one originally applied for the validation of 13N-NH3 PET.18 Our working hypothesis throughout this study was that the MBF estimated with SPECT quantitatively agrees with that of PET irrespective of patient’s pathophysiological condition. An independent cohort of seven patients was used to correlate the MBF using 99mTc-tetrofosmin SPECT to MBF using 13N-NH3 PET for both rest and stress data. The estimated MBF using 99mTc-tetrofosmin SPECT was plotted against the MBF using 13N-NH3 PET. Bland–Altman plots were evaluated to determine the limits of agreement. To assess the clinical significance of the data the coronary flow reserve (CFR), defined as the ratio of absolute blood flow during stress to that at rest, were calculated and correlated.
Based on the clinical findings (Table 1) all 16 patients were evaluated by one of us (EHB) and classified them into normal and abnormal subgroups. The corresponding CFR values estimated with PET and SPECT were compared.
Statistical Analysis
All estimated values are expressed as mean ± SD. All MBF values are expressed in ml/min/g. Fits were assessed by calculating the R2-value to test the goodness of fit. Pearson correlation coefficients for the MBF and CFR values estimated with dynamic SPECT and dynamic PET were computed to assess the linear regression relationships. Whenever necessary, p-values were calculated using two-tailed t-test to measure the statistical significance. Unless explicitly stated otherwise, any difference was considered statistically significant if the p-value is greater than 0.05. Any p-value less than 0.001 is reported as p<0.001. The agreement between the PET and SPECT methods were also analyzed using a Bland-Altman plot. Welch’s two-sample t-test was performed to recognize the deviation of the estimated mean values between PET and SPECT. Analysis of variance (ANOVA) was performed to compare the statistical equivalency of the two fitting models (Equation 2 and Equation 3). All statistical calculations were performed using the open-source statistical package R (http://www.R-project.org/).
RESULTS
Patients’ characteristics (demographics and medical history) are listed in Table 2. Among the 16 patients studied with dynamic SPECT, 9 had evidence of CAD or myocardial ischemia either on coronary angiography or conventional SPECT MPI and/or dynamic PET MPI. Dynamic 13N-NH3 PET revealed that eight patients had flow abnormalities.
Table 2.
Patient characteristics.
| Characteristics | Data |
|---|---|
| Demographics | |
| Age (y) | 73 (56-81) |
| Female | 4 (25%) |
| Male | 12 (75%) |
| Medical History | |
| Ischemia/Defect | 8 (50%) |
| Cardiomyopathy | 5 (31%) |
| Prior CABG/PCI | 5 (31%) |
Estimation of MBF using dynamic SPECT with 99mTc-tetrofosmin
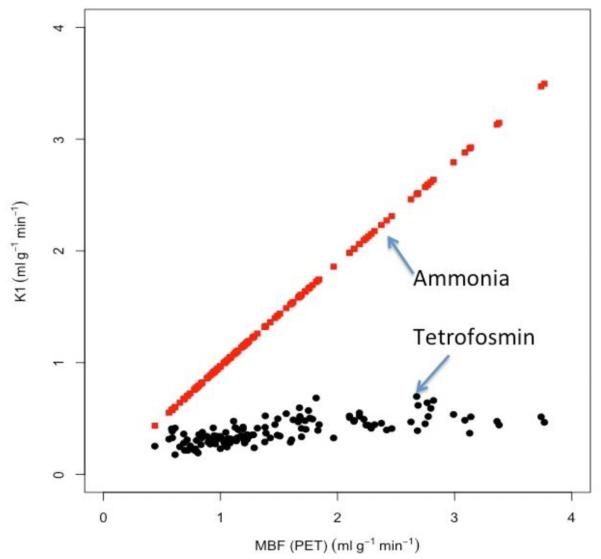
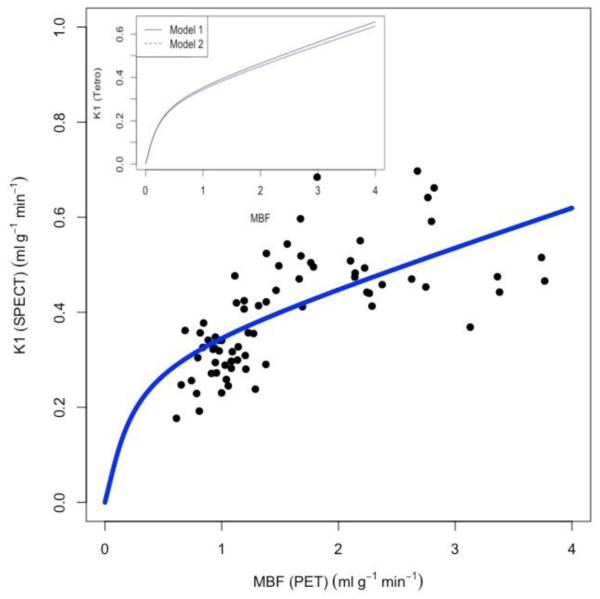
The K1-values in the three major coronary territories estimated from 99mTc-tetrofosmin for 9 patients both at rest and during stress were plotted against those estimated from 13N-NH3 PET (Figure 1). The estimated K1-values for 13N-NH3 were used to obtain the absolute myocardial blood flow by incorporating the known fitting parameters, A=0.096, B=1.083 for 13N-NH3.18 In Figure 2, the estimated K1-values for 99mTc-tetrofosmin were plotted against these corresponding absolute flow values for 13N-NH3. The best fit to Equation 2 provided the parameters A=0.91±0.11, B=0.34±0.20 (R2 = 0.49) for 99mTc-tetrofosmin. The insert shows the comparison between the two models (Equation 2 - full line, Equation 3 - dotted line). In the latter model the capillary PS value was found to be (α) * F + (β) = (0.091 ± 0.10) * F + (0.32 ± 0.16). The value of α is comparable to the value found previously (α = 0.069) for 99mTc-tetrofosmin in a porcine model.22 Furthermore, an ANOVA test revealed that there was no significant difference between the two fits (p<0.001).
Figure 1.
K1 estimates obtained with 99mTc-tetrofosmin SPECT (filled cicles, black) and 13N-NH3 PET (filled squares, red) plotted against the estimated MBF measured with 13N-NH3 PET for 9 patients at rest and stress. Note that K1 estimates measured with 13N-NH3 PET is nearly idential with MBF.
Figure 2.
Scatter plot and fit of K1 estimates (solid curve, blue) for 99mTc-tetrofosmin using the model to the experimental data (filled circles, black) (R2=0.49) for the subgroup of 9 patients at rest and stress. The best fit curve gave the extraction parameters A=0.91±0.11; B=0.34±0.20 for 99mTc-tetrofosmin. Insert: Comparison of the two models (1) (full line) and (2) (dotted line). In model (2) the capillary PS value is (α) * F + (β) = (0.091 ± 0.10) * F + (0.32 ± 0.16). ANOVA test revealed that there was no significant difference between the two models (p<0.001).
MBF Correlation
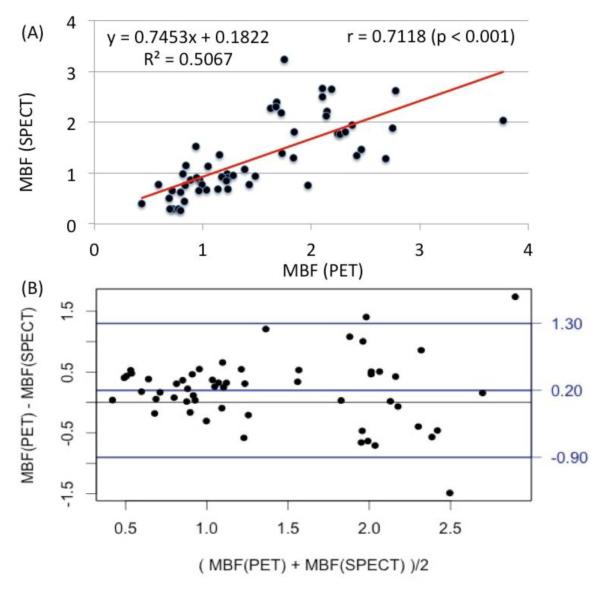
To assess the accuracy of the derived SPECT flow values, the MBF in three major coronary territories (LAD, RCA, and LCX) both at rest and during stress estimated with 99mTc-tetrofosmin SPECT were plotted in Figure 3(A) against the flow estimates measured with 13N-NH3 PET for an independent cohort comprised of 7 patients. The range of flow values was 0.44 ml/min/g to 3.81 ml/min/g. The Pearson correlation coefficient was found to be r = 0.71 (p < 0.001). A Bland-Altman analysis for the limits of agreement of the estimated MBF between the two modalities is shown in Figure 3(B). There is a systematic bias of the mean difference of +0.20. The 95% confidence interval lied between +1.96SD = 1.31 and −1.96SD = −0.79.
Figure 3.
(A) Correlation between absolute MBF (ml/min/g) in three vascular territories (LAD, RCA and LCX) estimated with 99mTc-tetrofosmin SPECT using the parameters in Equation 2 as described in Figure 2 and with 13N-NH3 PET in an independent cohort of 7 patients at rest and stress. The Pearson correlation coefficient was r=0.71 (p<0.001). (B) Bland-Altman analysis of the estimated MBF using dynamic PET and SPECT. The mean difference was +0.20 while the +1.96SD = 1.30 and −1.96SD = −0.90 for a 95% confidence interval.
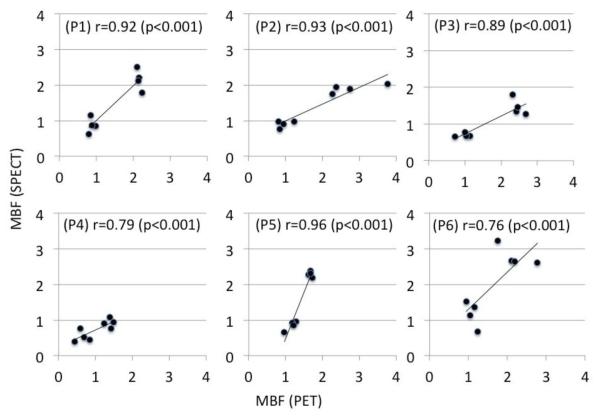
Individual patient-to-patient correlation of MBFs estimated with the two modalities for 6 patients in an independent cohort of 7 patients is shown in Figure 4. All correlations are statistically significant (p < 0.001) with (min, max) = (0.76, 0.96). Note that a high correlation only indicates a qualitative agreement and does not necessarily imply the quantitative concordance between the MBFs. This is reflected in the regression coefficient, i.e., the slopes of the trend lines deviate from the ideal value of one.
Fig. 4.
Patient to patient (P1- P6) correlation between MBFs estimated with with 99mTc-tetrofosmin SPECT and 13N-NH3 PET in an independent cohort of 6 patients. Although all correlations are statistically significant the regression coefficient, i.e. the slopes of the trend lines, vary from patient to patient.
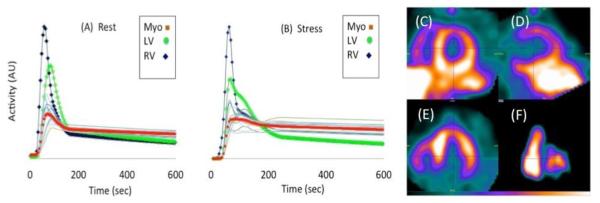
Figure 5 shows a typical example of time activity curves (TACs) for the regional myocardial segments, and left and right ventricular blood pools at rest (A) and during stress (B) for a patient who had a known anterior wall defect determined with conventional SPECT MPI. Also shown are the late time images (12 minutes after injection of 99mTc-tetrofosmin) for a mid-ventricular slice at rest in the short axis (C), vertical long axis (D), horizontal long axis (E), and RV-LV blood pool (F) at 60 sec after tracer injection. The CFR values from both dynamic SPECT and PET were abnormal in those areas showing myocardial perfusion abnormalities with conventional SPECT MPI.
Figure 5.
Time activity curves (TACs) for input functions (RV and LV) and regional myocardium (17-segments) at stress (A) and rest (B) in a patient with known anterior wall defect determined from conventional SPECT MPI. The TACs of LV, RV and total myocardium are highlighted. Late time mid-ventricular images (12 minutes after injection of 99mTc-tetrofosmin) with dynamic SPECT at rest in short axis (C), vertical long axis (D), horizontal long axis (E), and RV-LV blood pool at 60 sec after injection (F).
CFR Correlation
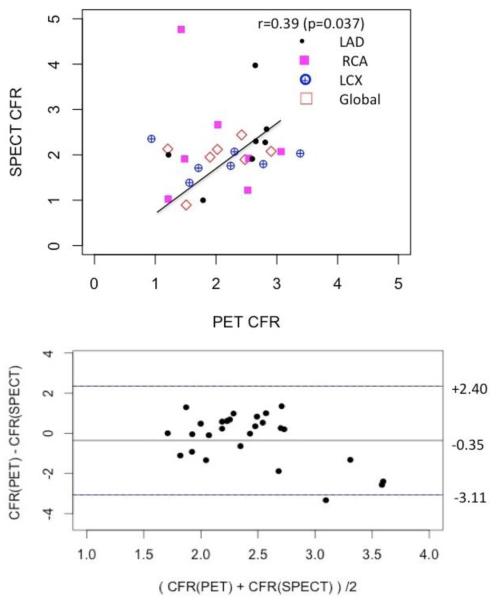
The correlation plot between CFR estimates obtained with 99mTc-tetrofosmin SPECT and with 13N-NH3 PET for the same set of data (Figure 3) is shown in Figure 6. The average Pearson correlation over all territories were moderate with the coefficient r = 0.39 yet statistically significant (p = 0.037). Bland-Altman plot indicated that there was a systematic overestimation of CFR in SPECT measurements with the mean difference of −0.35.
Figure 6.
Correlation between absolute coronary flow reserves (CFRs) for 3 vascular territories (LAD, RCA and LCX) in an independent cohort of 7 patients estimated with 13N-NH3 PET and 99mTc-tetrofosmin SPECT (upper plot). The Pearson correlation was moderate but still statistically significant r=0.39 (p = 0.037). Corresponding Bland- Altman plot is shown in the lower plot.
DISCUSSION
Our study assessed the feasibility of quantifying regional MBF using dynamic SPECT with a conventional two-headed SPECT camera and a commonly used myocardial perfusion agent 99mTc-tetrofosmin. The method was validated by correlating the flow measured using 99mTc-tetrofosmin dynamic SPECT with the flow obtained by 13N-NH3 PET. Despite the poor first past extraction of 99mTc-tetrofosmin by the myocardium, models (Equation 2 and Equation 3) were applied with 13N-NH3 PET data as the basis for blood flow measurements. This permitted the absolute quantification of MBF using dynamic SPECT with 99mTc-tetrofosmin. Unlike a dedicated cardiac SPECT camera with solid-state detectors, the conventional two-headed SPECT camera is readily available and widely used in the nuclear medicine community; hence it is possible to reproduce the method on clinically installed systems.23-25
There is a greater degree of MBF variability; even for a healthy cohort of normal patients the baseline MBF is not constant.26 Accurate measurement of MBF thus adds an extra dimension to the detection of CAD as well as the evaluation of cardiac pathophysiology in other conditions. For an ideal tracer such as 15O-H2O, vascular and cellular permeability and intercellular diffusion is very high and the perfusion index14 alone presents a good quantitative measure of regional perfusion and myocardial viability. However, 99mTc-tetrofosmin has a low extraction fraction at high flow rates resulting in smaller differences in the uptake between high and low flow regions. The absolute flow and CFR therefore present a better measure of coronary vascular reactivity and, excluding other confounding conditions, the possibility of quantitative diagnosis of CAD.
Both 13N-NH3 and 99mTc-tetrofosmin are taken up by the myocardium in proportion to the coronary blood flow. The metabolic changes and thus rate-limiting process of 13N-NH3 in the myocardium are fairly well understood, and are commonly modeled by a two-tissue compartment model.16 The first-pass myocardial extraction fraction of NH3 is relatively high, while 99mTc-tetrofosmin has a first-pass myocardial extraction fraction of only 54%27 with prolonged cellular retention. Although 99mTc-tetrofosmin is bound to mitochondria, there is no known further metabolic utilization within cardiac myocytes. In this study, a one-tissue compartment model was used to assess the time-varying activity of 99mTc-tetrofosmin as used previously for 99mTc-sestamibi.8, 28 The flow-dependent PS parameters found in our study (α) * F (β) = (0.091 ± 0.10) * F + (0.32 ± 0.16) are similar to the parameters obtained by Wells et al. for 99mTc-tetrofosmin in a porcine model.22
The correlation of MBF estimated with 99mTc-tetrofosmin SPECT and 13N-NH3 PET was statistically significant, r = 0.71 (p < 0.001). However, the corresponding CFR correlation was moderate (r = 0.39) due to considerable data scatter about the regression line, yet statistically significant (p = 0.037). This could be partly due to the long time interval between PET and SPECT studies (mean = 3.3 months). The correlation of global CFR (r = 0.59) was somewhat better, possibly because of higher counts statistics. Our working hypothesis throughout this study was that MBF measured from SPECT quantitatively agrees with that measured from PET irrespective of patient’s normal/abnormal condition. This assumption may be plausible in theory. But, in practice, it may be difficult to maintain identical patient physiological conditions, such as heart rate, perfusion pressure, myocardial viability, etc., in two studies within the span of 3 months.
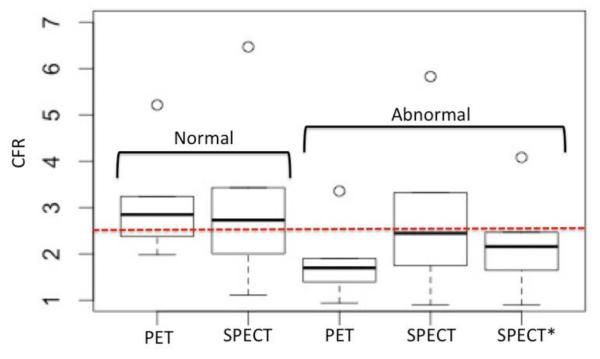
In Figure 7 we compared the statistics of the absolute CFRs estimated with 13N-NH3 PET and 99mTc-tetrofosmin SPECT in subgroups of normal (N = 7) and abnormal (N = 9) patients. We included all patients in these two heterogeneous groups partly due to a small sampling population comprised of only 16 patients who had both dynamic SPECT with 99mTc-tetrofosmin and dynamic PET with 13N-NH3. The estimated sample mean value of CFR in normal patients was 2.99±0.91 with PET compared to 2.96±1.39 with SPECT. Welch’s two-sample t-test showed the difference between means was not statistically significant (p = 0.048). However, the mean CFR value in the group of abnormal patients was 1.72±0.51 with PET and 2.47±1.82 with SPECT, and the difference was significant (p = 0.51). The mean CFR values still remained below the normal/abnormal borderline of 2.5 (dotted line, red). In view of the considerable data scatter of the SPECT flow estimates compared to the PET estimates, the accuracy of the SPECT approach to distinguish regions of normal and abnormal appears to be low. However, note that there were a few CFR data points in abnormal patients that were physiologically high in this patient cohort, and should be excluded. The corrected mean CFR with SPECT (Figure 7, SPECT*), after removing those outliers (CFR > 5), was 2.19±0.82. The difference between corrected mean CFR using dynamic SPECT with 99mTc-tetrofosmin and PET with 13N-NH3 was not significant with the level of confidence (p = 0.2). Table 3 presents the summary of statistical comparisons of CFR measurements between SPECT and PET in the subgroups of normal and abnormal patients.
Figure 7.
Statistical comparison of absolute CFRs estimated with 13N-NH3 PET and 99mTc-tetrofosmin SPECT in a heterogeneous group of normal (N=7) and abnormal (N=9) patients. (A) The estimated sample mean value of CFR in normal patients was 2.99±0.91 with PET compared to 2.96±1.39 with SPECT. The difference between means in the two methods was not statistically significant (p=0.048). However, the mean CFR value in abnormal patients was 1.72±0.51 with PET and was 2.47±1.82 with SPECT, and the difference was significant (p=0.51). The normal/abnormal CFR border line is 2.5. SPECT* represents the SPECT CFR for the abnomral group with the removal of outliers (n=5), i.e., the data points with CFR>5 were excluded in the calculation. The corrected estimated sample mean was 2.19±0.82. and the difference is not statistically significant with the level of confidence (p=0.2).
Table 3.
CFR summary statistics for normal and abnormal patient cohort.
| Min. | 1st Qu. | Median | Mean | 3rd Qu. | Max. | |
|---|---|---|---|---|---|---|
| PET (normal) | 1.981 | 2.379 | 2.704 | 2.99 | 3.237 | 5.212 |
| SPECT (normal) | 1.113 | 2.003 | 2.503 | 2.956 | 3.428 | 6.468 |
| PET (abnormal) | 0.9397 | 1.395 | 1.67 | 1.724 | 1.901 | 3.355 |
| SPECT (abnormal) | 0.8935 | 1.745 | 2.287 | 2.466 | 3.323 | 5.825 |
| SPECT* (abnormal) | 0.8935 | 1.648 | 2.124 | 2.192 | 2.467 | 4.082 |
In addition to a small sample size, there are other confounding factors - such as differences in sensitivity and resolution between PET and SPECT cameras - that could influence the estimation of the model parameters, A and B or (α) (β) for 99mTc-tetrofosmin. The estimation of the MBF estimation could also be adversely affected by a reduction in spatial resolution due to the large radius of rotation of the SPECT camera, the inability to perform subtraction-based scatter correction, and/or image blurring due to cardiac and respiratory motion on both SPECT and PET. Poor CFR correlation may be related in part to the composition of the patient population, which in addition to normal subjects, included patients with coronary artery disease, ischemic, and non-ischemic cardiomyopathies, patients with left ventricular hypertrophy, and prior CABG and PCI. Studies on patients with cardiomyopathies have often shown a blunted regional MBF and coronary flow reserve.29 The poor CFR correlation between PET and SPECT in abnormal patient cohort may be the reflection of our biased classification, which was based on SPECT MPI and dynamic PET data. It is generally accepted that coronary angiograph (CA) is the gold standard for defining flow related normal/abnormal coronary anatomy. However, in our studies we were not able to use CA because this was not performed in all patients.
There are other non-flow limiting factors, possibly related to the anatomy, hormone levels and metabolism of the specific cardiac pathophysiology, which could also influence endothelial function at the level of the arterioles and pre-capillaries, the site of the resistance vessels, and so may determine the tracer uptake and differential response to hyperemia in the regulation of MBF in PET and SPECT.
NEW KNOWLEDGE GAINED
It is feasible to quantify regional MBF in humans using dynamic SPECT with a conventional two-headed SPECT camera and 99mTc-tetrofosmin. Dynamic cardiac SPECT has the potential to better diagnose several cardiac myopathies that demonstrate blunted MBF. A continuous dynamic image of the tracer uptake provides a means for observing the time after tracer injection when the contrast of the myocardium to background is optimum.
CONCLUSIONS
In spite of immense clinical impact of quantifying MBF, only a few human studies for quantification of MBF with SPECT have been reported. Our study demonstrated the feasibility of measuring MBF using a widely used clinical two-headed SPECT camera. Our method was correlated with 13N-NH3 PET. Additional studies applying this method to a larger patient population including clinically defined homogenous groups will improve the model parameters and accuracy of the MBF measurement. Finally, precise implementation of kinetic analysis, better segmentation techniques by generating images of different tissue types based on their tracer uptake behavior30 and removing undesired liver and background activity would improve the accuracy of the method.
Acknowledgments
Authors would like to thank nuclear medicine technologists and staffs at UCSF local facility for conducting patient scans and Astellas Pharma US and GE Healthcare for providing Lexiscan and 99mTc-tetrofosmin, respectively. The study was supported by the National Institutes of Health under grant R01HL50663, and by the Director, Office of Science, Office of Biological and Environmental Research of the U.S. Department of Energy under contract DEAC02-05CH11231.
Abbreviations
- MBF
Myocardial blood flow
- MPI
Myocardial perfusion imaging
- CAD
Coronary artery disease
- CFR
Coronary flow reserve
- MPI
Myocardial perfusion index
- PCI
Percutaneous coronary intervention
- CABG
Coronary bypass graft surgery LEHR Low-energy high-resolution
- PSF
Point-spread-function
- TACs
Time activity curves
Footnotes
Disclosure
The authors have no conflict of interest.
REFERENCES
- 1.Shaw LJ, Iskandrian AE. Prognostic value of gated myocardial perfusion spect. J Nucl Cardiol. 2004;11:171–185. doi: 10.1016/j.nuclcard.2003.12.004. [DOI] [PubMed] [Google Scholar]
- 2.Berman DS, Kang X, Slomka PJ, Gerlach J, de Yang L, Hayes SW, Friedman JD, Thomson LE, Germano G. Underestimation of extent of ischemia by gated spect myocardial perfusion imaging in patients with left main coronary artery disease. J Nucl Cardiol. 2007;14:521–528. doi: 10.1016/j.nuclcard.2007.05.008. [DOI] [PubMed] [Google Scholar]
- 3.Schindler TH, Quercioli A, Valenta I, Ambrosio G, Wahl RL, Dilsizian V. Quantitative assessment of myocardial blood flow--clinical and research applications. Semin Nucl Med. 2014;44:274–293. doi: 10.1053/j.semnuclmed.2014.04.002. [DOI] [PubMed] [Google Scholar]
- 4.Murthy VL, Naya M, Foster CR, Hainer J, Gaber M, Di Carli G, Blankstein R, Dorbala S, Sitek A, Pencina MJ, Di Carli MF. Improved cardiac risk assessment with noninvasive measures of coronary flow reserve. Circulation. 2011;124:2215–2224. doi: 10.1161/CIRCULATIONAHA.111.050427. [DOI] [PMC free article] [PubMed] [Google Scholar]
- 5.Zeiher AM, Drexler H, Wollschlager H, Just H. Endothelial dysfunction of the coronary microvasculature is associated with coronary blood flow regulation in patients with early atherosclerosis. Circulation. 1991;84:1984–1992. doi: 10.1161/01.cir.84.5.1984. [DOI] [PubMed] [Google Scholar]
- 6.Danad I, Raijmakers PG, Appelman YE, Harms HJ, de Haan S, van den Oever ML, Heymans MW, Tulevski II, van Kuijk C, Hoekstra OS, Lammertsma AA, Lubberink M, van Rossum AC, Knaapen P. Hybrid imaging using quantitative h215o pet and ct-based coronary angiography for the detection of coronary artery disease. J Nucl Med. 2013;54:55–63. doi: 10.2967/jnumed.112.104687. [DOI] [PubMed] [Google Scholar]
- 7.Waller AH, Blankstein R, Kwong RY, Di Carli MF. Myocardial blood flow quantification for evaluation of coronary artery disease by positron emission tomography, cardiac magnetic resonance imaging, and computed tomography. Curr Cardiol Rep. 2014;16:483. doi: 10.1007/s11886-014-0483-6. [DOI] [PMC free article] [PubMed] [Google Scholar]
- 8.Ben-Haim S, Murthy VL, Breault C, Allie R, Sitek A, Roth N, Fantony J, Moore SC, Park MA, Kijewski M, Haroon A, Slomka P, Erlandsson K, Baavour R, Zilberstien Y, Bomanji J, Di Carli MF. Quantification of myocardial perfusion reserve using dynamic spect imaging in humans: A feasibility study. J Nucl Med. 2013;54:873–879. doi: 10.2967/jnumed.112.109652. [DOI] [PMC free article] [PubMed] [Google Scholar]
- 9.Wells RG, Timmins R, Klein R, Lockwood J, Marvin B, deKemp RA, Wei L, Ruddy TD. Dynamic spect measurement of absolute myocardial blood flow in a porcine model. J Nucl Med. 2014;55:1685–1691. doi: 10.2967/jnumed.114.139782. [DOI] [PubMed] [Google Scholar]
- 10.Petretta M, Storto G, Pellegrino T, Bonaduce D, Cuocolo A. Quantitative assessment of myocardial blood flow with spect. Progress in cardiovascular diseases. 2015;57:607–614. doi: 10.1016/j.pcad.2014.12.007. [DOI] [PubMed] [Google Scholar]
- 11.Gullberg GT, Reutter BW, Sitek A, Maltz JS, Budinger TF. Dynamic single photon emission computed tomography--basic principles and cardiac applications. Phys Med Biol. 2010;55:R111–191. doi: 10.1088/0031-9155/55/20/R01. [DOI] [PMC free article] [PubMed] [Google Scholar]
- 12.Shrestha U, Alhassen F, Seo Y, Botvinick EH, Gullberg GT. Reconstruction of gated dynamic cardiac spect data using spatiotemporal basis functions. 2012 Ieee Nuclear Science Symposium and Medical Imaging Conference Record (Nss/Mic).2012. pp. 2489–2492. [Google Scholar]
- 13.Reutter BW, Gullberg GT, Huesman RH. Direct least-squares estimation of spatiotemporal distributions from dynamic spect projections using a spatial segmentation and temporal b-splines. IEEE Trans Med Imaging. 2000;19:434–450. doi: 10.1109/42.870254. [DOI] [PubMed] [Google Scholar]
- 14.Ben-Haim S, Murthy VL, Breault C, Allie R, Sitek A, Roth N, Fantony J, Moore SC, Park MA, Kijewski M, Haroon A, Slomka P, Erlandsson K, Baavour R, Zilberstien Y, Bomanji J, Di Carli MF. Quantification of myocardial perfusion reserve using dynamic spect imaging in humans: A feasibility study. J Nucl Med. 2013;54:873–879. doi: 10.2967/jnumed.112.109652. [DOI] [PMC free article] [PubMed] [Google Scholar]
- 15.Fang YH, Muzic RF., Jr. Spillover and partial-volume correction for image-derived input functions for small-animal 18f-fdg pet studies. J Nucl Med. 2008;49:606–614. doi: 10.2967/jnumed.107.047613. [DOI] [PubMed] [Google Scholar]
- 16.Hutchins GD, Schwaiger M, Rosenspire KC, Krivokapich J, Schelbert H, Kuhl DE. Noninvasive quantification of regional blood flow in the human heart using n-13 ammonia and dynamic positron emission tomographic imaging. J Am Coll Cardiol. 1990;15:1032–1042. doi: 10.1016/0735-1097(90)90237-j. [DOI] [PubMed] [Google Scholar]
- 17.van den Hoff J, Burchert W, Borner AR, Fricke H, Kuhnel G, Meyer GJ, Otto D, Weckesser E, Wolpers HG, Knapp WH. [1-(11)c]acetate as a quantitative perfusion tracer in myocardial pet. J Nucl Med. 2001;42:1174–1182. [PubMed] [Google Scholar]
- 18.Schelbert HR, Phelps ME, Huang SC, Macdonald NS, Hansen H, Kuhl DE. N-13 ammonia as an indicator of myocardial blood-flow. Circulation. 1981;63:1259–1272. doi: 10.1161/01.cir.63.6.1259. [DOI] [PubMed] [Google Scholar]
- 19.Crone C. The permeability of capillaries in various organs as determined by use of the 'indicator diffusion' method. Acta Physiol Scand. 1963;58:292–305. doi: 10.1111/j.1748-1716.1963.tb02652.x. [DOI] [PubMed] [Google Scholar]
- 20.Renkin EM. Transport of potassium-42 from blood to tissue in isolated mammalian skeletal muscles. Am J Physiol. 1959;197:1205–1210. doi: 10.1152/ajplegacy.1959.197.6.1205. [DOI] [PubMed] [Google Scholar]
- 21.Bassingthwaighte JB. A concurrent flow model for extraction during transcapillary passage. Circ Res. 1974;35:483–503. doi: 10.1161/01.res.35.3.483. [DOI] [PMC free article] [PubMed] [Google Scholar]
- 22.Wells RG, Timmins R, Klein R, Lockwood J, Marvin B, deKemp RA, Wei LH, Ruddy TD. Dynamic spect measurement of absolute myocardial blood flow in a porcine model. J Nucl Med. 2014;55:1685–1691. doi: 10.2967/jnumed.114.139782. [DOI] [PubMed] [Google Scholar]
- 23.Slomka PJ, Berman DS, Germano G. Absolute myocardial blood flow quantification with spect/ct: Is it possible? J Nucl Cardiol. 2014;21:1092–1095. doi: 10.1007/s12350-014-0002-6. [DOI] [PubMed] [Google Scholar]
- 24.Nekolla SG, Rischpler C, Nakajima K. Myocardial blood flow quantification with spect and conventional tracers: A critical appraisal. J Nucl Cardiol. 2014;21:1089–1091. doi: 10.1007/s12350-014-9996-z. [DOI] [PubMed] [Google Scholar]
- 25.Koshino K, Fukushima K, Fukumoto M, Hori Y, Moriguchi T, Zeniya T, Nishimura Y, Kiso K, Iida H. Quantification of myocardial blood flow using (201)tl spect and population-based input function. Annals of nuclear medicine. 2014;28:917–925. doi: 10.1007/s12149-014-0888-8. [DOI] [PubMed] [Google Scholar]
- 26.Chareonthaitawee P, Kaufmann PA, Rimoldi O, Camici PG. Heterogeneity of resting and hyperemic myocardial blood flow in healthy humans. Cardiovascular research. 2001;50:151–161. doi: 10.1016/s0008-6363(01)00202-4. [DOI] [PubMed] [Google Scholar]
- 27.Husain SS. Myocardial perfusion imaging protocols: Is there an ideal protocol? Journal of nuclear medicine technology. 2007;35:3–9. [PubMed] [Google Scholar]
- 28.Hsu B, Chen FC, Wu TC, Huang WS, Hou PN, Chen CC, Hung GU. Quantitation of myocardial blood flow and myocardial flow reserve with 99mtc-sestamibi dynamic spect/ct to enhance detection of coronary artery disease. Eur J Nucl Med Mol Imaging. 2014;41:2294–2306. doi: 10.1007/s00259-014-2881-9. [DOI] [PubMed] [Google Scholar]
- 29.Vanderheyden M, Bartunek J, Verstreken S, Mortier L, Goethals M, de Bruyne B. Noninvasive assessment of coronary flow reserve in idiopathic dilated cardiomyopathy: Hemodynamic correlations. European journal of echocardiography : the journal of the Working Group on Echocardiography of the European Society of Cardiology. 2005;6:47–53. doi: 10.1016/j.euje.2004.06.006. [DOI] [PubMed] [Google Scholar]
- 30.Abdalah M, Boutchko R, Mitra D, Gullberg GT. Reconstruction of 4-d dynamic spect images from inconsistent projections using a spline initialized fads algorithm (sifads) IEEE Trans Med Imaging. 2015;34:216–228. doi: 10.1109/TMI.2014.2352033. [DOI] [PubMed] [Google Scholar]


