Abstract
Porous biosilica from diatom frustules is well known for its peculiar optical and mechanical properties. In this work, gold-coated diatom frustules are used as low-cost, ready available, functional support for surface-enhanced Raman scattering. Due to the morphology of the nanostructured surface and the smoothness of gold deposition via an electroless process, an enhancement factor for the p-mercaptoaniline Raman signal of the order of 105 is obtained.
Keywords: SERS, Diatoms, p-Mercaptoaniline
Background
Surface-enhanced Raman scattering (SERS) is a powerful tool in the fields of analytical chemistry, surface science, electrochemistry, biology, and materials research [1–4]. Its high sensitivity and low detection limit (concentrations of <10−8 M), along with reports of single molecule detection, are key advantages that make SERS suitable even in situations where normal Raman spectroscopy fails: Raman scattering signal is usually very weak since its cross section is very low (from 103 to 106 times weaker than linear Rayleigh scattering); by coupling the electromagnetic field of the incoming probe laser light with the plasmonic field (i.e., surface charge density oscillations of the metal conduction electrons) of the metallic surface, the Raman scattering cross section is greatly enhanced, and therefore also the Raman signal. Moreover, the interaction between molecules under investigation and the metal support could introduce some specific features in the Raman spectrum registered, which can be used for analytical purposes. To obtain appreciable enhancement of Raman scattering, a noble metal surface of nanometer-scale roughness covering macroscopic dimensions area is necessary. Therefore, appropriately prepared substrates are essential to obtain SERS signal enhancement [5–10]. The best signal enhancement factors are currently obtained using silver nanostructured surfaces that unfortunately undergo a sudden oxidation during measurement, making their use as stable supports impractical. In order to overcome material limitations, during the last decade, new classes of artificial materials known as metamaterials and “photonic crystals” and “photonic quasi-crystals” have shown to be very effective SERS substrates, including for applications in biochemical sensing [11, 12]. The production of such optical structures requires a highly specialized design and sophisticated nanoelectronic fabrication techniques, particularly time consuming and costly, such as electron-beam lithography or nanoimprinting, which are not always available in small laboratories. More accessible and cheaper alternative approaches are therefore needed. Diatoms are a group of single-celled photosynthetic algae that possesses microscale shells made of hydrated amorphous silica (SiO2), called frustules [13]. Frustules show very ornate surface nanoscale pore patterns forming an amazing range of intricate designs with hierarchical ordered dimensions that span from nanoscale to microscale. Due to the quasi-ordered pore patterns, diatoms are endowed with peculiar optical properties including photonic properties, which have been extensively studied in the last few years [14–16]. Unexpected optical properties, due to pores spatial arrangement, such as diffraction-driven self-focusing [17], and gas-sensitive photoluminescence emission, related to material composition, have been demonstrated [18].
In this contribution, we have synthetized, by an innovative method based on electroless deposition of gold, metal-coated diatom frustules that can be exploited as effective supports for SERS.
Methods
The Au plating solution (Oromerse Part B) was purchased from Technic, Inc. (USA). Tin(II) chloride, trifluoroacetic acid, ammonia, methanol, formaldehyde, sodium sulfite, sodium bicarbonate, sulfuric acid, and ethanol were supplied from Sigma-Aldrich (Australia). AgNO3 was obtained from Proscitech (Australia). p-Mercaptoaniline (pMA) 97 % was purchased from Sigma-Aldrich (Italy) and was used without further purification. Diatom frustules of Aulacoseria sp. were kindly furnished by Prof. D. Losic, University of Adelaide, Australia.
Diatom frustules were first incubated with hydrogen peroxide solution (35 %) over 24 h to increase the density of oxygen groups on the surface. The electroless Au deposition process includes three steps: sensitization of frustules in a solution of 0.026 M SnCl2 and 0.07 M trifluoroacetic acid for 45 min followed by rinsing in Milli-Q water; activation step, where the sensitized frustules were immersed into a 100-mL ammoniacal solution of 0.029 M AgNO3 for 30 min. During the activation step, a redox reaction helps in the deposition of Ag layer on the sensitized frustules. In the plating/galvanic displacement step, the activated frustules were immersed into a standard prebath solution for 1 h followed by a plating bath for the required deposition time (16–88 h). During this step, the Ag layer was galvanically displaced by Au in the plating bath solution which was kept at approximately 1 °C. The Au layer helps in the further oxidation of formaldehyde and concurrent reduction of Au(I) to Au(0), thus forming multiple layers of Au particles. The plating bath was prepared by mixing Au plating solution (Oromerse Part B, USA) containing 0.079 M Na3Au(SO3)2, 0.127 M Na2SO3, 0.625 M formaldehyde, and 0.025 M NaHCO3 in Milli-Q water. The pH was adjusted to 8–8.5 using sulphuric acid [19, 20].
Gold-coated frustules were examined by scanning electron microscopy (JEOL JSM-6400) equipped by energy dispersive X-ray analysis (EDAX) spectrometer (Noran Instruments Voyager Series IV).
The Raman spectra of pMA (both spontaneous and surface enhanced) were collected by a confocal Raman spectrometer (Horiba-Jobin Yvon Mod. Labspec Aramis) operating with a diode laser excitation source emitting at 785 nm. The 180° back-scattered radiation was collected by an Olympus metallurgical objective (MPlan 50x, NA = 0.75); a grating with 600 grooves/mm was used throughout. The radiation was focused onto a CCD detector (Synapse Mod. 354308) cooled at −70 °C by a Peltier module. Spectra were registered in the Raman-shift range 800–1800 cm−1. The laser power measured at the output of the objective was 18.7 mW, which resulted in about 17 mW/μm2 in terms of power density. The Raman band of a silicon wafer at 520 cm−1 was used to calibrate the spectrometer. Collection times were 3 s for non-SERS and 5 s for SERS spectra.
Results and Discussion
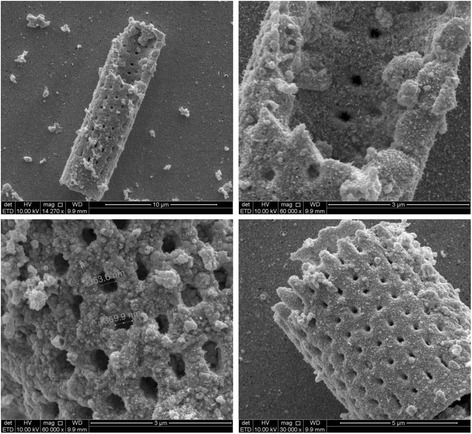
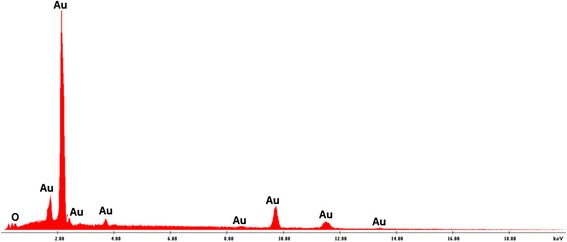
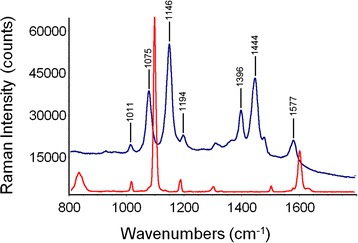
The key issue for high-performance SERS substrate is the existence of a uniform, continuous, thin layer of nanocrystalline metal onto the underlying 3D structure: the metal-dielectric interface is essential for both plasmon coupling and repeatable generation of SERS signal. Electroless deposition afforded a high density of Au nanoparticles on frustule surface that acted as preferred sites for further Au nucleation and growth during exposure to the plating solution [21]. The result was a complete coverage of the diatom frustules surface by a nanometric Au film, which completely preserved the original shape of the diatom micro-shell. Secondary electron (SE) images of Aulacoseira sp. diatom frustules after electroless deposition are reported in Fig. 1: the cylindrical-shaped frustules were micrometric in size (see Fig. 1a, d; 5–10 μm were total lengths of frustules) and showed ordered lines of nanometric pores (see Fig. 1b, c; 350–370 nm diameters); the outer and inner surfaces were covered by a fine grain Au layer (few nanometers of gold particles strongly interconnected) with some bigger coarse particle agglomerations. The EDAX spectra of the diatoms after electroless deposition confirmed the modified chemical nature of the surface since only the Au characteristic peaks were present in the spectrum reported in Fig. 2. The sensitivity of the SERS sensor based on Au-coated diatoms frustules (Au diatoms) was evaluated by measuring the scattering intensity of p-mercaptoaniline (pMA) probe molecules adsorbed on diatoms. Bonding of pMA to Au surfaces is generally believed to occur via a covalent interaction [22] with hydrogen loss from the thiol group and, therefore, is to be considered a chemisorption rather than a physisorption process. This reactivity produced compact, self-assembled monolayers (SAM) on the substrate surface [23–26]. Before carrying out SERS measurements, the Au-diatom powder was diluted in distilled water and dropped on an optical glass slide. After drying, a 10 μM pMA aqueous solution was dropped on the Au diatoms and dried at room temperature. In the confocal sampling mode, with the adopted objective, a spatial resolution of 1.7 μm2 is achieved in the x-y plane. Therefore, single diatoms can be spectroscopically characterized, collecting several spectra in different positions. The resulting SERS spectrum, in the range between 800 and 1800 cm−1 is shown in Fig. 3 (blue trace). For comparison, the spontaneous Raman spectrum of pMA powder (red trace in Fig. 3) is also reported. The intensities of the two spectra only seem to be comparable, since the number of molecules that generated the signals was very different. The number of molecules which contribute to the spontaneous Raman scattering (NREF = 2.55 × 10¹¹) was calculated as NREF = (Bν × DpMA/MpMA) × A, where Bν is the optical excitation volume, DpMA is the density of the pMA crystal at room temperature (1.06 g cm3), A is the Avogadro number and MpMA is the pMA molecular weight (125.19 g/mol). Bv depends on the Raman operating parameters. It was estimated by carrying out z profile measurements on a silicon substrate under the same operating conditions used for the acquisitions. By varying the focus of the laser on the silicon sample (z profile), the intensity variation of the silicon peak (520 cm−1) shows a Gaussian-type function as shown in Fig. 4. The full width at half maximum (FWHM) gives the waist length of the focal volume (z = 30.6 μm), the transverse dimension, x and y (1.28 μm, 1.28 μm) is determined in view of the numerical aperture of the objective (NA = 0.75) used for the specific wavelength (λLASER = 785 nm) according to the relation: 1.22 × λLASER/NA. The resulting Bυ is 50.1 μm3. The number of sampled molecules in the SERS experiment is 2.90 × 10⁶, assuming monolayer formation as reported in literature: thus, the enhancement consists in the fact that populations lower by a factor of around 105 produce comparable signals [22, 27].
Fig. 1.

(a, up left) Single micrometric diatom frustule. (b, up right) Au nanoparticle covers homogeneously the outer and inner surfaces of the frustule. (c, down left) An enlargement of outer surface with pore size measurement. (d, down right) A smaller micrometric frustule. All images are relative to 48 h of Au deposition time
Fig. 2.

EDAX signal from diatom surface shows only Au characteristic peaks
Fig. 3.

Raman (red trace) and SERS (blue trace) spectrum of pMA. The estimated number of sampled molecules is 2.55 × 10¹¹ for the Raman spectrum and 2.90 × 10⁶ for SERS, so that an enhancement factor of about 105 can be estimated
Fig. 4.

Depth profile on a silicon wafer to evaluate the sampling volume (Bν)
It was well evident that, beyond the enhancement effect, the SERS spectrum of pMA was more complex than the spontaneous one. In particular, the SERS peaks at 1011, 1075, 1194, and 1577 cm−1 supported a direct correspondence with signals observed in the non-resonant pattern, while the three prominent features at 1146, 1395, and 1444 cm−1 had not any counterparts in the spontaneous spectrum. The SERS behavior of pMA is complex and still a matter of debate: according to several authors, the new peaks observed in the SERS pattern were due to the dominance of a specific enhancement mechanism (that can be either electromagnetic or charge-transfer mediated) in a given situation and/or to the orientation of the probe with respect to the substrate surface [28–30]. More recently, it was demonstrated that pMA deposited on a roughened Ag surface reacted to form the dimeric form 4,4′-dimercaptoazobenzene (DMAB) under irradiation with a 632-nm laser line [30]. Quantum chemistry calculations performed on the above compound [31] suggested that the intense signals detected at 1143, 1390, and 1432 cm−1 on Ag substrates and at 1142, 1390, and 1440 cm−1 on Au substrates [32] and previously interpreted as b2 modes of pMA were in fact ag modes of the dimeric species. In view of the close similarity of the SERS pattern obtained in the present study with those reported in refs. [33, 34], we concluded that under the experimental conditions of our SERS experiment, the pMA molecule undergone an extensive conversion to DMAB via a catalytic coupling reaction on the metal surface of the Au-diatom system.
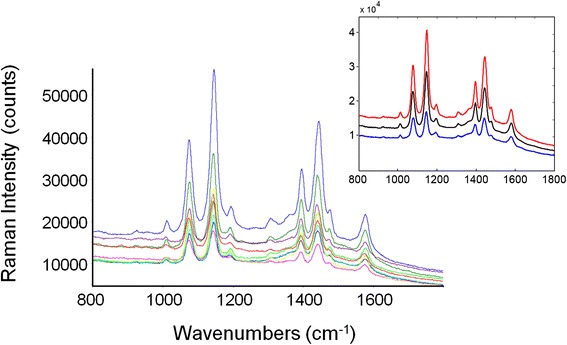
SERS spectra collected on different points of the Au-diatom surface are shown in Fig. 5. The average SERS spectrum and the average spectra ± standard deviations are displayed in the inset of Fig. 5.
Fig. 5.

SERS spectra collected on different points of the Au-diatom surface. The inset displays the average SERS spectrum (black trace) and the average spectrum ± standard deviation (blue and red traces)
The SERS spectra consistently presented the same series of peaks, and the intensity ratio between the main peaks was almost constant. The intensity of single peaks changed from point to point meaning that the Au-SERS response was not completely homogeneous. The spectra enhancement achieved demonstrated that Au-diatom-based substrates could be considered good candidates as SERS substrates, but at the same time, their response was not completely reproducible in terms of intensity. In order to characterize the SERS activity of the Au-diatoms substrate, the enhancement factor (EF) was estimated according to the formula:
where RSEN and RSREF are the integrated areas of a specific Raman band (at 1092 cm−1 in the reference spectrum and at 1075 cm−1 in the SERS) for the SERS and the spontaneous Raman spectrum, respectively [33, 34]. NEN and NREF represent the number of molecules contributing to the SERS and spontaneous Raman scattering, respectively. Assuming total coverage of the sensing surface, the number of molecules contributing to the SERS effect can be estimated as the ratio between the total metal surface illuminated by the laser beam (the transverse dimension) and the geometrical cross section of an individual pMA molecule (0.3 nm2 per molecule) [35]. However, the morphological analysis evidenced the presence of ordered lines of nanometric pores, which do not contribute to the available surface area. Thus, a filling factor (FF) needed to be multiplied by the total area in order to account for this effect. The FF is defined as
where Atot and Av represent, respectively, the total surface area of the diatom and the total area covered by holes. The average FF, estimated from an image analysis of numerous micrographs as that represented in Fig. 2c, was found to be 0.53.
The gold-diatom substrate was intrinsically heterogeneous on a macroscopic scale with respect to the nanometric dimensions of the sensing surface. This was due to the morphology and size of the diatoms. Therefore, a variable SERS response was expected, as a function of the sampling position in a confocal microscopic collection. In fact, as demonstrated in Fig. 5, the overall pattern was highly reproducible but the peak intensity displays a rather wide variation. From the data of Fig. 5, a maximum EF, EFmax of 1.0 × 10⁵ was estimated, while the average EF value is (4.6 ± 2.7) × 104. It should be highlighted that the above values should be considered as conservative estimates since the dimerization reaction decreased the concentration of pMA and, as a consequence, reduced the intensity of the analytical signal. In summary, the present substrate exhibited reasonably high values of EF, which, coupled with the low cost and the relatively simple preparation process, made them an attractive option for realizing highly sensitive SERS-based detectors.
Conclusions
The efficiency of gold-coated diatoms as SERS substrates was investigated by means of Raman spectroscopy. Gold-coated diatoms were found to be good SERS substrates, enhancing the spontaneous Raman scattering of pMA by a factor of 105. SERS spectra collected in different points on the sensing surface showed a reproducible scattering pattern but a relatively large variability in terms of intensity. This effect was due to the intrinsic heterogeneity at a microscale level of the sensing surface. Despite this limitation, gold-coated diatoms substrate may be considered a low-cost, easy to prepare, and very promising for analytical applications.
Footnotes
Competing Interests
The authors declare that they have no competing interests.
Authors’ Contributions
LDS and NHV planned the experiment. SC and NHV modified diatoms. MP and PM measured and commented Raman spectra. MP, IR, and LDS analyzed data and wrote the paper. All authors corrected and approved the paper.
Contributor Information
Marianna Pannico, Email: marianna.pannico@ipcb.cnr.it.
Ilaria Rea, Email: ilaria.rea@na.imm.cnr.it.
Soundarrajan Chandrasekaran, Email: soundarrajan.chandrasekaran@mymail.unisa.edu.au.
Pellegrino Musto, Email: pellegrino.musto@ipcb.cnr.it.
Nicolas H. Voelcker, Email: nico.voelcker@unisa.edu.au
Luca De Stefano, Email: luca.destefano@cnr.it.
References
- 1.Campion A, Kambhampati P. Surface-enhanced Raman scattering. Chem Soc Rev. 1998;27:241–250. doi: 10.1039/a827241z. [DOI] [Google Scholar]
- 2.Oklejas V, Sjostrom C, Harris JM. SERS detection of the vibrational Stark effect from nitrile-terminated SAMs to probe electric fields in the diffuse double-layer. J Am Chem Soc. 2002;124(11):2408–2409. doi: 10.1021/ja017656s. [DOI] [PubMed] [Google Scholar]
- 3.Shafer-Peltier KE, Haynes CL, Glucksberg MR, Van Duyne RP. Toward a glucose biosensor based on surface-enhanced Raman scattering. J Am Chem Soc. 2003;125(2):588–593. doi: 10.1021/ja028255v. [DOI] [PubMed] [Google Scholar]
- 4.Cao YWC, Jin RC, Mirkin CA. Nanoparticles with Raman spectroscopic fingerprints for DNA and RNA detection. Science. 2002;297(5586):1536–1540. doi: 10.1126/science.297.5586.1536. [DOI] [PubMed] [Google Scholar]
- 5.Smith DR, Padilla WJ, Vier DC, Nemat-Nasser SC, Schultz S. Composite medium with simultaneously negative permeability and permittivity. Phys Rev Lett. 2008;4:4184–4187. doi: 10.1103/PhysRevLett.84.4184. [DOI] [PubMed] [Google Scholar]
- 6.Vardeny ZV, Nahat A, Agrawal A. Optics of photonic quasicrystals. Nat Photon. 2013;7:177–187. doi: 10.1038/nphoton.2012.343. [DOI] [Google Scholar]
- 7.Alvarez-Puebla RA, et al. Special issue on surface-enhanced Raman spectroscopy. J Optics. 2015;17(11):110201. doi: 10.1088/2040-8978/17/11/110201. [DOI] [Google Scholar]
- 8.Dal Negro L, Boriskina S. Deterministic aperiodic nanostructures for photonics and plasmonics applications. Laser Photonics Rev. 2012;6:178–218. doi: 10.1002/lpor.201000046. [DOI] [Google Scholar]
- 9.Rippa M, Capasso R, Mormile P, De Nicola S, Zanella M, Manna L, Nenna G, Petti L. Bragg extraction of light in 2D photonic thue-morse quasicrystal patterned in active CdSe/CdS nanorods-polymer nanocomposites. Nanoscale. 2013;5(1):331–336. doi: 10.1039/C2NR31839C. [DOI] [PubMed] [Google Scholar]
- 10.Petti L, Rippa M, Zhou J, Manna L, Zanella M, Mormile P. Novel hybrid organic/inorganic 2D quasiperiodic PC: from diffraction pattern to vertical light extraction. Nanoscale Res Lett. 2011;6:371–376. doi: 10.1186/1556-276X-6-371. [DOI] [PMC free article] [PubMed] [Google Scholar]
- 11.Fang C, Ellis AV, Voelcker NH. Electrochemical synthesis of silver oxide nanowires, microplatelets and application as SERS substrate precursors, electrochim. Acta. 2012;59:346–353. [Google Scholar]
- 12.Cheng F, Bandaru M, Ellis A, Voelcker NH. Beta-cyclodextrin decorated nanostructured SERS substrates facilitate selective detection of endocrine disruptor chemicals. Biosens Bioelectron. 2013;42:632–639. doi: 10.1016/j.bios.2012.10.075. [DOI] [PubMed] [Google Scholar]
- 13.De Stefano M, De Stefano L. Nanostructures in diatom frustules: functional morphology of valvocopulae in Cocconeidacean monoraphid taxa. J Nanosci Nanotechnol. 2005;5:15–24. doi: 10.1166/jnn.2005.001. [DOI] [PubMed] [Google Scholar]
- 14.Losic D, Pillar RJ, Dilger T, Mitchell JG, Voelcker NH. Atomic force microscopy (AFM) characterization of the porous silica nanostructure of two centric diatoms. J Porous Mat. 2007;14:61–69. doi: 10.1007/s10934-006-9009-y. [DOI] [Google Scholar]
- 15.De Tommasi E, Rea I, Mocella V, Moretti L, De Stefano M, Rendina I, De Stefano L. Multi-wavelength study of light transmitted through a single marine centric diatom. Opt Exp. 2010;18(12):12203–12212. doi: 10.1364/OE.18.012203. [DOI] [PubMed] [Google Scholar]
- 16.De Tommasi E, De Luca AC, Lavanga L, Dardano P, De Stefano M, De Stefano L, Langella C, Rendina I, Dholakia K, Mazilu M. Biologically enabled sub-diffractive focusing. Opt Exp. 2014;22(22):27214–27227. doi: 10.1364/OE.22.027214. [DOI] [PubMed] [Google Scholar]
- 17.Ferrara MA, Dardano P, De Stefano L, Rea I, Coppola G, Rendina I, Congestri R, Antonucci A, De Stefano M, De Tommasi E. Optical properties of diatom nanostructured biosilica in Arachnoidiscus sp: micro-optics from Mother Nature. PLoS One. 2014;9(7):e103750. doi: 10.1371/journal.pone.0103750. [DOI] [PMC free article] [PubMed] [Google Scholar]
- 18.Bismuto A, Setaro A, Maddalena P, De Stefano L, De Stefano M. Marine diatoms as optical chemical sensors: a time resolved study. Sens Actuators B: Chem. 2008;130(1):396–399. doi: 10.1016/j.snb.2007.09.012. [DOI] [Google Scholar]
- 19.Losic D, Mitchell JG, Voelcker NH. Fabrication of gold nanostructures by templating from porous diatom frustules. New J Chem. 2006;6:908–914. doi: 10.1039/b600073h. [DOI] [Google Scholar]
- 20.Yu Y, Addai-Mensah J, Losic D. Synthesis of self-supporting gold microstructures with three-dimensional morphologies by direct replication of diatom templates. Langmuir. 2010;26(17):14068–14072. doi: 10.1021/la102083t. [DOI] [PubMed] [Google Scholar]
- 21.Menon VP, Martin CR. Fabrication and evaluation of nanoelectrode ensembles. Anal Chem. 1995;67:1920–1928. doi: 10.1021/ac00109a003. [DOI] [Google Scholar]
- 22.Mohri N, Matsushita S, Inoue M, Yoshikawa K. Desorption of 4-aminobenzenethiol bound to a gold surface. Langmuir. 1998;14:2343–2347. doi: 10.1021/la9707639. [DOI] [Google Scholar]
- 23.Wang H, Levin CS, Halas NJ. Nanosphere arrays with controlled sub-10-nm gaps as surface-enhanced raman spectroscopy substrates. J Am Chem Soc. 2005;127:14992–14993. doi: 10.1021/ja055633y. [DOI] [PubMed] [Google Scholar]
- 24.Jiao LS, Wang Z, Shen LNJ, You TY, Dong SJ, Ivaska A. In-situ electrochemical SERS studies on electrodeposition of aniline on 4-ATP/Au surface. J Solid State Interact. 2006;10:886–893. [Google Scholar]
- 25.Oldenburg SJ, Westcott SL, Averitt RD, Halas NJ. Surface enhanced Raman scattering in the near infrared using metal nanoshell substrates. J Chem Phys. 1999;111:4729–4736. doi: 10.1063/1.479235. [DOI] [Google Scholar]
- 26.Boettcher CJF. Theory of electric polarization. Amsterdam: Elsevier Scientific Publishing; 1973. pp. 74–82. [Google Scholar]
- 27.Cheng F, Brodoceanu D, Kraus T, Voelcker NH. Templated silver nanocube arrays for single-molecule SERS detection. RSC Advances. 2013;3:4288–4293. doi: 10.1039/c3ra22457k. [DOI] [Google Scholar]
- 28.Osawa M, Matsuda N, Yoshii K, Uchida I. Charge transfer resonance raman process in surface-enhanced raman scattering from p-aminothiophenol adsorbed on silver: Herzberg-Teller contribution. J Phys Chem. 1994;98:12702–12707. doi: 10.1021/j100099a038. [DOI] [Google Scholar]
- 29.Hu XG, Wang T, Wang L, Dong SJ. Surface-enhanced Raman scattering of 4-aminothiophenol self-assembled monolayers in sandwich structure with nanoparticle shape dependence: off-surface plasmon resonance condition. J Phys Chem C. 2007;111:6962–6969. doi: 10.1021/jp0712194. [DOI] [Google Scholar]
- 30.Uetsuki K, Verma P, Yano T, Saito Y, Ichimura T, Kawata S. Experimental identification of chemical effects in surface enhanced Raman scattering of 4-aminothiophenol. J Phys Chem C. 2010;114:7515–7520. doi: 10.1021/jp9114805. [DOI] [Google Scholar]
- 31.Maniu D, Chis V, Baia M, Toderas F, Astilean S. Density functional theory investigation of p-aminothiophenol molecules adsorbed on gold nanoparticles. J Optoelectron Adv M. 2007;9:733–736. [Google Scholar]
- 32.Huang YF, Zhu HP, Liu GK, Wu DY, Ren B, Tian ZQ. When the signal is not from the original molecule to be detected: chemical transformation of para-aminothiophenol on Ag during the SERS measurement. J Am Chem Soc. 2010;132:9244–9246. doi: 10.1021/ja101107z. [DOI] [PubMed] [Google Scholar]
- 33.Fang Y, Li Y, Xu H, Sun M. Ascertaining p, p′-dimercaptoazobenzene produced from p-aminothiophenol by selective catalytic coupling reaction on silver nanoparticles. Langmuir. 2010;26:7737–7746. doi: 10.1021/la904479q. [DOI] [PubMed] [Google Scholar]
- 34.Shin KS. Effect of surface morphology on surface-enhanced Raman scattering of 4-aminobenzenethiol adsorbed on gold substrates. J Raman Spectrosc. 2008;39:468–473. doi: 10.1002/jrs.1859. [DOI] [Google Scholar]
- 35.Marquestaut N, Martin A, Talaga D, Servant L, Ravaine S, Reculusa S, Bassani DM, Gillies E, Lagugné-Labarthet F. Raman enhancement of azobenzene monolayers on substrates prepared by Langmuir−Blodgett deposition and electron-beam lithography techniques. Langmuir. 2008;24(19):11313–11321. doi: 10.1021/la801697u. [DOI] [PubMed] [Google Scholar]


