

Abstract
Background:
Using the standard venous reference for the evaluation of continuous glucose monitoring (CGM) systems could possibly negatively affect measured CGM accuracy since CGM are generally calibrated with capillary glucose and venous and capillary glucose concentrations differ. We therefore aimed to quantify the effect of using capillary versus venous glucose reference samples on estimated accuracy in capillary calibrated CGM.
Methods:
We evaluated 41 individuals with type 1 diabetes mellitus (T1DM) using the Dexcom G4 CGM system over 6 days. Patients calibrated their CGM devices with capillary glucose by means of the HemoCue system. During 2 visits, capillary and venous samples were simultaneously measured by HemoCue and compared to concomitantly obtained CGM readings. The mean absolute relative difference (MARD) was calculated using capillary and venous reference samples.
Results:
Venous glucose values were 0.83 mmol/L (15.0 mg/dl) lower than capillary values over all glycemic ranges, P < .0001. Below 4 mmol/l (72 mg/dl), the difference was 1.25 mmol/l (22.5 mg/dl), P = .0001, at 4-10 mmol/l (72-180 mg/dl), 0.67 mmol/l (12.0 mg/dl), P < .0001 and above 10 mmol/l (180 mg/dl), 0.95 mmol/l (17.1 mg/dl), P < .0001. MARD was 11.7% using capillary values as reference compared to 13.7% using venous samples, P = .037. Below 4 mmol/l (72 mg/dl) MARD was 16.6% and 31.8%, P = .048, at 4-10 mmol/l (72-180 mg/dl) 12.1% and 12.6%, P = .32, above 10 mmol/l (180 mg/dl) 8.7% and 9.2%, P = .82.
Conclusion:
Using capillary glucose concentrations as reference to evaluate the accuracy of CGM calibrated with capillary samples is associated with a lower MARD than using venous glucose as the reference. Capillary glucose concentrations were significantly higher than venous in all glycemic ranges.
Keywords: continuous glucose monitoring (CGM), type 1 diabetes, accuracy, calibration, capillary, venous
Good glycemic control is essential to prevent complications in patients with type 1 diabetes,1-3 but a large proportion of these individuals have poor glycemic control and an excess risk of mortality.4,5 Continuous glucose monitoring (CGM) uses a subcutaneous tissue sensor that provides an interstitial fluid glucose measurement every 1-5 minutes. Use of CGM has been associated with improvements in overall glycemic control6-8 and may be important to avoid acute complications.
More accurate and reliable CGM data may help individuals improve their daily diabetes management.9,10 Only standardized and fair assessment of CGM can provide individuals and health care providers adequate information to select a CGM system that best fits the individuals’ needs.
The accuracy of CGM is assessed by comparing CGM measurements with reference glucose measurements. CGM accuracy assessment outcomes may be negatively impacted if the chosen reference method produces systemically biased results or the reference method differs from the method used to calibrate the CGM device. Methods for assessing CGM accuracy differ substantially.11-19
In contrast to self-monitoring of blood glucose (SMBG) accuracy assessment with split samples (ISO 15197), CGM cannot be assessed with reference measurements from the same sample since CGM measures interstitial fluid glucose and interstitial fluid is not readily available for sampling. Consequently reference glucose from a different body compartment (venous, capillary, arterial) is used for assessment of CGM accuracy. Venous reference glucose has become the standard reference in CGM accuracy studies since it allows frequent measurements on laboratory grade reference instruments over the duration of a prolonged clinic session. However in most study setups CGM were calibrated by capillary values as would be performed in daily life when using CGM. Thus besides CGM accuracy being assessed with a reference from a different body compartment than where it measures glucose, it is assessed with a reference from another body compartment than what is used for calibration (venous versus capillary).13-15 The effect on measured CGM accuracy of using reference glucose from another body compartment than what is used for calibration is unknown.11-19
In a recent head-to-head study of 2 CGM systems, we drew both capillary and venous reference samples at the same time using the same laboratory method.12 Results from this study and previous studies investigating relationships of glucose concentrations in capillary and venous whole blood indicated a significant difference between venous and capillary glucose concentration.12,20-22 The aim of the present study was to evaluate how the estimated accuracy of CGM differs when either venous (standard) or capillary glucose levels (equal body fluid as used for calibration) were used as the reference in a CGM system calibrated with capillary glucose concentrations.
Methods
Cohort
Data used in this study were previously presented.12 In brief, a nonrandomized, unblinded, 4- to 6-day study was performed in patients with type 1 diabetes. The manufacturer of the CGM system was not involved in designing or carrying out the study and provided no study support in terms of CGM systems, sensors, salaries, or other costs. The purpose of the study was to compare the accuracy of a stand-alone CGM system (Dexcom G4 Platinum, DG4P; Dexcom, San Diego, CA) to that of the Guardian Real-Time CGM system (Enlite, Medtronic, Northridge, CA). The study was performed at the NU Hospital Group, consisting of 5 hospitals in the western part of Sweden.
Inclusion and exclusion criteria have previously been described in detail.12 In brief, patients with type 1 diabetes age 18 to 75 years were included. Exclusion criteria were current pregnancy, cognitive dysfunction, other disease making CGM use difficult, continuous use of acetaminophen, or current use of CGM.
After an inclusion visit, sensors from both CGM systems were inserted in the abdominal region of each patient during an initial hospital visit. If sensor failure occurred before the third study day, the sensor was replaced. Patients visited the clinical research center (CRC) on 2 occasions (days 1-3 and 4-6) while wearing CGMs. They were allowed to eat their regular meals and inject insulin as usual, glucose change was not intentionally induced. Mealtime was not registered. Patient arrived before breakfast or after lunch. During each visit, 7 venous blood samples were obtained through an intravenous catheter, with a sampling interval of at least 15 minutes between specimens. At these 2 visits 3 capillary finger-stick blood glucose samples were obtained simultaneously (within 1 minute of each other) with venous samples. CGM glucose values were also recorded simultaneously with capillary and venous values and were registered every 5 minutes. Both venous and capillary samples were taken and measured by a HemoCue measurement system (Ängelholm, Sweden). Each reagent lot of the HemoCue system is calibrated by fresh patient samples using an absolute isotope-dilution GC-MS measurement system.23 The trueness of the HemoCue measurement system is therefore amongst the best of the measurement systems marked in Sweden, including large systems for University laboratories. Depending on glucose levels the intermediate imprecision (CV%) of the HemoCue measurement system is for capillary and venous samples is 1.4%-2.3%. The total analytical error is less than 6.5%.24 Capillary glucose measured by HemoCue was used to calibrate both CGMs. Data from the CGM and HemoCue systems were recorded at each visit.
Procedures
The Dexcom G4 sensor has been shown to be more accurate than the Enlite sensor both in connection to insulin pump and stand-alone systems.12,16,18 Therefore, to minimize the effect of random error on measured outcomes, data from the Dexcom G4 stand-alone system were used for analyses in the present study. Only venous glucose data samples with concurrent capillary and CGM data (maximally 1 minute between measurements) were used for analysis purposes (defined as the ITT population). Consequently, a maximum of 6 combined venous, capillary, and CGM samples were available per patient.
The predefined primary outcome was to evaluate whether the mean absolute relative difference (MARD) differed when either venous or capillary glucose samples were used as reference values in capillary calibrated CGM. We also compared the correlation coefficient between CGM values and capillary values to that between venous and CGM values. The correlation coefficient was computed for subjects with at least 4 measurements of capillary and venous glucose values together with CGM values. A subanalysis was performed to assess the effect of rate of change on MARD when using either venous or capillary glucose samples as reference values in capillary calibrated CGM. Furthermore rate of change at the time of calibration was registered. Rates of change were calculated based on the capillary glucose readings and was defined as the difference between current and previous (within 20 minutes) glucose sample, given as change in mg/dL/minute.20
MARD was also estimated in 3 different glucose ranges: hypoglycemia (<4 mmol/L, <72 mg/dL), euglycemia (4-10 mmol/L, 72-180 mg/dL), and hyperglycemia (>10 mmol/L, >180 mg/dL). The various ranges were determined based on venous samples. The correlation coefficient was not computed in the 3 different glucose ranges, since no subject had more than 3 observations of capillary and venous glucose together with CGM values in hypoglycemic and hyperglycemic ranges. In hypoglycemia, the mean absolute difference (MAD) using capillary and venous reference was also computed as a complement to MARD. Within the same glucose ranges we estimated whether capillary differed from venous glucose levels as well as the overall difference between venous and capillary glucose levels in the cohort. The distribution of the difference between capillary and venous reference glucose values was calculated over the glycemic range and presented in a Bland–Altman plot, The MARD of the Dexcom G4 was also analyzed in relation to venous and capillary values as a continuous function of the glucose level.
The study was approved by the internal review board at the NU-Hospital Group, Trollhättan, Sweden.
Statistics
The primary effectiveness hypothesis to be tested was:
Univariate analyses were performed for descriptive statistics of evaluated variables. All comparisons were conducted at an α = .05 level of significance using 2-tailed tests. For descriptive purposes, means with standard deviations (SDs) and medians with minimum and maximum values are presented for continuous variables; numbers with percentages are presented for categorical variables. The Wilcoxon signed-rank test was used to compare nonnormally distributed continuous data. Point estimates and 95% confidence intervals (CIs) for the difference (Δ) between 2 outcomes are provided using the Hodges–Lehmann procedure.25,26 The MARD of the Dexcom G4 analyzed in relation to venous and capillary reference glucose values as a continuous function of glucose levels was performed by fitting a second-order spline. Analyses were performed using SAS version 9.3 (SAS, Inc, Cary, NC).
Results
Patient Characteristics
Among 46 subjects enrolled, 41 met the criteria to be included in the current analysis, ITT population (ie, had at least 1 capillary and 1 venous glucose value taken simultaneously with a CGM value). Baseline characteristics of the cohort are shown in Table 1. The mean age was 50.7 years, 65.9% (n = 27) were men, mean diabetes duration was 23.4 years and mean HbA1c was 7.6% (59.3 mmol/mol). There were 10 individuals (24.4%) who used continuous insulin infusion (CSII) for insulin delivery and 31 (75.6%) who used multiple daily insulin injections (MDI).
Table 1.
Patient Characteristics in the Cohort.
| Variable | ITT population (n = 41) |
|---|---|
| Age (years) | 50.7 (14.7) 50.1 (20.8; 73.6) n = 41 |
| Sex | |
| Male | 27 (65.9%) |
| Female | 14 (34.1%) |
| Body mass index (kg/m2) | 24.9 (3.8) 25.3 (18.9; 34.1) n = 35 |
| Waist circumference (cm) | 90.7 (10.4) 91.0 (71.0; 108.0) n = 37 |
| Smoking | |
| Never smoked | 31 (75.6%) |
| Previous smoker | 8 (19.5%) |
| Current smoker | 2 (4.9%) |
| HbA1c (IFCC, mmol/mol) | 59.3 (10.4) 59.0 (34.0; 77.0) n = 40 |
| HbA1c (DCCT, %) | 7.6 (1.0) 7.5 (5.3; 9.2) n = 40 |
| Diabetes duration (years) | 23.4 (16.5) 18.0 (1.0; 57.0) n = 41 |
| Insulin delivery | |
| CSII | 10 (24.4%) |
| MDI | 31 (75.6%) |
| Total daily insulin/kg | 0.56 (0.18) 0.56 (0.18; 0.89) n = 36 |
| Albumin-creatinine ratio (µg/mg) | 1.87 (6.00) 0.65 (0.04; 37.50) n = 38 |
| Systolic blood pressure (mmHg) left | 121.3 (11.8) 120.0 (99.0; 149.0) n = 38 |
| Diastolic blood pressure (mmHg) left | 70.7 (11.9) 71.5 (48.0; 90.0) n = 38 |
| Myocardial infarction | |
| Yes | 2 (4.9%) |
| No | 39 (95.1%) |
| Percutaneous coronary intervention | |
| Yes | 2 (4.9%) |
| No | 39 (95.1%) |
| Bypass surgery | |
| Yes | 1 (2.4%) |
| No | 40 (97.6%) |
| Stroke | |
| Yes | 3 (7.3%) |
| No | 38 (92.7%) |
| Retinopathy | |
| None | 20 (48.8%) |
| Simplex | 11 (26.8%) |
| Nonproliferative | 6 (14.6%) |
| Proliferative | 4 (9.8%) |
| Neuropathy | |
| Yes | 6 (14.6%) |
| No | 35 (85.4%) |
For categorical variables, data are n (%). For continuous variables, data are mean (SD) / median (Min; Max) / n.
Relationship Between Venous and Capillary Glucose Levels
Capillary glucose levels in the cohort were significantly higher than venous glucose levels, with an overall mean difference of 0.83 mmol/l (15.0 mg/dl), P < .0001. The mean of all capillary glucose values was 8.98 mmol/l (SD 2.82 mmol/l), 161.6 mg/dl (SD 50.8 mg/dl) and the mean of venous glucose levels was 8.15 mmol/l (SD 2.58 mmol/l), 146.6 mg/dl (SD 46.4 mg/dl).
In Table 2 the mean and median of capillary and venous glucose levels along with their respective standard deviations and minimum and maximum values are shown for 3 different glucose ranges defined from venous samples. Capillary glucose levels were higher than venous glucose levels in all glycemic ranges, with a difference of 1.25 mmol/l (22.5 mg/dl) in the hypoglycemic range, defined as <4.0 mmol/l (72 mg/dl). The mean of venous and capillary samples in this glycemic range was 4.59 mmol/l (SD 1.01 mmol/l), 82.5 mg/dl (SD 18.2 mg/dl) versus 3.33 mmol/l (SD 0.52), 60.0 mg/dl (SD 9.3). The smallest difference was observed in the euglycemic range, defined as 4-10 mmol/l (72-180 mg/dl) with a difference of 0.67 mmol/l (12.0 mg/dl), P < .0001. Figure 1 is a Bland–Altman plot of the difference between capillary and venous glucose levels for each individual observation, which also shows consistently higher capillary than venous glucose levels, especially in the hypoglycemic range.
Table 2.
Mean, Median, and Differences of Capillary and Glucose Levels, Overall and in Various Glucose Ranges.
| Mean glucose content within individual (mg/dL) |
Venous-capillary |
||||
|---|---|---|---|---|---|
| Glucose range | Capillary | Venous | Observed differences | Point estimate (95% CI) for difference | P value |
| All measured values | 161.6 (50.8) 156.3 (72.6; 296.1) n = 41 |
146.6 (46.4) 139.2 (72.6; 269.1) n = 41 |
−15.0 (9.2) −14.4 (–41.9; 0.0) n = 41 |
−14.4 (−17.4; –11.7) | <.0001 |
| Hypoglycemic range: venous glucose <72 mg/dL (<4 mmol/L) | 82.5 (18.2) 75.6 (63.0; 122.4) n = 14 |
60.0 (9.3) 59.9 (36.0; 70.2) n = 14 |
−22.5 (19.1) −16.2 (–66.6; –2.7) n = 14 |
−20.7 (−34.6; –9.9) | .0001 |
| Euglycemic range: venous glucose 72-180 mg/dL (4-10 mmol/L) | 137.5 (29.2) 141.5 (54.0; 214.2) n = 38 |
125.5 (22.7) 122.6 (73.8; 176.4) n = 38 |
−12.0 (10.7) −11.9 (–37.8; 19.8) n = 38 |
−12.1 (−15.4; –8.6) | <.0001 |
| Hyperglycemic range: venous glucose >180 mg/dL (>10 mmol/L) | 235.0 (34.3) 227.0 (185.4; 322.8) n = 24 |
217.8 (27.7) 210.8 (183.6; 295.2) n = 24 |
−17.1 (10.7) −15.0 (–41.9; –1.8) n = 24 |
−16.2 (−21.6; –12.0) | <.0001 |
Data are mean (SD) / median / (min; max) / n. Point estimates and confidence intervals for differences were obtained using Hodges–Lehmann’s procedure. For comparison of glucose levels, the Wilcoxon signed-rank test was used.
Figure 1.
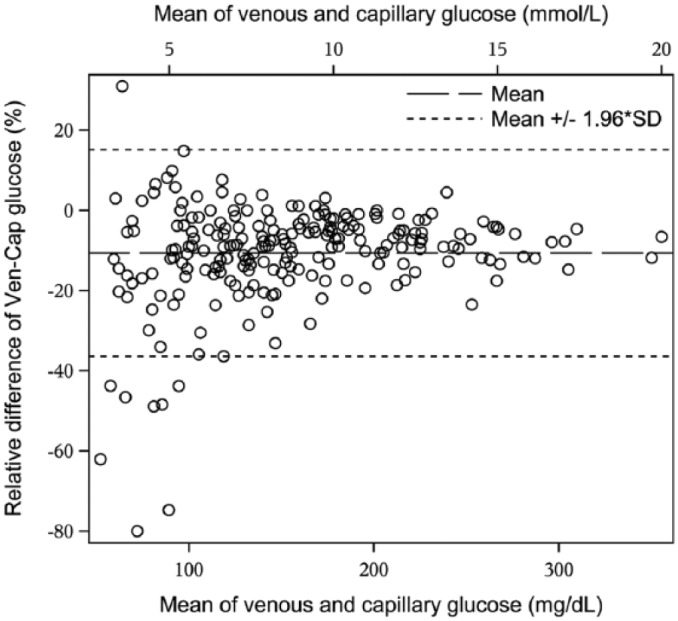
Bland–Altman plot showing venous glucose versus capillary glucose levels for all measured values in the cohort.
Estimated MARD of CGM When Using Capillary and Venous Samples as the Reference
The primary outcome, MARD as a measure of the accuracy of the Dexcom G4, was significantly lower when capillary glucose samples were used as the reference as opposed to venous glucose samples: 11.69% (SD 6.80%) versus 13.66% (SD 6.70%) with an observed difference of 1.97 percentage units (SD 7.74 percentage units), Δ = 2.03 percentage units (95% CI, 0.19-4.08 percentage units), P = .037. Table 3 contains mean and median values of the MARD when capillary and glucose values were used as references to determine the accuracy (combination of imprecision and bias) of the Dexcom G4, as well as their respective standard deviations and minimum and maximum values, observed differences, and point estimates of differences overall and for various glucose ranges. In all glycemic ranges the MARD of Dexcom G4 was numerically lower when capillary values were used as the reference, although the association was only significant in the hypoglycemic range (<4.0 mmol = 72 mg/dl), with an MARD of 16.58% (SD 15.38) versus 31.81% (SD 25.96), observed difference 15.24 percentage units (SD 31.52), Δ = 14.14 percentage units (95% CI 0.41-32.99), P = .0479. In hypoglycemia, MAD was 15.0 mg/dL (SD 17.7) versus 17.8 mg/dL (SD 13.1), Δ = 5.4 (95% CI, -4.9 to 16.2 mg/dL), P = .2498.
Table 3.
Mean Absolute Relative Difference (MARD) of Dexcom G4 based on Capillary Versus Venous Glucose References When Calibrating CGM by Capillary Values.
| Capillary | Venous | Venous-capillary | Point estimate (95% CI) for differencea | P value | |
|---|---|---|---|---|---|
| MARD (%) | 11.69 (6.80) 9.81 (0.00; 30.37) n = 41 |
13.66 (6.70) 11.66 (5.72; 34.53) n = 41 |
1.97 (7.74) 2.41 (–22.47; 21.51) n = 41 |
2.03 (0.19; 4.08) | .0371 |
| Pearson correlation | 0.84 (0.25) 0.93 (–0.20; 1.00) n = 38 |
0.85 (0.20) 0.93 (0.07; 1.00) n = 38 |
0.01 (0.15) −0.00 (–0.34; 0.62) n = 38 |
−0.00 (–0.03; 0.02) | .7489 |
| MARD (%) hypoglycemic range: venous glucose <72 mg/dL (<4 mmol/L) | 16.58 (15.38) 11.43 (0.00; 52.94) n = 13 |
31.81 (25.96) 25.81 (3.23; 88.73) n = 13 |
15.24 (31.52) 14.14 (–49.72; 82.48) n = 13 |
14.14 (0.41; 32.99) | .0479 |
| MARD (%) euglycemic range: venous glucose 72-180 mg/dL (4-10 mmol/L) | 12.09 (7.98) 9.32 (0.00; 40.00) n = 38 |
12.56 (6.30) 11.92 (2.44; 26.84) n = 38 |
0.47 (9.92) 1.63 (–37.56; 19.49) n = 38 |
1.19 (–1.63; 3.99) | .3199 |
| MARD (%) hyperglycemic range: venous glucose >180 mg/dL (>10 mmol/L) | 8.74 (6.57) 7.37 (0.77; 23.32) n = 24 |
9.16 (5.83) 9.07 (0.00; 27.20) n = 24 |
0.42 (7.43) 0.60 (–14.23; 15.23) n = 24 |
0.43 (–3.06; 3.40) | .8247 |
Data are mean (SD) / median / (min; max) / n. Point estimates and confidence intervals for differences were obtained using Hodges–Lehmann’s procedure. For comparison of accuracy, the Wilcoxon signed-rank test was used.
Venous-capillary.
In Figure 2 the absolute relative difference (ARD) of the Dexcom G4 using venous or capillary reference values is plotted for each individual observation. Figure 2 also shows MARD as a continuous function of capillary and venous glucose levels respectively, showing that MARD using capillary reference is lower than for venous reference over the entire glycemic range, with the difference most pronounced in the hypoglycemic range.
Figure 2.
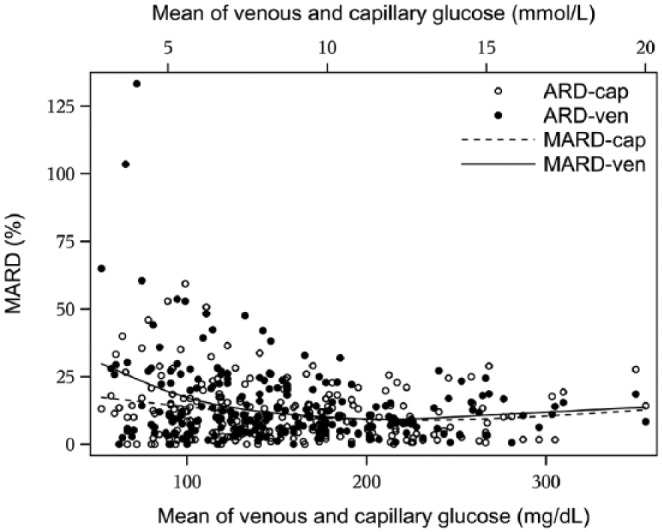
MARD for Dexcom G4 as a continuous function of capillary and venous glucose levels when calibrating CGM with capillary glucose values. Absolute relative difference (ARD) for Dexcom G4 in relation to capillary and venous glucose concentrations is also plotted for all observations in the cohort.
Correlation Coefficient
No significant difference existed in the correlation coefficient between capillary glucose and CGM values compared to venous glucose to CGM values, 0.84 and 0.85, respectively, P = .75. There were insufficient data available for each individual to estimate the correlation coefficient within various glycemic ranges.
Rate of change
CGM was calibrated at an average and stable glucose of 150.7 mg/dL, rate of change 0.06 mg/dL/min (Table 4). MARD as measure of the accuracy of Dexcom G4 was significantly lower when capillary glucose samples were used as the reference as opposed to venous glucose samples during decreasing glucose values (< 1 mg/dL/ min): 11.66% (SD 10.31%) versus 27.02% (SD 25.47) with an observed difference of 15.37 percentage units (SD 21.62%), Δ = 12.14 percentage units (95% CI, 2.67-23.52%), P = .0052. Table 5 contains mean and median values of the MARD when capillary and glucose values were used as references to determine the accuracy of the Dexcom G4, as well as their respective standard deviations and minimum and maximum values, observed differences, and point estimates of differences for various rates of change. Also average glucose is given for various rates of change.
Table 4.
Descriptive Statistics for Calibration Glucose Levels and Rate of Change of Capillary Glucose Levels.
| Variable | Descriptive statistics |
|---|---|
| Calibration glucose levels (mg/dL) | 150.7 (63.9) 140.8 (104.9; 185.8) (38.0; 413.5) n = 635 |
| Rate of change (mg/dL/min) at time of calibration | 0.06 (2.08) 0.00 (–0.79; 0.61) (–24.55; 20.38) n = 3686 |
| Rate of change (mg/dL/min) at time of blood sample taking | 0.01 (0.97) 0.00 (–0.61; 0.58) (–5.82; 4.41) n = 1520 |
Data are mean (SD) / median (Q1; Q3) / (min; max) / n.
Table 5.
Mean Absolute Relative Difference (MARD) of Dexcom G4 Based on Capillary Versus Venous Glucose References for Various Rates of Change.
| MARD (%) |
Mean glucose content (mg/dL) |
|||||||||
|---|---|---|---|---|---|---|---|---|---|---|
| Capillary | Venous | Observed differencesa | Point estimate (95% CI) for difference | P value | Capillary | Venous | Observed differencesa | Point estimate (95% CI) for difference | P value | |
| Decreasing glucose (rate of change < –1 mg/dL/min) | 11.66 (10.31) 9.91 (0.00; 33.33) n = 14 |
27.02 (25.47) 18.00 (6.96; 103.57) n = 14 |
15.37 (21.62) 7.40 (–6.60; 76.90) n = 14 |
12.14 (2.67; 23.52) | .0052 | 147.2 (70.4) 134.1 (59.4; 315.0) n = 14 |
132.4 (70.0) 109.8 (50.4; 291.6) n = 14 |
−14.8 (10.9) −12.6 (–37.8; 1.8) n = 14 |
−14.4 (–21.6; –9.0) | .0004 |
| Stable glucose (rate of change −1 to 1 mg/dL/min) | 11.84 (7.62) 10.11 (0.00; 39.06) n = 40 |
13.29 (7.15) 11.66 (4.02; 34.53) n = 40 |
1.46 (9.50) 2.61 (–32.88; 22.13) n = 40 |
1.71 (–0.65; 4.23) | .1450 | 155.4 (49.0) 147.1 (73.8; 285.6) n = 40 |
141.1 (45.5) 135.2 (74.7; 257.0) n = 40 |
−14.3 (9.6) −12.6 (–40.8; 3.6) n = 40 |
−13.8 (–16.8; –10.9) | <.0001 |
| Increase glucose (rate of change > 1 mg/dL/min) | 12.44 (8.45) 9.09 (1.03; 27.67) n = 17 |
11.33 (7.72) 10.88 (0.85; 31.91) n = 17 |
−1.12 (10.60) −1.64 (–17.68; 21.20) n = 17 |
−1.64 (–6.86; 4.56) | .4874 | 202.9 (68.0) 201.6 (114.0; 370.8) n = 17 |
183.2 (59.3) 171.0 (106.8; 329.4) n = 17 |
−19.6 (14.7) −15.3 (–45.0; 1.8) n = 17 |
−19.8 (–28.3; –11.2) | <.0001 |
Data are mean (SD) / median / (min; max) / n. Point estimates and confidence intervals for differences were obtained using Hodges–Lehmann’s procedure. For comparison of accuracy, the Wilcoxon signed-rank test was used.
Venous-capillary.
Discussion
In the present study we evaluated the use of venous versus capillary glucose values as the reference in a capillary calibrated CGM system, we found a higher level of accuracy as estimated by MARD for capillary than venous reference glucose values. With capillary glucose values used as the reference, the Dexcom G4 CGM device showed a significantly lower MARD, 11.7%, compared to 13.7% when venous samples were used (difference: 1.97 percentage units). The correlation coefficient did not differ for capillary versus venous samples in relation to CGM values. The difference in MARD was most pronounced in the hypoglycemic range. Venous glucose levels were significantly lower than capillary glucose levels in all glycemic ranges. The overall difference between capillary and venous glucose was 0.83 mmol/l (15.0 mg/dl). The largest difference existed in the hypoglycemic range and was 1.25 mmol/l (22.5 mg/dl). Also during negative rate of change we found a higher level of accuracy estimated by MARD for capillary than venous reference glucose values. Irrespective whether the glucose concentrations was stable or rapidly fluctuating there was a difference in capillary and venous glucose concentrations.
Venous glucose values measured by YSI (YSI 2300 stat plus, Xylem Inc, Rye Brook, NY) has become the most commonly used reference method for CGM accuracy assessment studies.13,14,19,27 In most CGM performance studies, CGM systems are calibrated per manufacturer’s instructions using SMBG (capillary glucose).12-15,19 Other studies have used venous glucose values for calibration of CGM.17,18 In light of the unavailability of interstitial reference glucose values, use of venous glucose values for CGM calibration seems to be the most rational option, especially since glucose is then obtained from the same compartment for calibration and assessment of the CGM device. Nonetheless, it has been noted17,18 that external validity of these data are limited since patients generally use capillary glucose for calibration in daily life and venous glucose content can differ significantly from capillary glucose.12,22,27 Previous studies have described differences in measured accuracy of CGM devices when capillary or venous glucose was used as the reference,16,19 but it should be noted that venous and capillary samples were not taken simultaneously and were gathered in a different environments (at home versus CRC), and no consistent relationship was found.16
MARD is generally used to estimate accuracy in studies evaluating CGM devices,12-19 and thus was used as the primary outcome in the current study. It is possible that the consistently lower venous glucose levels found in all glycemic ranges explain the lower MARD found when capillary glucose levels were used as the reference. It is possible that entering a calibration value into the CGM system that differs from the value used as the reference could account for such a difference. Furthermore, this finding was supported by the fact that the correlation coefficient did not differ for capillary versus venous glucose concentrations in relation to CGM values, which is used to evaluate whether a consistent relationship exists between reference and CGM values. The large difference found in MARD (16.6% vs 31.8%) in the hypoglycemic range for capillary and venous values is likely to be, at least partly, due to 2 factors. First, capillary and venous samples differ to the largest extent in this glucose range. Second, MARD is a relative measure, which implies that a certain absolute difference in accuracy or variables that affect accuracy will have a greater impact in this glycemic range. The same rationale applies to the difference found in MARD between venous and capillary reference glucose in the case of ongoing decrease of glucose concentrations. The average glucose level is likely lower in this case than when the glucose concentration is stable or when increasing, consequently the difference found in glucose between capillary and venous glucose will likely more easily translate into a significant difference in accuracy expressed as MARD.
There are several implications of our findings. Although using venous glucose for calibration instead of capillary glucose might prevent inaccurate CGM accuracy assessment since then glucose is obtained from the same compartment for calibration and assessment of the CGM device, using capillary reference might still be more appropriate. First, because using venous calibration would limit the external validity of the data since it would differ from the procedure used in clinical practice. Second, because using venous samples for calibration limits CGM evaluation to in-clinic sessions while at home evaluation provides the opportunity to evaluate CGM accuracy over the entire life-time of a sensor during circumstances according to normal use. Thus using capillary glucose values in evaluations of CGM accuracy should be considered as an alternative to venous reference. Unfortunately this comes at a trade-off of longer sampling interval due to practical and ethical constraints. Consequently if venous samples are used as the reference and capillary values are used to calibrate, our results seem to suggest that it is essential to have capillary glucose values as a complement, at least in the hypoglycemic range. Moreover, as a complementary metric to MARD, MAD may be useful in the hypoglycemic range since it is not a relative measure to the low glucose concentration per se. One could also advise to use capillary values as reference when investigating capillary calibrated CGM accuracy in a setting with high rate of change. An earlier study20 has found substantially higher MARD for rapidly changing glucose concentrations (<–3 mg/dL/min or ≥+3 mg/dL/min), and slightly higher MARD for slowly decreasing glucose concentrations (–1 to 0 mg/dL/min) than for slowly increasing glucose concentrations (0 to 1 mg/dL/min).
To further evaluate CGM accuracy, it should also be noted that in healthy volunteers it has been shown that the difference between capillary and venous glucose levels was small in the fasting state but increased to a maximal difference 2 hours postprandially.27 Although higher capillary than venous glucose levels have previously been reported,2,12,21,27 there are limited data in the hypoglycemic range. The fact that the capillary and venous glucose levels differed both at stable and fluctuating levels has also been reported in another study.21
A strength of the present study is the sole use of HemoCue measurement system measuring both capillary and venous samples by means of the same method. The HemoCue glucose measurement system is the system on the market where each lot of reagents is calibrated using an absolute isotope-dilution mass spectrometry method which makes it a true measurement method for glucose concentrations.23 Limitations of the present study is that since bias and imprecision may vary between laboratory methods for measuring glucose concentrations and our study used the HemoCue measurement system, the findings should be replicated in similarly designed studies using other laboratory methods for measuring glucose concentrations. Moreover, there were relatively few measurements of capillary and venous glucose levels within each studied glucose range, thus our results need to be confirmed in these ranges.
Conclusions
In conclusion, our findings support the assertion that it is essential to use the same type of sample, either venous or capillary, for calibration and reference purposes to assess the imprecision and bias of CGM devices, especially in the hypoglycemic range. Capillary glucose levels were significantly higher than venous in all glycemic ranges including hypoglycemia.
Acknowledgments
We want to thank Agneta Ruderfeldt, diabetes research nurse, for assistance in the research project.
Footnotes
Abbreviations: ARD, absolute relative difference; CGM, continuous glucose monitoring; CI, confidence interval; CRC, clinical research center; CSII, continuous insulin infusion for insulin delivery; MAD, mean absolute difference; MARD, mean absolute relative difference; MDI, multiple daily insulin injections; SD, standard deviations; SMBG, self-monitoring of blood glucose; T1DM, type 1 diabetes mellitus; YSI, Yellow Springs Instrument.
Declaration of Conflicting Interests: The author(s) declared the following potential conflicts of interest with respect to the research, authorship, and/or publication of this article: JIJ has received research funding and/or participated on an advisory board for Dexcom, Medtronic MiniMed, Animas, Edwards Lifesciences, Echo Therapeutics, Becton Dickinson, Thermalin Diabetes, and GluMetrics. JIJ is a founder, equity owner, and advisory board member for Capillary Biomedical. ET is member of the board of MediRox AB. DK is a consultant for Google, Insulin, Lifecare, Novartis, Roche, Sanofi, Tempramed and Voluntis, and is also receiving research grants from Eli Lilly, Intarcia, Novo, and Oramed. DK is a stockholder in Tempramed. JHDV or institutions he is associated with have received research grants or support from Dexcom, Glumetrics, Medtronic, Senseonics, received speaker fees from Dexcom, Eli Lilly, Novo Nordisk, Roche and participated in advisory boards for Eli Lilly, Johnson&Johnson, Novo Nordisk, Roche. ML has received research grants from AstraZeneca, Dexcom and Novo Nordisk, been a consultant or received honoraria from Medtronic, Eli Lilly, Pfizer, Abbot Scandinavia, Bayer, Novo Nordisk and Rubin Medical. ML has participated in advisory boards for Novo Nordisk.
Funding: The author(s) disclosed receipt of the following financial support for the research, authorship, and/or publication of this article: Data collection was supported by grants from the following: Novo Nordisk Foundation, the Swedish state, under the agreement between the Swedish government and the county councils concerning economic support of research and education of doctors (ALF-agreement); the Swedish Society for Physicians; and the Health & Medical Care Committee of the Regional Executive Board, Region Vastra Gotaland, Sweden.
References
- 1. Diabetes Control and Complications Trial Study Group. The effect of intensive treatment of diabetes on the development and progression of long-term complications in insulin-dependent diabetes mellitus. N Engl J Med. 1993;329:977-986. [DOI] [PubMed] [Google Scholar]
- 2. Nathan DM, Cleary PA, Backlund JY, et al. Intensive diabetes treatment and cardiovascular disease in patients with type 1 diabetes. N Engl J Med. 2005;353:2643-2653. [DOI] [PMC free article] [PubMed] [Google Scholar]
- 3. Lind M, Bounias I, Olsson M, et al. Glycaemic control and incidence of heart failure in 20,985 patients with type 1 diabetes: an observational study. Lancet. 2011;378:140-146. [DOI] [PubMed] [Google Scholar]
- 4. Lind M, Svensson AM, Kosiborod M, et al. Glycemic control and excess mortality in type 1 diabetes. N Engl J Med. 2014;371(21):1972-1982. [DOI] [PubMed] [Google Scholar]
- 5. Livingstone SJ, Levin D, Looker HC, et al. Estimated life expectancy in a Scottish cohort with type 1 diabetes, 2008-2010. JAMA. 2015;6;313(1):37-44. [DOI] [PMC free article] [PubMed] [Google Scholar]
- 6. Pickup JC, Freeman SC, Sutton AJ. Glycaemic control in type 1 diabetes during real time continuous glucose monitoring compared with selfmonitoring of blood glucose: meta-analysis of randomised controlled trials using individual patient data. BMJ. 2011;7;343:d3805. [DOI] [PMC free article] [PubMed] [Google Scholar]
- 7. Battelino T, Conget I, Olsen B, et al. The use and efficacy of continuous glucose monitoring in type 1 diabetes treated with insulin pump therapy: a randomised controlled trial. Diabetologia. 2012;55(12):3155-3162. [DOI] [PMC free article] [PubMed] [Google Scholar]
- 8. Langendam M, Luijf YM, Hooft L, Devries JH, Mudde AH, Scholten RJ. Continuous glucose monitoring systems for type 1 diabetes mellitus. Cochrane Database Syst Rev. 2012;1:CD008101. [DOI] [PMC free article] [PubMed] [Google Scholar]
- 9. Kovatchev BP. Hypoglycemia reduction and accuracy of continuous glucose monitoring. Diabetes Technol Ther. 2015;17:530-533. [DOI] [PMC free article] [PubMed] [Google Scholar]
- 10. Kovatchev BP, Patek SD, Ortiz EA, Breton MD. Assessing sensor accuracy for non adjunct use of continuous glucose monitoring. Diabetes Technol Ther. 2015;17(3):177-186. [DOI] [PMC free article] [PubMed] [Google Scholar]
- 11. Luijf YM, Avogaro A, Benesch C, et al. Continuous glucose monitoring accuracy results vary between assessment at home and assessment at the clinical research center. J Diabetes Sci Technol. 2012;6(5):1103-1106. [DOI] [PMC free article] [PubMed] [Google Scholar]
- 12. Matuleviciene V, Joseph J, Andelin M, et al. A clinical trial of the accuracy and treatment experience of the Dexcom G4 Sensor (Dexcom G4 System) and Enlite Sensor (Guardian REAL-Time System) tested simultaneously in ambulatory patients with type 1 diabetes. Diabetes Technol Ther. 2014;16(11):759-767. [DOI] [PMC free article] [PubMed] [Google Scholar]
- 13. Christiansen M, Bailey T, Watkins E, et al. A new-generation continuous glucose monitoring system: improved accuracy and reliability compared with a previous-generation system. Diabetes Technol Ther. 10; 2013;15(10):881-888. [DOI] [PMC free article] [PubMed] [Google Scholar]
- 14. Leelarathna L, Nodale M, Allen JM, et al. Evaluating the accuracy and large inaccuracy of two continuous glucose monitoring systems. Diabetes Technol Ther. 2013;15(2):143-149. [DOI] [PMC free article] [PubMed] [Google Scholar]
- 15. Keenan DB, Mastrototaro JJ, Zisser H, et al. Accuracy of the Enlite 6-day glucose sensor with guardian and Veo calibration algorithms. Diabetes Technol Ther. 2012;14(3):225-231. [DOI] [PubMed] [Google Scholar]
- 16. Kropff J, Bruttomesso D, Doll W, et al. Accuracy of two continuous glucose monitoring systems: a head-to-head comparison under clinical research centre and daily life conditions. Diabetes Obes Metab. 2015;17(4):343-349. [DOI] [PMC free article] [PubMed] [Google Scholar]
- 17. Kovatchev B, Anderson S, Heinemann L, Clarke W. Comparison of the numerical and clinical accuracy of four continuous glucose monitors. Diabetes Care. 2008;31(6):1160-1164. [DOI] [PMC free article] [PubMed] [Google Scholar]
- 18. Damiano ER, McKeon K, El-Khatib FH, Zheng H, Nathan DM, Russell SJ. A comparative effectiveness analysis of three continuous glucose monitors: the Navigator, G4 Platinum, and Enlite. J Diabetes Sci Technol. 2014;8(4):699-708. [DOI] [PMC free article] [PubMed] [Google Scholar]
- 19. Luijf YM, Mader JK, Doll W, et al. Accuracy and reliability of continuous glucose monitoring systems: a head-to-head comparison. Diabetes Technol Ther. 2013;15(8):721-726. [DOI] [PMC free article] [PubMed] [Google Scholar]
- 20. Pleus S, Schoemaker M, Morgenstern K, et al. Rate-of-change dependence of the performance of two CGM systems during induced glucose swings. J Diabetes Sci Technol. 2015;9:801-807. [DOI] [PMC free article] [PubMed] [Google Scholar]
- 21. Kempe K, Price D, Ellison J, et al. Capillary and venous blood glucose concentrations measured during intravenous insulin and glucose infusion: a comparison of steady and dynamic states. Diabetes Technol Ther. 2009;11(10):669-674. [DOI] [PubMed] [Google Scholar]
- 22. Kuwa K, Nakayama T, Hoshino T, Tominaga M. Relationships of glucose concentrations in capillary whole blood, venous whole blood and venous plasma. Clin Chim Acta. 2001;307(1-2):187-192. [DOI] [PubMed] [Google Scholar]
- 23. Hannestad U, Lundblad A. Accurate and precise isotope dilution mass spectrometry method for determining glucose in whole blood. Clin Chem. 1997;43(5):794-800. [PubMed] [Google Scholar]
- 24. Snježana K, van Meerker A, van der Linden J, Stiphout T, Wulkan R. Validation of a new generation POCT glucose device with emphasis on aspects important for glycemic control in the hospital care. Clin Chem Lab Med. 2012;50(9)1573-1580. [DOI] [PubMed] [Google Scholar]
- 25. Hodges JL, Lehmann EL. Estimates of location based on rank tests. Ann Math Stat. 1963;34:598-611. [Google Scholar]
- 26. Senn S. Cross-over trials in statistics in medicine: the first “25” years. Stat Med. 2006;25(20):3430-3442. [DOI] [PubMed] [Google Scholar]
- 27. Liu D, Moberg E, Kollind M, Lins PE, Adamson U, Macdonald IA. Arterial, arterialized venous, venous and capillary blood glucose measurements in normal man during hyperinsulinaemic euglycaemia and hypoglycaemia. Diabetologia. 1992;35(3):287-290. [DOI] [PubMed] [Google Scholar]