Abstract
DNA nanomachines are becoming useful tools for molecular recognition, imaging, and diagnostics and have drawn gradual attention. Unfortunately, the present application of most DNA nanomachines is limited in vitro, so expanding their application in organism has become a primary focus. Hence, a novel DNA nanomachine named t-switch, based on the DNA duplex–triplex transition, is developed for monitoring the intracellular pH gradient. Our strategy is based on the DNA triplex structure containing C+-G-C triplets and pH-dependent Förster resonance energy transfer (FRET). Our results indicate that the t-switch is an efficient reporter of pH from pH 5.3 to 6.0 with a fast response of a few seconds. Also the uptake of the t-switch is speedy. In order to protect the t-switch from enzymatic degradation, PEI is used for modification of our DNA nanomachine. At the same time, the dynamic range could be extended to pH 4.6–7.8. The successful application of this pH-depended DNA nanomachine and motoring spatiotemporal pH changes associated with endocytosis is strong evidence of the possibility of self-assembly DNA nanomachine for imaging, targeted therapies, and controllable drug delivery.
DNA is an attractive and useful material for constructing functional architectures.1−9 A large number of nanomachines based on the DNA scaffold, such as the DNA tweezer, walker, and motors10−13 have been reported. Design of novel DNA nanomachines has attracted particularly attention because of their many potential applications in nanoelectronic devices, biosensors, molecular computation, and smart materials.14−17 On the basis of different response mechanisms including conformation changes, strand displacement, and enzymatic activity, a variety of DNA structures, such as i-motif, G-quadruplex, and triplex, have been used as building blocks for constructing nanomachines.18−20 Each of these DNA nanomachines can respond to specific triggers and convert to an output due to the conformation changes. Owing to the specificity and biocompatibility of DNA nanomachine, it is highly interesting to fabricate DNA nanomachines into powerful biosensors that can monitor chemical stimuli in vitro and in vivo. However, applications of DNA nanomachines in vivo are difficult to exploit owing to the difficulty in cellular internalization of negatively charged DNA.21−25
pH plays a critical role in living cells, and its biological significance has attracted much attention. Intracellular pH (pHi) changes, especially in organelles, are connected with many physiological processes such as internalization pathways26,27 and muscle contraction.28,29 On the other hand, abnormal pHi values are associated with inappropriate cell function, growth, cell proliferation, and apoptosis.30−36 Besides, some common diseases, such as cancer37 and Alzheimer’s disease,38 are characterized by pHi changes in biological events. As a consequence, monitoring the pHi gradient is highly important but remains a great challenge. Hence, many pH-sensitive DNA nanomachines and non-DNA-based pH sensors, including organic fluorescent probes, nanosensors, and fluorescent proteins, have been reported to be used in vivo. However, these non-DNA-based pH sensors have their certain defects. For instance, some organic fluorescent probes39−43 suffer from complicated synthesis, bad biocompatibility, poor light stability, and high cytotoxicity. Nanosensors, constructed from quantum dots,44,45 polymers,46−52 metal nanoparticles,53−55 and carbon nanomaterials,56−58 are limited by the low loading rate of the dye, poor repeatability, and controversial cytotoxicity. Likewise, fluorescent proteins59,60 could only be expressed though complicated encoding, synthesis, and strict experiment operating. Therefore, these drawbacks may limit their application in cellular measurements. Compared with non-DNA-based pHi sensors, pH-sensitive DNA nanomachines show certain advantages.61−65 DNA is a kind of environmental friendly new material with stable physical and chemical properties. The synthetic of DNA sequence is simple, and it is convenient to modify. At the same time, based on accurate principle of complementary base pairing, design of DNA nanomachines is predictable and programmable. In a word, the DNA nanomachine is an ideal tool to detect pHi. However, although several pH-dependent DNA nanomachines66−69 have been reported, most of them can only be used in vitro. At present, the i-switch has been used in vivo, which is the first example of an autonomous DNA nanomachine that can respond to a specific molecular trigger in the living cell.70,71 Unfortunately, i-switch could only map pH changes on long time scales of a few minutes in vivo, which is unsuitable for monitoring instantaneous biological processes. Therefore, the design of DNA nanomachines which can be used in vivo for catching pH changes on short time scales is a challenge but desirable task.
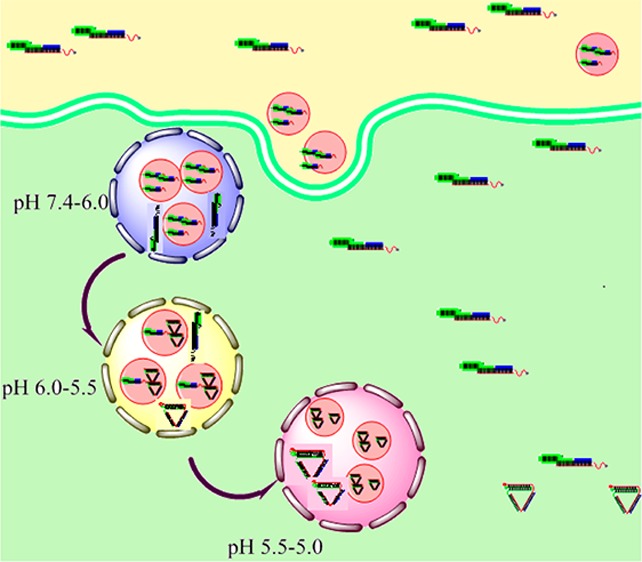
Here a novel DNA nanomachine based on DNA duplex–triplex transition (t-switch) is developed to monitor the pHi gradient. Our approach is based on the principle of a DNA triplex nanomachine containing C+-G-C triplets. A pH-dependent FRET is recorded during the duplex–triplex transition process,72,73 demonstrating that t-switch is an efficient pH sensor from pH 5.3 to 6.0 and could be uptaken by cells easily. Furthermore, to facilitate the endocytosis process74,75 and protect the t-switch from enzymatic degradation, PEI, a common cationic polymer for gene transfer, is used for packing the t-switch. Surprisingly, the dynamic responding range of the t-switch can be extended to 4.6–7.8 by complexing with PEI. Moreover, the t-switch could function autonomously inside living HepG2 cells to map and monitor intracellular pH changes after endocytosis.
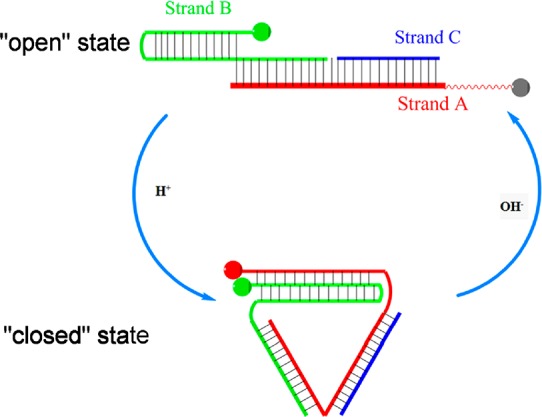
As the working principle shown in Scheme 1, the t-switch consists of three oligonucleotide strands A, B, and C, where B and C can hybridize with A, leaving a one-base gap. Both strands A and B have overhangs at the 5′ termini which are labeled with pH-insensitive dye Alexa-488 and Alexa-647, respectively. The cytosine (C) riched overhang of strand A is single-stranded, while the overhang of strand B is double-stranded which contains CG bases. At high pH as the “open state” of the t-switch, these two overhangs form an extended duplex conformation to separate the two fluorophores and avoid FRET happening. However, in acidic conditions, the single-stranded overhang of strand A will bind in a parallel orientation to the double-stranded overhang of strand B. Therefore, the C+-G-C triad structure will be formed to induce the triplex structure of the t-switch, yielding a “closed state” to bring two fluorophores into proximity. As a result, FRET could take place between the Alexa-488/647 FRET pair. Thus, the formation of the triplex and the exhibition of FRET signal could be sensitive to pH. Inspired by published work,66 we design the sequences of the t-switch, which are shown in Table S1 in the Supporting Information.
Scheme 1. Construction and Principle of t-Switch in the “Open” State (Low FRET) at High pH and in the “Closed” State (High FRET) at Low pH.
The fluorescence properties of the t-switch are first investigated as a function of pH to determine its pH responsive range (Figure 1a). With the decrease of the pH value, a gradual decrease of fluorescent intensity at 520 nm for donor fluorophore has been observed, while a new florescence peak appears at 665 nm for the acceptor fluorophore. Therefore, donor fluorescence decreases while acceptor fluorescence increases as a result of FRET, indicating the transition from the open to closed state of the t-switch upon the pH change. The plot of fluorescence ratios (D/A) of Alexa-488/647-labeled t-switch as a function of pH (Figure 1b) shows a sigmoid increase between pH 5.3 and 6.0 with a 4-fold ratio increase and the pKa value is determined to be 5.67 (the calculation is shown in the Supporting Information, Figure S2a). This makes it a good nanomachine to track fine pH changes associated with endosomal maturation.
Figure 1.
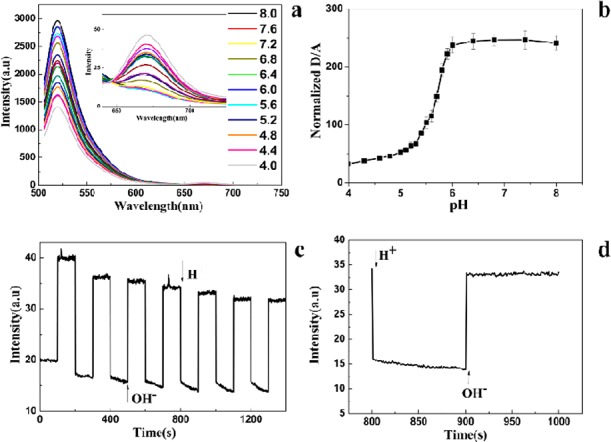
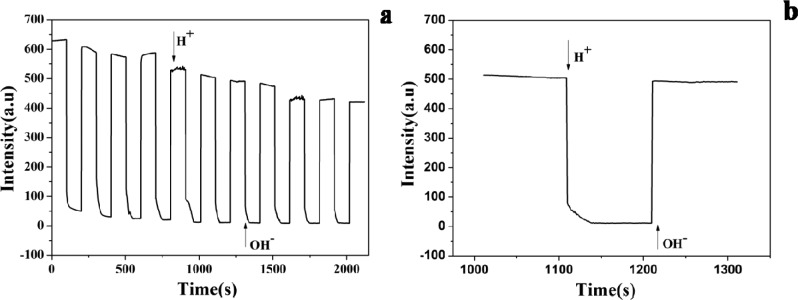
In vitro characterization of the t-switch. (a) Emission responses of the t-switch (80 nM) toward the pH change in PBS (20 mM). Inset: pH-dependent responses of emission between 640 and 750 nm. (b) Calibration curve of the t-switch showing normalized donor/acceptor (D/A) intensity (Alexa-488/Alexa-647) ratios. (c) Working cycling of the t-switch. Fluorescence intensity was monitored at 520 nm and excited at 488 nm while the solution pH value oscillated between 5.0 and 8.0. (d) Response time for the transition between the open and closed states. Addition of base and acid was shown by arrows.
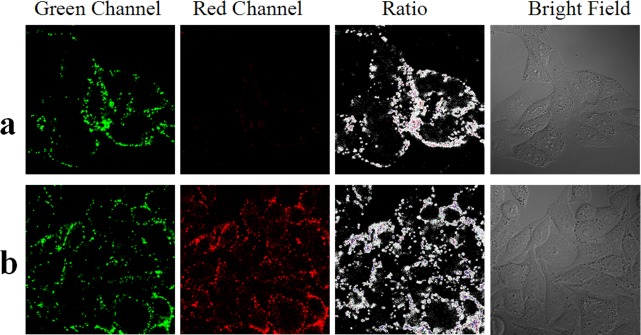
The in vivo performance of the t-switch is then evaluated by incubating the t-switch with cells. The 80 nM t-switch is added to cultured HepG2 cells. After incubating for 10 min at 37 °C, cells are washed 3 times with PBS buffer. The confocal images are shown in Figure 2a. The uptake of the t-switch by living cells is speedy, and some t-switches are distributed in lysosomes (Figure S4 in the Supporting Information). In the green channel, the fluorescence intensity of Alex488 is variable within single cells consistent with uneven intracellular pH distributions while the fluorescence signal is very weak in the red channel (Alex 647). It may be that DNA nanomachines are partly internalized through anion channels and entered into early endosomes which will become lysosomes after a series of physiological changes.70 During this process, pH value will deceases from 7.4 inside early endosomes to 5.0 in the lysosomes (Figure S5 in the Supporting Information),76−79 and t-switches will be in two stages with different pH values. In early endosomes, the pH is 7.4–6.0 while C+-G-C triad structure only formed when the pH was below 6.0. So t-switches are in the “open” state and FRET could not happen. On the other hand, when early endosomes become late endosomes and lysosomes, where the pH is below 6.0, t-switches are in the “close” state and signal in the red channel is observed in Figure 2a. Moreover, it becomes brighter as time goes on (enlarged images of the red channel are shown in Figure S6 in the Supporting Information). This means an increasing number of t-switches turn to the “close” state as endosomes become lysosomes. Besides the reason above, we think that the elaborate enzyme system in lysosomes may affect the stability of the t-switch. This could also lead to weak signal in the red channel. Then, lactate buffer (pH 6.0) and 5-(N,N-dimethyl)amiloride (DMA), an inhibitor of Na+/H+ exchanger, are added to induce the decrease of intracellular pH.80−82 Upon the treatment, the reduction of pH value induces the formation of a “close” state, resulting in bright fluorescence signals in the red channel (Figure 2b). At the same time, there are obvious changes of fluorescence intensity in both the green channel and red channel (Figure S7 in the Supporting Information). Partial enlarged ratiometric images of acidation HepG2 cells are shown in Figure S8 in the Supporting Information. This pH change caused by acidizing is confirmed by using BCECF-AM as a pH indicator and the result are shown in Figure S9 in the Supporting Information. More confocal images of RAW264.7 cells are mentioned in the Supporting Information (Figure S10). Although the cellular colocalization of the t-switch and Lyso-Tracker Red shows that the uptake of the t-switch is speedy, we suspect that it is hard for the t-switch to remain stably inside cells according to the weaker signal in the red channel in Figure 2a. So how to improve it is stability is the crux of the matter.
Figure 2.
Confocal fluorescence images of the t-switch in live HepG2 cells. (a) Imaging of t-switch in normal cells. (b) Imaging of t-switch in cells after acidizing.
Lysosomes are important acid organelles in cells. Abnormal functions of lysosomes are associated with many diseases such as silicosis, rheumatoid arthritis (RA), and all kinds of lysosomal storage disorder. Meanwhile, the relationship of lysosomes and tumor increasingly aroused people’s concern. Therefore, monitoring pH changes between different functional phases of lysosomes is of great significance. However, there are large amounts of DNase in lysosomes and pose a threat to the stability of the t-switch. We think this may be the reason why our t-switch could not remain stably in cells. Therefore, we explore the idea of polyplex to facilitate cell internalization of our pH-sensitive DNA nanodevice. PEI facilitates the internalization of DNA by complexing with DNA through electrostatic interactions and also protects DNA from enzymatic degradation.83,84 After mixing with PEI at an N/P ratio of 1:3, DNA is efficiently condensed into particle-like complexes with sizes ranging from 20 to 50 nm (Figure S3b in the Supporting Information). The PEI/DNA complex did not affect the function of the t-switch, as shown in Figure 3a. Surprisingly, the response pH of the t-switch is extended to pH 4.6–7.8 with the pKa value of 6.53 (Figure S2b in the Supporting Information), most likely due to the pH sponge effect of PEI. The wide range is composed with two ranges: pH 4.6–5.8 and pH 5.8–7.8. Meanwhile, forming a complex with PEI did not influence the fast response of the t-switch to pH (Figure 4b).
Figure 3.
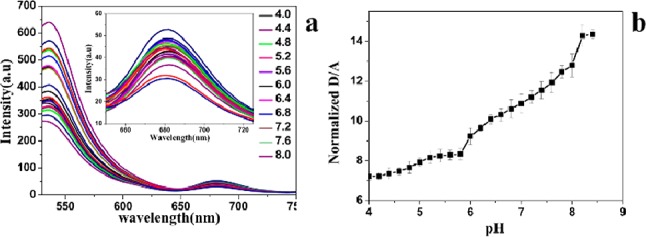
In vitro characterization of the PEI/DNA complexes. (a) pH-dependent emission spectra changes of the PEI/DNA complex (20 nM) in PBS at 25 °C. (b) The donor/acceptor (D/A) intensity (Alexa-488/Alexa-647) ratios changes in vitro.
Figure 4.
(a) Working cycling of PEI/DNA complexes. Fluorescence intensity was monitored at 520 nm by excitation at 488 nm while the solution pH value oscillated between 5.0 and 8.0. (b) Response time for the formation of the open and closed states. Addition of base and acid was shown by arrows.
The stability of the t-switch in living cells is very important for application in vivo. Therefore, in order to prove our conjecture, we imitate ambiance of the lysosomes and investigate the stability of the t-switch in different conditions. As shown in Figure 5, its stability in the presence of DNase II is greatly enhanced after forming a complex with PEI. A sharp decrease of fluorescence intensity appears when DNase II is added to the naked t-switch. In contrast, only a slight decrease of fluorescence is observed within 330 min for the PEI/DNA complex. Taken together, the above observations show that PEI not only extends the pH working range for the t-switch but also offers protection capability against cellular enzymes. These experimental results also prove our hypothesis on the second reason why the fluorescence signal is weak in the red channel of Figure 2a. In lysosomes, construction of some t-switches will be destroyed because of the high concentration and activity of DNase II.
Figure 5.
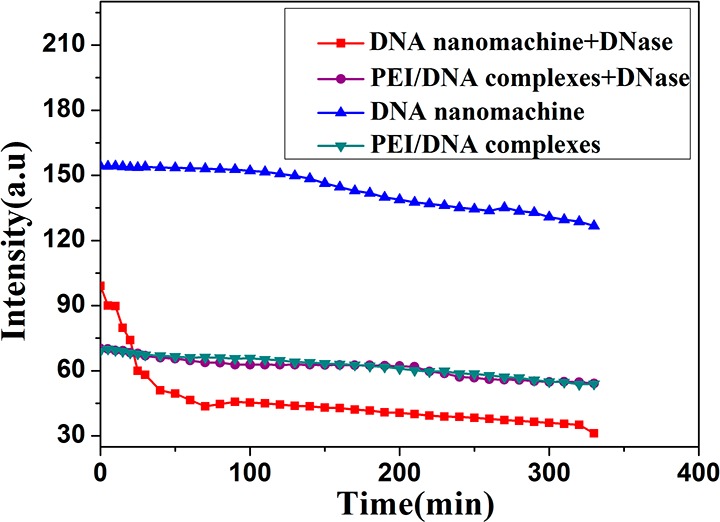
Experiments aimed at understanding the stability of the t-switch. Fluorescence intensities at 675 nm in the presence or absence of DNase II in the t-switch or PEI/DNA complexes, respectively.
Furthermore, HepG2 cells are incubated with the PEI/DNA complex (20 nM) for 20 min at 37 °C and then washed three times with PBS buffer. The PEI/DNA complex can enter cells by the endocytosis pathway. As PEI//DNA complexes in endosomes where the pH value is just in it’s dynamic range, there are some hotspots in the red channel (Figure 6) while the bare t-switch shows a weaker fluorescence signal in the same field (Figure 2a). The fluorescence changes along with time could be observed via monitoring hotspots in the red channel (Figure S12 in the Supporting Information). Partial enlarged ratiometric images of single HepG2 cell are shown in Figure S11 in the Supporting Information.
Figure 6.

Confocal fluorescence images of the PEI/DNA complex in HepG2 cells.
Confocal experiments show that the t-switch could enter living HepG2 cells within 10 min while it is well-known that the uptake of naked DNA is difficult. In order to explain the fast uptake, we study the cellular internalization ability of the t-switch. Our t-switch and dye-labeled single-stranded DNA (strand A and strand B) are incubated with different cells, respectively. The confocal fluorescence images show that the t-switch could be assimilated easily by the testing cells, while it is difficult for strands A and B to internalize. We conjecture that the presence of nanostructure is crucial for efficient cellular internalization (Figure S13 in the Supporting Information). Besides, the internalization mechanism of the t-switch and PEI/DNA complex is further investigated by incubating them with HepG2 cells after inhibition of endocytosis by potassium depletion,85 respectively. The flow cytometric analysis results shown in Figures S14 and S15 in the Supporting Information indicate that after blocking the endocytosis pathway, delivery of PEI/DNA complexes is effectively inhibited, while the uptake of the naked t-switch is not affected. The data of the mean fluorescence intensity and the number of selected cells in different conditions are shown in Table S2 in the Supporting Information. Our researchers indicate that the t-switch may enter living cells through other internalization pathways. More details about their routes of entry still need be investigated.
In conclusion, we have demonstrated a FRET-based DNA nanomachine for fast-responding mapping pH changes in living cells. The as-designed t-switch is sensitive to pH between pH 5.3 to 6.0. Remarkably, it is on the time scales of a few seconds while other DNA nanomachines are on long time scales of a few minutes. The fast response speed makes it easy to catch pH changes associated with instantaneous biological processes on shorter time scales. Evidently, the t-switch shows excellent reversibility for several pH cycles, after repetitive addition of NaOH and HCl diluted the sample. More importantly, the t-switch can gain entrance to living cells without any transfection reagent in a few minutes. For stability and inducing endocytosis, PEI is used to form the PEI-DNA nanomachine complex. In addition to a wide dynamic range of pH 4.6–7.8, complexing with PEI could protect the t-switch from enzyme decomposition in endosomes and lysosomes. Therefore, the t-switch is expected to be used as a reporter of intracellular pH changes associated with biological processes due to its fast response, relative stability to enzyme, and wide dynamic range. The successful application of this pH-dependent DNA nanomachine and monitoring spatiotemporal pH changes associated with endocytosis could be useful for the future application of the self-assembled DNA nanomachine in the field of imaging, targeted therapies, and controllable drug delivery.
Experimental Section
DNA oligonucleotides purified by high-performance liquid chromatography (Strands A, B, and C) are purchased from Invitrogen. UV–vis absorption spectra are obtained on a PE-Lambda 35 UV–vis spectrophotometer with a quartz cuvette (path length = 1 cm). The pH measurements are made with a Sartorius basic pH-meter PB-10. Fluorescence measurements are taken on a Hitachi F-4600 fluorescence spectrometer, samples are excited at 488 nm, and emission is collected between 500 and 750 nm. Confocal images are taken on a confocal laser scanning biological microscope FV1000-LX81 Olympus. PEI, Ca-lactate, and DNase II are purchased from J&K Scientific Ltd. 5-(N,N-dimethyl)amiloride (DMA) is acquired from Sigma. All other reagents and chemicals used in this paper are obtained from commercial suppliers unless noted otherwise. The pH is adjusted to the desired values at room temperature with either HCl or NaOH. Lactate buffer (pH 6.0) is prepared according to published procedures.80
Acknowledgments
We would like to thank Dr. Hongying Jia in the Institute of Chemistry Chinese Academy of Sciences for enthusiastic help in the cytological experiments. We gratefully acknowledge financial support from the National Nature Science Foundation of China (Grants 21275018 and 21203008), Beijing National Laboratory for Molecular Sciences (BNLMS) (Grant 20140121), Research Fund for the Doctoral Program of Higher Education of China (RFDP) (Grant No. 20121101110049), the 111 Project (Grant B07012), the National Key Scientific Program of China (2011CB911000), NSFC grants (NSFC 21221003), and the National Institutes of Health (GM079359 and GM 111386) for financial support.
Supporting Information Available
Experimental details, Tables S1 and S2, and Figures S1–S15 as mentioned in text. The Supporting Information is available free of charge on the ACS Publications website at DOI: 10.1021/acs.analchem.5b01233.
The authors declare no competing financial interest.
Funding Statement
National Institutes of Health, United States
Supplementary Material
References
- Yang Y.; Zhou C.; Zhang T.; Cheng E.; Yang Z.; Liu D. Small 2012, 8 (4), 552–556. [DOI] [PubMed] [Google Scholar]
- Zhang X.; Servos M. R.; Liu J. J. Am. Chem. Soc. 2012, 134, 7266–7269. [DOI] [PubMed] [Google Scholar]
- Huang P. J.; Liu J. Small 2012, 8, 977–983. [DOI] [PubMed] [Google Scholar]
- Du Y.; Li B.; Wei H.; Wang Y.; Wang E. Anal. Chem. 2008, 80, 5110–5117. [DOI] [PubMed] [Google Scholar]
- Chen B.; Xiao Y.; Liu C.; Li C.; Leng F. Nucleic Acids Res. 2010, 38, 3643–3654. [DOI] [PMC free article] [PubMed] [Google Scholar]
- Lv L.; Guo Z.; Wang J.; Wang E. Curr. Pharm. Des. 2012, 18, 2076–2095. [DOI] [PubMed] [Google Scholar]
- Liu Y.; Ren J.; Qin Y.; Li J.; Liu J.; Wang E. Chem. Commun. 2012, 48, 802–804. [DOI] [PubMed] [Google Scholar]
- Wei H.; Li B.; Li J.; Wang E.; Dong S. Chem. Commun. 2007, 36, 3735–3737. [DOI] [PubMed] [Google Scholar]
- Krishnan Y.; Simmel F. C. Angew. Chem., Int. Ed. 2011, 50, 3124–3156. [DOI] [PubMed] [Google Scholar]
- Yurke B.; Turberfield A. J.; Mills A. P.; Simmel F. C.; Neumann J. L. Nature 2000, 406, 605–608. [DOI] [PubMed] [Google Scholar]
- Simmel F. C.; Yurke B. Phys. Rev. E 2001, 63, 041913/1–041913/5. [DOI] [PubMed] [Google Scholar]
- Simmel F. C.; Yurke B. Appl. Phys. Lett. 2002, 80, 883–885. [Google Scholar]
- Wang Z.; Elbaz J.; Willner I. Nano Lett. 2011, 11, 304–309. [DOI] [PubMed] [Google Scholar]
- Alberti P.; Bourdoncle A.; Sacca B.; Lacroix L.; Mergny J. L. Org. Biomol. Chem. 2006, 4, 3383–3391. [DOI] [PubMed] [Google Scholar]
- Bath J.; Turberfield A. J. Nat. Nanotechnol. 2007, 2, 275–84. [DOI] [PubMed] [Google Scholar]
- Liu H.; Liu D. Chem. Commun. 2009, 19, 2625–2636. [DOI] [PubMed] [Google Scholar]
- Zhou C.; Yang Z.; Liu D. J. Am. Chem. Soc. 2012, 134, 1416–1418. [DOI] [PubMed] [Google Scholar]
- Li J. W.; Tan W. Nano Lett. 2002, 2, 315–318. [Google Scholar]
- Wang Z.; Elbaz J.; Willner I. Nano Lett. 2011, 11, 304–309. [DOI] [PubMed] [Google Scholar]
- Thomas J. M.; Yu H.; Sen D. J. Am. Chem. Soc. 2012, 134, 13738–13748. [DOI] [PubMed] [Google Scholar]
- Seeman N. C. Trends Biochem. Sci. 2005, 30, 119–125. [DOI] [PMC free article] [PubMed] [Google Scholar]
- Liedl T.; Sobey T. L.; Simmel F. C. Nano Today 2007, 2, 36–41. [Google Scholar]
- Cutler J. I.; Auyeung E.; Mirkin C. A. J. Am. Chem. Soc. 2012, 134, 1376–1391. [DOI] [PubMed] [Google Scholar]
- Zhang K.; Hao L.; Hurst S. J.; Mirkin C. A. J. Am. Chem. Soc. 2012, 134, 16488–16491. [DOI] [PMC free article] [PubMed] [Google Scholar]
- Li J.; Pei H.; Zhu B.; Liang L.; Wei M.; He Y.; Chen N.; Li D.; Huang Q.; Fan C. ACS Nano 2011, 5, 8783–8789. [DOI] [PubMed] [Google Scholar]
- Miksa M.; Kornura H.; Wu R. Q.; Shah K. G.; Wang O. J. Immunol. Methods 2009, 342, 71–77. [DOI] [PMC free article] [PubMed] [Google Scholar]
- Kang S. W.; Lim H. W.; Seo S. W. Biomaterials 2008, 29, 1109–1117. [DOI] [PubMed] [Google Scholar]
- Yuli I.; Oplatka A. Science 1987, 235, 340–342. [DOI] [PubMed] [Google Scholar]
- Chesler M. Physiol. Rev. 2003, 83, 1183–1221. [DOI] [PubMed] [Google Scholar]
- Roos A.; Boron W. F. Physiol. Rev. 1981, 61, 296–434. [DOI] [PubMed] [Google Scholar]
- Perezsala D.; Colladoescobar D.; Mollinedo F. J. Biol. Chem. 1995, 270, 6235–6242. [DOI] [PubMed] [Google Scholar]
- Liang E.; Liu P. C.; Dinh S. Int. J. Pharm. 2007, 338, 104–109. [DOI] [PubMed] [Google Scholar]
- Kang S. W.; Lim H. W.; Seo S. W. Biomaterials 2008, 29, 1109–1117. [DOI] [PubMed] [Google Scholar]
- Itaka K.; Harada A.; Yamasaki Y. J. Gene Med. 2004, 6, 76–84. [DOI] [PubMed] [Google Scholar]
- Li D.; Li G.; Guo W. Biomaterials 2008, 29, 2776–2782. [DOI] [PubMed] [Google Scholar]
- Adie E. J.; Kalinka S.; Smith L. Biotechniques 2002, 33, 1152–1157. [DOI] [PubMed] [Google Scholar]
- Izumi H.; Torigoe T.; Ishiguchi H. Cancer Treat. Rev. 2003, 29, 541–549. [DOI] [PubMed] [Google Scholar]
- Davies T. A.; Fine R. E.; Johnson R. J. Biochem. Biophys. Res. Commun. 1993, 194, 537–543. [DOI] [PubMed] [Google Scholar]
- Lee M. H.; Park N.; Yi C.; Han J. H.; et al. J. Am. Chem. Soc. 2014, 136, 14136–14142. [DOI] [PMC free article] [PubMed] [Google Scholar]
- Galindo F.; Burguete M. I.; Vigara L.; Luis S. V.; Kabir N.; Gavrilovic J.; Russell D. A. Angew. Chem., Int. Ed. 2005, 44, 6504–6508. [DOI] [PubMed] [Google Scholar]
- Briggs M. S.; Bums D. D.; Cooper M. E.; Gregory S. J. Chem. Commun. 2000, 23, 2323–2324. [Google Scholar]
- Gareis T.; Huber C.; Wolfbeis O. S.; Daub J. Chem. Commun. 1997, 18, 1717–1718. [Google Scholar]
- Aigner D.; Freunberger S. A.; Wilkening M.; et al. Anal. Chem. 2014, 86, 9293–9300. [DOI] [PMC free article] [PubMed] [Google Scholar]
- Kim H. J.; Heo C. H.; Kim H. M. J. Am. Chem. Soc. 2013, 135, 17969–17977. [DOI] [PubMed] [Google Scholar]
- Wu Y.; Chakrabortty S.; Gropeanu R. A.; et al. J. Am. Chem. Soc. 2010, 132 (14), 5012–5014. [DOI] [PubMed] [Google Scholar]
- Ling D.; Park W.; Park S.; Lu Y.; Kim K. S.; et al. J. Am. Chem. Soc. 2014, 136, 5647–5655. [DOI] [PubMed] [Google Scholar]
- Gao F.; Chen X.; Ye Q.; et al. Microchim. Acta. 2011, 172, 327–333. [Google Scholar]
- Wang M.; Zhang D. Q.; Zhang G. X.; et al. Anal. Chim. 2008, 80 (16), 6443–6448. [DOI] [PubMed] [Google Scholar]
- Nayak S.; Lyon L. A. Angew. Chem., Int. Ed. 2005, 44 (47), 7686–7708. [DOI] [PubMed] [Google Scholar]
- Ma X.; Wang Y.; Zhao T.; Li Y.; Su L.; et al. J. Am. Chem. Soc. 2014, 136, 11085–11092. [DOI] [PMC free article] [PubMed] [Google Scholar]
- Yang L.; Li N.; Pan W.; Yu Z.; Tang B. Anal. Chem. 2015, 87, 3678–3684. [DOI] [PubMed] [Google Scholar]
- Patrick M. J.; Janjic J. M.; Teng H.; et al. J. Am. Chem. Soc. 2013, 135, 18445–18457. [DOI] [PMC free article] [PubMed] [Google Scholar]
- Tu F.; Lee D. J. Am. Chem. Soc. 2014, 136, 9999–10006. [DOI] [PubMed] [Google Scholar]
- Chen C.; Song G.; Ren J.; et al. Chem. Commun. 2008, 6149–6151. [DOI] [PubMed] [Google Scholar]
- He C.; Lu K.; Lin W. J. Am. Chem. Soc. 2014, 136, 12253–12256. [DOI] [PMC free article] [PubMed] [Google Scholar]
- Zheng X.; Hu P.; Cui Y.; Zong C.; et al. Anal. Chem. 2014, 86, 12250–12257. [DOI] [PubMed] [Google Scholar]
- Wang D.; Chen L. Nano Lett. 2007, 7 (6), 1480–1484. [DOI] [PubMed] [Google Scholar]
- Back J.; Shim M. J. Phys. Chem. B 2006, 110 (47), 23736–23741. [DOI] [PubMed] [Google Scholar]
- Liu R.; Liu L.; Liang J.; Wang Y.; et al. Anal. Chem. 2014, 86, 3048–3052. [DOI] [PubMed] [Google Scholar]
- Laricheva E. N.; Goh G. B.; Dickson A.; Brooks C. L. J. Am. Chem. Soc. 2015, 137, 2892–2900. [DOI] [PMC free article] [PubMed] [Google Scholar]
- Goh G. B.; Laricheva E. N.; Brooks C. L. J. Am. Chem. Soc. 2014, 136, 8496–8499. [DOI] [PMC free article] [PubMed] [Google Scholar]
- Liedl T.; Sobey T. L.; Simmel F. C. Nano Today 2007, 2 (2), 36–41. [Google Scholar]
- Yang Y.; Liu H. J.; Liu D. S. Process. Chem. 2008, 20 (2–3), 197–207. [Google Scholar]
- Nesterova I. V.; Nesterov E. E. J. Am. Chem. Soc. 2014, 136, 8843–8846. [DOI] [PubMed] [Google Scholar]
- Liu D.; Balasubramanian S. Angew. Chem., Int. Ed. 2003, 42, 5734–5736. [DOI] [PubMed] [Google Scholar]
- Yurke B.; Turberfield A. J.; Mills A. P.; Simmel F. C.; Neumann J. L. Nature 2000, 406, 605–608. [DOI] [PubMed] [Google Scholar]
- Chen Y.; Lee S. H.; Mao C. Angew. Chem., Int. Ed. 2004, 43, 5335–5338. [DOI] [PubMed] [Google Scholar]
- Nishioka H.; Liang X.; Kato T.; Asanuma H. Angew. Chem., Int. Ed. 2012, 51, 1165–1168. [DOI] [PubMed] [Google Scholar]
- Amodio A.; Zhao B.; Porchetta A.; Idili A.; et al. J. Am. Chem. Soc. 2014, 136, 16469–16472. [DOI] [PubMed] [Google Scholar]
- Chen G.; Liu D.; He C.; Gannett T. R.; et al. J. Am. Chem. Soc. 2015, 137, 3844–3851. [DOI] [PubMed] [Google Scholar]
- Modi S.; Swetha M. G.; Goswami D. Nat. Nanotechnol. 2009, 4, 325–330. [DOI] [PubMed] [Google Scholar]
- Surana S.; Bhat J. M.; Koushika S. P.; Krishnan Y. Nat. Commun. 2011, 2, 1340. [DOI] [PubMed] [Google Scholar]
- Lee J. S.; Latimer L. J. P.; Haug B. L.; Pulleyblank D. E.; Skinner D. M.; Burkholder G. D. Gene 1989, 82, 191–199. [DOI] [PubMed] [Google Scholar]
- Vasquez K. M.; Glazer P. M. Q. Rev. Biophys. 2002, 35, 89–107. [DOI] [PubMed] [Google Scholar]
- Bettinger T.; Remy J. S.; Erbacher P. Bioconjugate Chem. 1999, 10, 558–561. [DOI] [PubMed] [Google Scholar]
- Blessing T.; Kursa M.; Holzhauser R.; Kircheis R.; Wagner E. Bioconjugate Chem. 2001, 12, 529–537. [DOI] [PubMed] [Google Scholar]
- Stenmark H. Nat. Rev. Mol. Cell Biol. 2009, 10 (8), 513–525. [DOI] [PubMed] [Google Scholar]
- Lafourcade C.; Sobo K.; Kieffer-Jaquinod S.; Garin J.; et al. PLoS One 2008, 3 (7), e2758. [DOI] [PMC free article] [PubMed] [Google Scholar]
- Rink J.; Ghigo E.; Kalaidzidis Y.; Zerial M. Cell 2005, 122 (5), 735–749. [DOI] [PubMed] [Google Scholar]
- Mullock B. M.; Bright N. A.; Fearon C. W.; Gray S. R.; Luzio J. P. J. Cell Biol. 1998, 140 (3), 591–601. [DOI] [PMC free article] [PubMed] [Google Scholar]
- Kaba N. K.; Schultz J.; Law F. Y. Am. J. Physiol. 2008, 295, 1454–1463. [Google Scholar]
- Rich I. N.; Worthington-White D.; Garden O. A.; Musk P. Blood 2000, 95 (4), 1427–1434. [PubMed] [Google Scholar]
- Mirossay L.; Mirossay A.; Kocisová E.; Radváková I.; Miskovský P.; Mojzis J. Physiol. Res. 1999, 48 (2), 135–141. [PubMed] [Google Scholar]
- Demeneix B.; Behr J. P. Adv. Genet. 2005, 53, 217–230. [PubMed] [Google Scholar]
- Hou S.; Ziebacz N.; Wieczorek S. A.; Kalwarczyk E.; Sashuk V.; Kalwarczyk T.; Kaminski T. S.; Holyst R. Soft Matter 2011, 7, 6967–6972. [Google Scholar]
- Shigdar S.; Lin J.; Yu Y.; Pastuovic M.; Wei M.; Duan W. Cancer Sci. 2011, 102, 991–998. [DOI] [PubMed] [Google Scholar]
Associated Data
This section collects any data citations, data availability statements, or supplementary materials included in this article.


