Abstract
Tracking of fluorescently labeled chromosomal loci in live bacterial cells reveals a robust scaling of the mean square displacement (MSD) as τ0.39. Brownian dynamics simulations show that this anomalous behavior cannot be fully accounted for by the classic Rouse or reptation models for polymer dynamics. Instead, the observed motion arises from the characteristic relaxation of the Rouse modes of the DNA polymer within the viscoelastic environment of the cytoplasm. To demonstrate these physical effects, we exploit our general analytical solution of the subdiffusive scaling for a monomer in a polymer embedded in a viscoelastic medium. The time-averaged and ensemble-averaged MSD of chromosomal loci exhibit ergodicity, and the velocity autocorrelation function is negative at short time lags. These observations are most consistent with fractional Brownian motion and rule out a continuous time random walk model as an explanation for anomalous motion in vivo.
Subdiffusive motion, for which the mean square displacement [MSD, 〈(R→(τ) − R→(0))2〉] scales as τα, where 0 < α < 1 [1], has been observed in vivo for a variety of tracer particles in both prokaryotes [2] and eukaryotes [3]. In vitro, particles moving in actin networks [4] and crowded dextran solutions [5] exhibit scaling laws with α ≈ 0.75, which closely agree with in vivo measurements. These experiments demonstrate that crowding alone, especially in combination with elastic elements, is sufficient to give rise to subdiffusive motion. However, the underlying mechanism(s) for subdiffusive motion in vivo is still unknown.
There are three prominent physical models for subdiffusion, each corresponding to a distinct potential cellular mechanism. First is the continuous time random walk (CTRW) [6]. If a particle diffusing through the cytoplasm encounters a binding partner, then it will pause for a period of time before dissociating and diffusing away. Multiple binding events with a range of rate constants generate long tails in the waiting time distribution, leading to subdiffusive behavior [7]. Broad distributions in waiting time (or jump length) are a hallmark of the CTRW. Second, cytoskeletal networks impose obstacles around which diffusing particles must navigate. If the obstacle concentration is high enough, obstructed diffusion (OD) becomes subdiffusive [8]. Finally, macromolecular crowding and the presence of elastic elements, such as nucleic acids and cytoskeletal filaments, give the cytoplasm viscoelastic properties. As a particle moves through this medium, the cytoplasm “pushes back”, creating long-time correlations in the particle’s trajectory. This memory leads to subdiffusive behavior that can be modeled by fractional Brownian motion (fBm) [9].
Despite their distinct molecular origins for subdiffusive motion in the cell, CTRW, OD and fBm generate similar scaling laws for long-time, ensemble-averaged behavior. Thus, other measures, such as ergodicity, are needed to distinguish among these models [10–12].
In this paper, we use fluorescently labeled chromosomal loci and RNA-protein particles as probes to explore the mechanisms underlying subdiffusive motion in live Escherichia coli cells. We find that both polymer and particle trajectories are ergodic, with negative velocity autocorrelations. These results allow us to rule out a CTRW mechanism in favor of fBm. Our analytical results for a generalized fBm Rouse model [13] exhibit a monomer MSD that has an intermediate time scaling that is one half that of an isolated particle in the same medium, which is consistent with our experimental observations. Thus, the dynamic behavior of both chromosomal loci and RNA-protein particles within living bacterial cells can be explained by the physical properties of their viscoelastic environment.
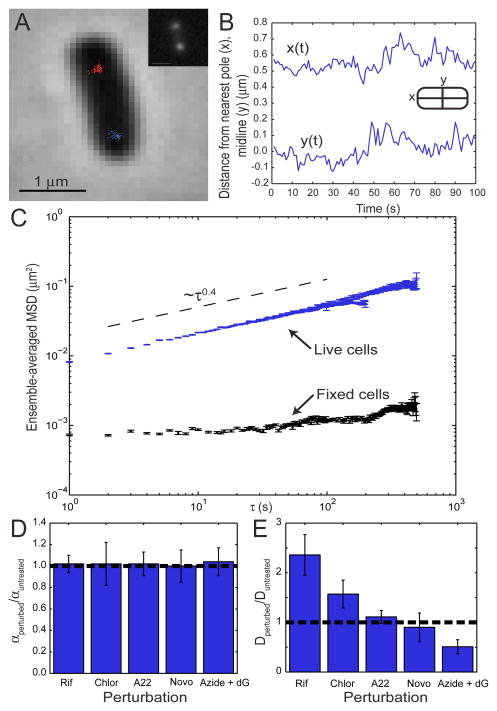
We use time-lapse fluorescence microscopy to follow the movement of chromosomal loci, visualized with the GFP-ParB/parS detection system [14], over time periods ranging from 1 to 103 s. Unlike the rapid, directed motion seen during chromosome segregation [14], loci appear to jiggle in place between segregation events (Fig. 1A, B), as observed previously in both Vibrio cholerae [15] and E. coli [16].
FIG. 1.
Motion of chromosomal loci in E. coli cells. (A) Phase image overlayed with positions of two 84′ loci tracked for 100 frames; inset shows fluorescence image of same cell. (B) Temporal trajectories along the cells long (x) and short (y) axes for the blue locus in panel A. (C) The ensemble-averaged MSD for both live and fixed cells. Error bars are the standard error of the mean for all measurements at each time interval. (D, E) Histograms displaying the fold-change in α and the apparent diffusion coefficient Dapp upon biological perturbations (Rif − rifampin, Chlor − chloramphenicol, Novo − novobiocin, Azide + dG − azide and deoxyglucose).
To analyze this motion, we calculate the ensemble-averaged MSD as a function of time interval τ and find a surprisingly robust scaling law across three decades of time, such that MSD ~ τ0.39±0.04 (Fig. 1C). Locus dynamics in cells fixed with formaldehyde give an estimate of ~0.027 μm for our measurement precision (Fig. 1C). Furthermore, analysis of simulated data with a range of signal-to-noise ratios confirm that the observed subdiffusion is well beyond this experimental error (Supp. Fig. 1). The same scaling law is observed for six loci distributed around the E. coli chromosome, for four loci around the Caulobacter crescentus chromosome (using a different detection system), and for a locus on the E. coli RK2 plasmid (Table I). Biological perturbations such as treatment with antibiotic drugs have no affect on α (Fig. 1D), though they significantly change the magnitude of the apparent diffusion coefficient Dapp (Fig. 1E). The robustness of α suggests that it arises from a physical, rather than biological, phenomenon. Moreover, the discrepancy with subdiffusive scaling exponents observed for particles in vivo (0.39 for chromosomal loci versus 0.70 for RNA-protein particles [2]) is likely due to the additional physical forces experienced by a locus (monomer) embedded within a DNA polymer.
TABLE I.
Robust scaling observed for loci at multiple positions around the chromosome of two bacterial species and an extrachromosomal plasmid. Mean ± standard deviation of α for ensemble-averaged MSD over multiple datasets.
| Species | Locus | α | # loci | # datasets |
|---|---|---|---|---|
| E. coli | 84′ | 0.39±0.04 | 16739 | 32 |
| E. coli | 21′ | 0.35±0.02 | 4906 | 7 |
| E. coli | 34′ | 0.43±0.05 | 1416 | 3 |
| E. coli | 54′ | 0.44±0.06 | 2588 | 3 |
| E. coli | 79′ | 0.38±0.05 | 1783 | 3 |
| E. coli | 92′ | 0.38±0.05 | 2225 | 3 |
| Caulobacter | ori | 0.38±0.04 | 2314 | 4 |
| Caulobacter | pilA | 0.39±0.07 | 2612 | 4 |
| Caulobacter | pleC | 0.38±0.04 | 3118 | 4 |
| Caulobacter | podJ | 0.37±0.10 | 2925 | 4 |
| E. coli | RK2 plasmid | 0.40±0.03 | 709 | 2 |
|
| ||||
| E. coli | RNA-protein particle | 0.71±0.10 | 323 | 2 |
The motion of a monomer in a polymer depends not only on its environment but also on the movement of neighboring monomers. Rouse describes the elastic coupling between monomers in a polymer and predicts a monomer scaling of 0.5 for timescales less than the longest relaxation time of the polymer τR [17, 18]. For crowded melts, de Gennes’s reptation theory predicts a monomer scaling of 0.25 due to the topological constraints of entangled polymers combined with the Rouse modes [18, 19]. The Zimm model accounts for hydrodynamic interactions, which increase the monomer scaling to 0.67 [20]. However, the degree of crowding in vivo is assumed to screen out hydrodynamic effects over the relevant length and time scales [18], so we do not consider hydrodynamic interactions in our present treatment. The E. coli chromosome is a single circular polymer confined within a cell that is orders of magnitude smaller than its unconfined radius of gyration. Since these properties differ from the assumptions made in the Rouse and reptation models, we have used Brownian dynamics simulations to determine what physical forces are relevant for our system. The simulations, described in an accompanying paper [13], gave a monomer scaling of 0.5, regardless of contour length, chain topology (linear versus circular), self-interaction strength, and degree of confinement. This indicated that the elastic Rouse modes dominate monomer behavior. These simulation results also demonstrated that our experimental observations of chromosomal loci are more subdiffusive than can be accounted for by polymer theory.
The classic Rouse model assumes that the medium surrounding a polymer is purely viscous. However, this is not the case in vivo. Macromolecular crowding and the presence of semiflexible polymers cause the cytoplasm to behave as a viscoelastic fluid [21–23]. To determine how viscoelasticity affects Rouse’s prediction, we introduced a fBm memory kernel into the Rouse framework and derived an analytical expression for the MSD of a monomer [13]. The analytical result gives two scaling regimes: for t ≪ τR, and for t ≫ τR, where b is the Kuhn length, kB is the Boltzmann constant, T is temperature, ξ is the drag coefficient, and N is the number of monomers in the polymer. Our analytical result provides the general observation that the monomer MSD is expected to scale as one-half of the particle’s MSD scaling in the same medium for t ≪ τR. Indeed, for a viscous medium with no memory (α = 1 for a particle), we recover Rouse’s original scaling prediction. However, if we set α = 0.70, as is observed for RNA-protein particles in the cytoplasm [2], then our theory gives a monomer MSD scaling of 0.35. Thus, we would expect a locus on the chromosome to move with a scaling of ~0.35 in vivo.
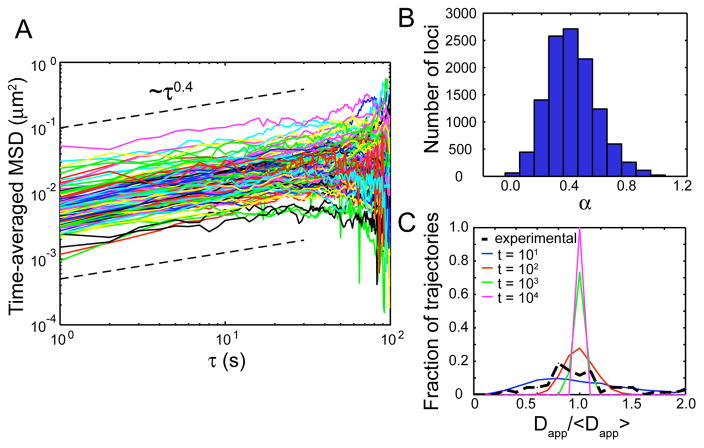
While our analytical result for the MSD scaling is consistent with our experiments, other possible mechanisms for subdiffusion, such as binding interactions or spatial obstacles, must also be considered. To identify the underlying mechanism of subdiffusion in vivo, we calculate the time-averaged MSD for individual chromosomal loci. The scaling for the time-averaged MSD is 0.41±0.17 (Fig. 2A, B), which is the same as that found for the ensemble-averaged MSD. This agreement indicates an underlying ergodic process like OD or fBm, but not CTRW [10, 11]. RNA molecules containing tandem hairpins bound by the MS2-GFP protein [2] also exhibit ergodicity, though with an α almost twice as large. The scaling exponent for the ensemble-averaged MSD is 0.71 ± 0.10, while for the time-averaged MSD it is 0.69 ± 0.20 (see also Ref. [2]). Furthermore, the broad distribution of apparent diffusion coefficients Dapp does not necessarily indicate a CTRW, as has been suggested previously [10, 24]. Rather, we propose an alternative explanation, namely that this distribution is expected from trajectories of finite length [25]. Indeed, our experimental distribution falls just below the distribution for simulated trajectories of 100 time steps (Fig. 2C, Supp. Mat.). Since our movies are 100 frames long, and not all trajectories are complete (due to photo-bleaching and focus drift), this suggests that the spread in the data is due to the finite measurement rather than a non-stationary process such as CTRW.
FIG. 2.
Time-averaged MSD of chromosomal loci. (A) Time-averaged MSD for 124 loci from a single movie. Dashed black lines have a slope of 0.4. (B) Histogram of α for 11580 loci from 29 datasets. (C) Distributions of Dapp/〈Dapp〉 for experimental data shown in A (black dashed curves) and simulated trajectories over finite time steps t (colored solid curves).
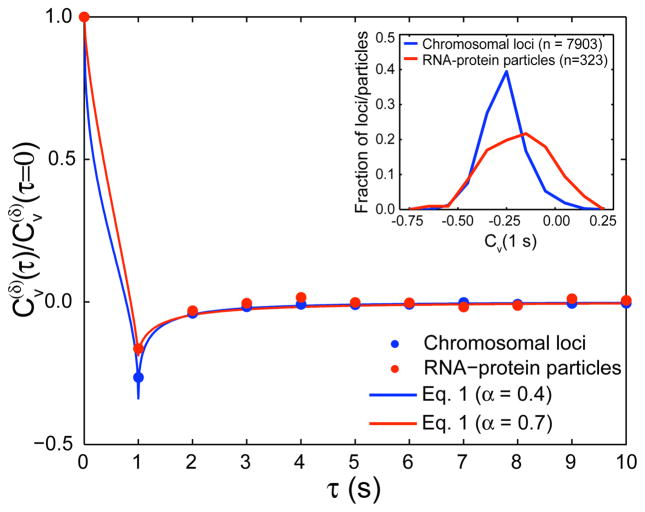
To further distinguish between subdiffusion models, we calculate the velocity autocorrelation function Cv(τ) = 〈v⃗v(t + τ) · v⃗(t)〉 for both a monomer (chromosomal loci) and a particle (RNA-protein particles). Both probes have a negative autocorrelation at short time lags (Fig. 3), indicating a tendency to move back to a previous position. This antipersistent behavior at short time scales is characteristic of a viscoelastic environment. CTRW and OD, in contrast, produce random, uncorrelated trajectories. Since the RNA-protein particles exhibit a negative autocorrelation, this result supports an underlying fBm mechanism and rules out both CTRW and OD. The intrinsic elasticity of the DNA polymer may also contribute to a negative velocity autocorrelation for chromosomal loci, resulting in a larger negative autocorrelation for the chromosomal loci than that of the RNA-protein particles.
FIG. 3.
Velocity autocorrelation function Cv(τ) for chromosomal loci and RNA-protein particles. Points are experimental data, and lines are our theoretical predictions (Eq. 1 using experimentally-determined α values). (Inset) Histogram of autocorrelation values at τ = 1 s for 7903 chromosomal loci and 323 RNA-protein particles pooled over multiple movies.
Using our analytical results for a fBm polymer [13], the velocity autocorrelation function of a discrete process with time step δ is given by
| (1) |
where and η = δ/τ [13]. This theoretical prediction is plotted in Fig. 3 with the experimentally measured values of α and no additional fitting parameters.
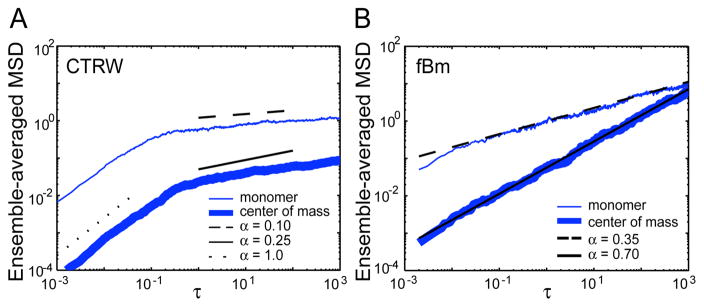
Finally, we return to Brownian dynamics simulations to confirm that fBm, and not CTRW, can produce results consistent with our experiments (Supp. Info.). When monomers in a polymer undergo a CTRW, as described in Ref. [13], the resulting behavior is more subdiffusive than seen in experiments (Fig. 4A). For example, a particle with an α value of 0.7 scales as ~0.10 when embedded in a polymer. In contrast, polymers whose monomers move according to fBm exhibit scalings consistent with our experimental observations (Fig. 4B). The center of mass, which behaves like a large particle [13], moves subdiffusively with the same input scaling α, while the monomer MSD scales as α/2. These simulations agree with both our experimental and analytical results.
FIG. 4.
Polymer simulations with subdiffusive monomers showing the MSD of a monomer and the center of mass for CTRW (A) and fBm (B) models. Data is the ensemble average of 100 simulations. Black lines in A are scaling guides; in B, they give our analytical solutions from Ref. [13].
Our results provide strong evidence for a fBm mechanism for subdiffusive motion in vivo. This conclusion confirms the viscoelastic nature of the cytoplasm, which has dramatic consequences for molecular transport. Namely, molecules take longer than expected to reach distant targets, but they also explore regions of space more thoroughly. Furthermore, our results demonstrate that the robust scaling laws observed for macromolecules in vivo arise from physical principles, rather than tightly regulated biological processes.
Recently, Szymanski and Weiss used fluorescence correlation spectroscopy (FCS) and simulations to show that a stationary propagator drives crowding-induced subdiffusion [26]. In contrast to FCS, our particle-tracking method provides trajectories of individual particles/loci. This additional information enables us to make a clearer distinction between possible subdiffusive mechanisms. In particular, the velocity autocorrelation function is a key diagnostic measure, as it offers an unambiguous test for viscoelasticity.
Our results also have implications for chromosome organization and dynamics. The monomer MSD scaling of α/2 seems to be universal: we have observed α ≈ 0.4 in three bacterial species [15], and the same behavior is found in budding yeast [27] and human cells [24]. The scaling is independent of both genomic and cellular position, as well as transcriptional state. This invariance is consistent with a viscoelastic mechanism, which will permeate the entire cell, whereas binding sites and cytoskeletal networks may not be uniformly distributed. This subdiffusive motion may contribute to the maintenance of chromosome territories [28] in both prokaryotes and eukaryotes.
Supplementary Material
Acknowledgments
We thank Stuart Austin, Ido Golding, Joe Pogliano, Lucy Shapiro and Martin Thanbichler for generously providing bacterial strains. We would also like to thank Jane Kondev, Paul Wiggins, Rob Phillips, Ido Golding, Harley McAdams and Hideo Mabuchi for helpful discussions. SCW was supported by the NIH CMB training grant; AJS was supported by NSF-CAREER Award; JAT was supported by HHMI.
References
- 1.Bouchaud JP, Georges A. Phys Rep. 1990;195:127. [Google Scholar]
- 2.Golding I, Cox EC. Phys Rev Lett. 2006;96:098102. doi: 10.1103/PhysRevLett.96.098102. [DOI] [PubMed] [Google Scholar]
- 3.Tolic-Nørrelykke IM, et al. Phys Rev Lett. 2004;93:078102. [Google Scholar]
- 4.Gittes F, et al. Phys Rev Lett. 1997;79:3286. [Google Scholar]
- 5.Banks DS, Fradin C. Biophys J. 2005;89:2960. doi: 10.1529/biophysj.104.051078. [DOI] [PMC free article] [PubMed] [Google Scholar]
- 6.Montroll EW, Weiss GH. J Math Phys. 1965;6:167. [Google Scholar]
- 7.Saxton MJ. Biophys J. 1996;70:1250. doi: 10.1016/S0006-3495(96)79682-0. [DOI] [PMC free article] [PubMed] [Google Scholar]
- 8.Saxton MJ. Biophys J. 1994;66:394. doi: 10.1016/s0006-3495(94)80789-1. [DOI] [PMC free article] [PubMed] [Google Scholar]
- 9.Mandelbrot BB, van Ness JW. Siam Review. 1968;10:422. [Google Scholar]
- 10.He Y, Burov S, Metzler R, Barkai E. Phys Rev Lett. 2008;101:058101. doi: 10.1103/PhysRevLett.101.058101. [DOI] [PubMed] [Google Scholar]
- 11.Deng WH, Barkai E. Phys Rev E. 2009;79:011112. doi: 10.1103/PhysRevE.79.011112. [DOI] [PubMed] [Google Scholar]
- 12.Metzler R, et al. Acta physica polonica A. 2009;40:1315. [Google Scholar]
- 13.Weber SC, Theriot JA, Spakowitz AJ. 2009 Submitted. [Google Scholar]
- 14.Nielsen HJ, et al. Mol Microbiol. 2006;61:383. doi: 10.1111/j.1365-2958.2006.05245.x. [DOI] [PubMed] [Google Scholar]
- 15.Fiebig A, Keren K, Theriot JA. Mol Microbiol. 2006;60:1164. doi: 10.1111/j.1365-2958.2006.05175.x. [DOI] [PMC free article] [PubMed] [Google Scholar]
- 16.Espeli O, Mercier R, Boccard F. Mol Microbiol. 2008;68:1418. doi: 10.1111/j.1365-2958.2008.06239.x. [DOI] [PubMed] [Google Scholar]
- 17.Rouse PE. J Chem Phys. 1953;21:1272. [Google Scholar]
- 18.Doi M, Edwards SF. The theory of polymer dynamics. Oxford University Press; 1986. [Google Scholar]
- 19.de Gennes PG. J Chem Phys. 1971;55:572. [Google Scholar]
- 20.Zimm BH. J Chem Phys. 1956;24:269. [Google Scholar]
- 21.Pan W, et al. Phys Rev Lett. 2009;102:058101. [Google Scholar]
- 22.Gittes F, MacKintosh FC. Phys Rev E. 1998 doi: 10.1103/PhysRevE.65.061904. [DOI] [PubMed] [Google Scholar]
- 23.Wirtz D. Annu Rev Biophys. 2009;38:301. doi: 10.1146/annurev.biophys.050708.133724. [DOI] [PubMed] [Google Scholar]
- 24.Bronstein I, et al. Phys Rev Lett. 2009;103:018102. doi: 10.1103/PhysRevLett.103.018102. [DOI] [PubMed] [Google Scholar]
- 25.Saxton MJ. Biophys J. 1997;72:1744. doi: 10.1016/S0006-3495(97)78820-9. [DOI] [PMC free article] [PubMed] [Google Scholar]
- 26.Szymanksi J, Weiss M. Phys Rev Lett. 2009;103:038102. doi: 10.1103/PhysRevLett.103.038102. [DOI] [PubMed] [Google Scholar]
- 27.Cabal GG, et al. Nature. 2006;441:770. doi: 10.1038/nature04752. [DOI] [PubMed] [Google Scholar]
- 28.Cremer T, et al. Curr Opin Cell Biol. 2006;18:307. doi: 10.1016/j.ceb.2006.04.007. [DOI] [PubMed] [Google Scholar]
Associated Data
This section collects any data citations, data availability statements, or supplementary materials included in this article.


