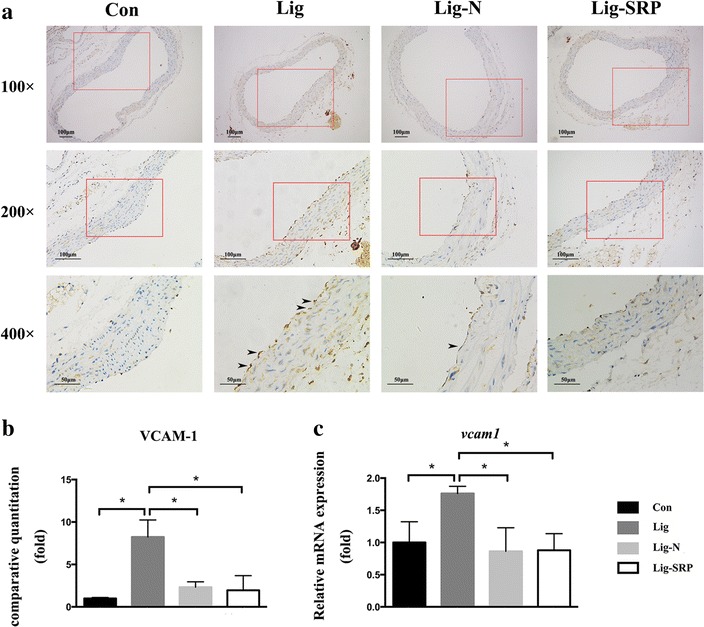
Fig. 6.

Expression of vascular cell adhesion molecule-1 (VCAM-1) in aorta in different experimental groups. a Photomicrographs showing VCAM-1 in the Con group, the Lig group, the Lig-N group and the Lig-SRP group. ×100, scale bars 100 μm. ×200, scale bars 100 μm. ×400, scale bars 50 μm. Arrowheads immuno-reactive cells. b Graph showing the VCAM-1 positive cell counts by fold in each group. *p < 0.05. c Relative gene expression levels of VCAM-1 in aorta. *p < 0.05
