

Abstract
Recent studies have evaluated cumulative human immunodeficiency virus type 1 (HIV-1) viral load (cVL) for predicting disease outcomes, with discrepant results. We reviewed the disparate methodological approaches taken and evaluated the prognostic utility of cVL in a resource-limited setting. Using data on the Infectious Diseases Institute (Makerere University, Kampala, Uganda) cohort, who initiated antiretroviral therapy in 2004–2005 and were followed up for 9 years, we calculated patients' time-updated cVL by summing the area under their viral load curves on either a linear scale (cVL1) or a logarithmic scale (cVL2). Using Cox proportional hazards models, we evaluated both metrics as predictors of incident opportunistic infections and mortality. Among 489 patients analyzed, neither cVL measure was a statistically significant predictor of opportunistic infection risk. In contrast, cVL2 (but not cVL1) was a statistically significant predictor of mortality, with each log10 increase corresponding to a 1.63-fold (95% confidence interval: 1.02, 2.60) elevation in mortality risk when cVL2 was accumulated from baseline. However, whether cVL is predictive or not hinges on difficult choices surrounding the cVL metric and statistical model employed. Previous studies may have suffered from confounding bias due to their focus on cVL1, which strongly correlates with other variables. Further methodological development is needed to illuminate whether the inconsistent predictive utility of cVL arises from causal relationships or from statistical artifacts.
Keywords: Cox proportional hazards models, HIV, human immunodeficiency virus, Martingale residuals, mortality, opportunistic infections, viral load, viremia copy-years
Antiretroviral therapy (ART) for patients infected with human immunodeficiency virus (HIV) leads to CD4 T-cell count reconstitution, HIV RNA viral load (VL) reduction, reduced burden of opportunistic infections (OIs), and prolonged survival (1). However, some treated patients never achieve complete CD4 cell count reconstitution or undetectable VLs (2); consequently, they experience an increased risk of developing drug resistance (3) and noncommunicable diseases (4) and remain more infectious to their sexual partners relative to patients who respond to treatment more effectively (5).
Although CD4 cell count is used as a threshold criterion for ART initiation, VL better indicates treatment failure, the subsequent need to switch regimens (6), and an individual's infectiousness (7). High costs have limited the use of VL assays in resource-limited settings to date. However, this is changing with the advent of newer, cheaper technology, particularly point-of-care assays (8) and techniques like sample pooling (9). Consequently, many countries, including Uganda, are scaling up VL monitoring for all HIV patients on ART (10).
Further, recent research in resource-rich countries suggests new, potentially promising applications of VL monitoring. In particular, several studies have found cumulative VL (cVL) to better predict mortality (11–13), incident OIs (14–16), and immune system recovery (15) than most recent VL measurement. These results appear biologically plausible given that accumulated exposure to high VLs leads to inflammation, immune system activation, and other etiological processes (11, 12, 17). However, in view of the diverse approaches taken in prior analyses, we reviewed earlier studies of cVL, investigating the consequences of varying assumptions and methodologies.
We then expanded on prior work in several directions: We performed an analysis evaluating the prognostic utility of cVL in a resource-poor setting (an HIV clinic in Uganda), where disease has often progressed further by the time patients receive treatment (18) and where VL monitoring is being expanded (9, 10). Based on our review, we explored the sensitivity of the results to how cVL data are accumulated, providing a formal comparison between accumulations calculated using the linear metric and those calculated using the logarithmic metric. Since health outcomes are often observed more frequently than laboratory measurements, we implemented a regression framework to estimate the declining prognostic utility of these measurements over time. In this paper, we highlight the clinical implications of this work and areas for future study.
METHODS
Literature review
We searched PubMed (US National Library of Medicine, Bethesda, Maryland) for articles containing the keywords “viremia copy-years,” “viremia copy years,” “cumulative HIV viremia,” and “cumulative viral load” that had been published during the period April 2014–March 2015. We selected all studies in which cVL methods were employed in analyzing data on HIV-infected adults. Nine studies were identified as relevant.
Study setting and population
The Infectious Diseases Institute is an urban HIV clinic based at Mulago National Referral Hospital in Kampala, Uganda. In a prospective cohort study of 559 patients with HIV type 1, ART was initiated between April 2004 and April 2005, following World Health Organization (19) and national (20) guidelines (i.e., either CD4 count <200 cells/µL irrespective of World Health Organization stage or clinically advanced symptoms), with up to 9 years of follow-up. Participants visited the clinic for an in-depth examination approximately every 12 weeks, with CD4 cell count, VL, and hemoglobin being measured at every other visit (21). Baseline measurements were fixed on the day of ART initiation. The primary VL assay used throughout the study had lower and upper detection limits of 400 copies/mL and 750,000 copies/mL, respectively. Despite the occasional use of assays with lower detection limits, we censored all measurements below 400 copies/mL for consistency. We excluded from the analysis 63 patients who died or were lost to follow-up before their second VL measurement (including many who died within the first 12 weeks of ART (22)) and 7 patients lacking baseline CD4 or VL measurements. Patients were also censored after they switched to second-line regimens, died, or were lost to follow-up. Fourteen patients stopped ART treatment because of toxicity or poor adherence.
Outcomes of interest
In our first analysis, we investigated predictors of OI risk, coding OI as a binary variable indicating the occurrence of ≥1 incident OIs since the last clinic visit, because concurrent incident OIs were rare. We did not censor patients after their first incident OI; consequently, each patient could contribute more than 1 incident OI outcome to the analysis. We included the following OIs: oropharyngeal and esophageal candidiasis, toxoplasmosis of the brain, unexplained chronic diarrhea, severe bacterial pneumonia, tuberculosis, herpes zoster, Pneumocystis jerovecii pneumonia, cryptococcal meningitis, Kaposi's sarcoma, prurigo, and lymphoma. In our second analysis, we investigated predictors of mortality, excluding only cases for which the stated cause of death was violence or accident. Because of our small sample size, we did not differentiate between deaths related to acquired immunodeficiency syndrome (AIDS) and non-AIDS-related deaths (e.g., cancer or heart disease).
Laboratory measurements and the calculation of cVL
Most recent VL and cVL were the main predictors of interest. We avoid the often-used previous nomenclature of “copy-years,” as the correct unit for cVL depends on the method of calculation. In prior studies, researchers have calculated cVL either by summing the area under the VL curve and then taking the logarithm (cVL1) or, more rarely, by summing the area under the log VL curve (cVL2; see Supplementary Data, available at http://aje.oxfordjournals.org/).
Calculations were made using the trapezoidal rule (16). cVL1 (time-updated area under the VL curve) for patient i at his or her jth visit was calculated as
where ti,k and Vi,k represent the time (in years) and (untransformed) VL measurement of the kth visit, respectively.
We chose to calculate cVL2 as the time-updated area under the log VL curve and above the level of 400 copies/mL under the assumption that exposure to virus below this detection threshold does not contribute to OI or mortality risk. Thus, the cVL2 for the ith patient at his or her jth visit to the clinic is given by
We assumed that both cVL measurements were 0 at the baseline visit. Through simulation, we determined that using exact intervisit durations biased survival regression coefficient estimates of cVL. Since intervisit durations were close to 12 weeks, we rounded them off to this value (see Supplementary Data).
The 2 metrics produce very different cVL trajectories (Figure 1). Accumulating VL on a linear scale (cVL1) gives more weight to a patient's largest VL measurements. Summing on a log scale (cVL2) gives more weight to intermediate measurements, such as viral blips, which occur during periods of otherwise successful viral suppression. These two choices are not exhaustive: Viral measurements might also be accumulated on other transformed scales. The true scale is unknown and presumably dictated by mechanisms underlying HIV pathogenesis which, given available measurements, are imperfectly characterized. Consequently, we confined our analyses to the above 2 metrics. We also conducted 2 sensitivity analyses—first, using the World Health Organization threshold for virological failure (1,000 copies/mL) for cVL2 to account for the potential arbitrariness of the chosen threshold (10, 23), and second, only analyzing data and accumulating cVL after the 24-week clinic visit.
Figure 1.
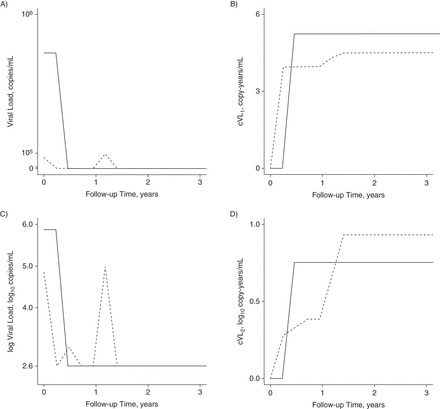
Comparison of cumulative human immunodeficiency virus (HIV) viral load (cVL) derivations for 2 HIV patients on antiretroviral therapy (ART) in the Infectious Diseases Institute cohort, Kampala, Uganda, 2004–2013. Solid line, patient 1; dashed line, patient 2. Parts A and C show the 2 example patients' viral load (VL) and log VL trajectories, respectively, as a function of time since cohort enrollment (i.e., ART initiation). The 2.6 mark on the y-axis of part C is the log of the detection limit of the VL assay. Part B shows the log cVL (cVL1) for these patients, which is calculated by taking the logarithm of the time-updated area under the curve (AUC) from part A. Part D shows the patients' trajectories for cumulative log VL (cVL2), which is calculated by taking the time-updated AUC from part C. Whether we accumulate viremia on a log scale or a linear scale therefore determines which of these 2 patients we consider as having been exposed to the greatest cVL since enrollment, at the end of 3 years of follow-up.
Statistical methods
We regressed time to OI and mortality outcomes against predictors using multivariate Cox proportional hazards models, which implicitly account for a temporally varying hazard as a function of time since ART initiation (24). Sex, baseline age, baseline CD4 cell count, and baseline VL were included as constant predictors; time-varying predictors included most recent CD4 cell count, hemoglobin concentration, VL, and either cVL1 or cVL2. VLs below 400 copies/mL were modeled as a separate categorical variable. While OI acquisition could occur over multiple observation intervals, we assumed that a patient's OI hazard was unaffected by his or her previous OI history. Since laboratory assays were only performed at every other visit, we expected that the prognostic value of laboratory measurements would be greater for the interval immediately following measurement than for intervals with a larger time lapse since the last measurement. We explicitly estimated this effect by including the most recent measurement of each laboratory predictor as a main effect and as an interaction with the time lag since its measurement. Further detail is provided in the Supplementary Data.
Other than the main predictors—most recent VL and cVL—we chose to include other covariates as untransformed, log-scaled, or categorical based on visual inspection of smoothed Martingale residual plots (24) (Supplementary Data). We report adjusted hazard ratios, and to account for interpatient heterogeneity (i.e., in addition to that accounted for by observed covariates), we used Andersen-Gill robust standard errors (24) to calculate Wald 95% confidence intervals and P values. By using the Andersen-Gill standard errors, we avoided the need to fit a full probability model to the data. As a result, this precluded between-model comparisons based on likelihood-based criteria and any statistics requiring a full model (i.e., R2 and related statistics). For laboratory measurements made every other visit, we report adjusted hazard ratios for both the 0- to 12-week interval following their measurement and the 12- to 24-week interval following measurement. Statistical significance was defined as a P value less than 0.05. Statistical analysis was carried out using R, version 3.0.3 (R Foundation for Statistical Computing, Vienna, Austria).
Ethical considerations
This study and analysis of the data were reviewed and approved by the Institutional Review Board of Makerere University and the Uganda National Council for Science and Technology. Written informed consent was sought from each study participant at cohort inception.
RESULTS
Of 489 patients analyzed, 69.7% were female. The median baseline age was 35.3 years (interquartile range (IQR), 30.2–41.8), median baseline CD4 cell count was 100 cells/μL (IQR, 30–168), median baseline VL was 5.4 log10 copies/mL (IQR, 5.1–5.8), and median follow-up time was 8.3 years (IQR, 2.3–8.8; Supplementary Data). Of the 2 cVL measures, cVL1 exhibited greater negative correlation with most recent VL and a greater positive correlation with baseline VL and peak VL (Supplementary Data, Supplementary DataA).
OI model
The majority of incident OIs occurred during the first 2 years after ART initiation, with the VLs approaching undetectable levels and the number of incident OIs decreasing substantially after 4 years (Figure 2). Based on inspection of smoothed Martingale residuals, we included hemoglobin concentration, CD4 count, and baseline CD4 count on the log scale, age on a linear scale, and baseline VL as a categorical variable as possible predictors of OI occurrence. A 1og10 increase in VL was associated with a statistically significant greater hazard of an incident OI for up to 12 weeks after VL measurement (Table 1). Neither cVL measure was a statistically significant predictor of incident OIs. Lower hemoglobin level was a statistically significant predictor of OI risk for up to 24 weeks after measurement.
Figure 2.
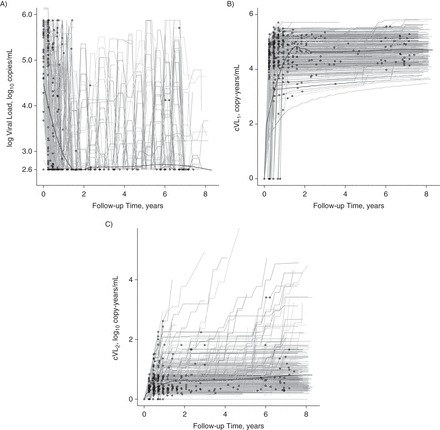
Incident opportunistic infections versus viral load (VL) and cumulative human immunodeficiency virus (HIV) viral load (cVL) trajectories for HIV patients on antiretroviral therapy (ART) in the Infectious Diseases Institute cohort, Kampala, Uganda, 2004–2013. The gray lines show each cohort participant's VL (A), log cVL (cVL1) (B), and cumulative log VL (cVL2) (C) trajectory as a function of time since cohort enrollment and initiation of ART. The 2.6 mark on the y-axis of part A is the log of the detection limit of the VL assay. The thick black lines show the locally weighted scatterplot smoothing (LOWESS) trend through these trajectories. Circles show the occurrence of incident opportunistic infections along patients' trajectories.
Table 1.
Results From a Model of Opportunistic Infection Among Human Immunodeficiency Virus Patients on Antiretroviral Therapy in the Infectious Diseases Institute Cohort, Kampala, Uganda, 2004–2013a
| Variable | Model With cVL1 |
Model With cVL2 |
||
|---|---|---|---|---|
| AHR | 95% CI | AHR | 95% CI | |
| Per log10 increase in VL, log10 copies/mL | ||||
| Predicting 0–12 weeks ahead | 1.28b | 1.09, 1.50 | 1.34c | 1.12, 1.61 |
| Predicting 0–24 weeks ahead | 1.18 | 0.87, 1.59 | 1.21 | 0.97, 1.50 |
| Per log10 increase in cumulative viremia, log10 copy-years/mL | ||||
| Predicting 0–12 weeks ahead | 0.97 | 0.86, 1.09 | 0.78 | 0.52, 1.15 |
| Predicting 0–24 weeks ahead | 1.00 | 0.91, 1.10 | 1.00 | 0.68, 1.48 |
| Per 2-fold increase in CD4 cell count, cells/µL | ||||
| Predicting 0–12 weeks ahead | 0.90 | 0.81, 1.00 | 0.90d | 0.80, 1.00 |
| Predicting 0–24 weeks ahead | 0.92 | 0.76, 1.11 | 0.91 | 0.76, 1.11 |
| Per 10% increase in hemoglobin concentration, g/dL | ||||
| Predicting 0–12 weeks ahead | 0.91b | 0.86, 0.96 | 0.91c | 0.86, 0.96 |
| Predicting 0–24 weeks ahead | 0.89d | 0.81, 0.98 | 0.89b | 0.82, 0.97 |
| Per 2-fold increase in baseline CD4 cell count, cells/µL | 0.98 | 0.90, 1.07 | 0.98 | 0.90, 1.08 |
| Quartile of baseline VL, log10 copies/mLe | ||||
| 1 | 1 | Referent | 1 | Referent |
| 2 | 0.97 | 0.70, 1.35 | 0.96 | 0.69, 1.32 |
| 3 | 1.23 | 0.87, 1.72 | 1.20 | 0.87, 1.64 |
| 4 | 1.04 | 0.73, 1.50 | 1.01 | 0.72, 1.42 |
| Sex | ||||
| Female | 1 | Referent | 1 | Referent |
| Male | 0.78 | 0.60, 1.01 | 0.78 | 0.60, 1.01 |
| Per 10-year increase in baseline age | 0.91 | 0.79, 1.04 | 0.91 | 0.79, 1.04 |
Abbreviations: AHR, adjusted hazard ratio; CI, confidence interval; cVL1, log cumulative viral load; cVL2, cumulative log viral load; VL, viral load.
a AHR and 95% CI for the risk of acquiring an incident opportunistic infection from multivariate Cox proportional hazard models, with cumulative viremia calculated as either cVL1 or cVL2.
b P < 0.01.
c P < 0.001.
d P < 0.05.
e Quartiles: first—≤105.07 log10 copies/mL; second—105.08 to 105.44 log10 copies/mL; third—105.45 to 105.77 log10 copies/mL; fourth—105.78 to 106.15 log10 copies/mL.
Mortality model
Sixty-two patients died during follow-up, 33 of AIDS-specific causes. As with OIs, most deaths occurred during the first 2 years after enrollment (Figure 3). Again, after examination of smoothed Martingale residuals, we included hemoglobin level, current CD4 count, and baseline CD4 count on the log scale and age and baseline VL as categorical variables. Most recent VL was not a statistically significant predictor of mortality (Table 2). In contrast, cVL2 but not cVL1 was a statistically significant predictor of mortality for up to 12 weeks after the most recent laboratory measurement. Low hemoglobin level and low CD4 cell count were statistically significant predictors of high mortality risk for up to 24 weeks after measurement. Older age (≥56 years) and baseline VL (≥105.78 copies/mL) were also statistically significant predictors of mortality risk.
Figure 3.

Mortality versus viral load (VL) and cumulative human immunodeficiency virus (HIV) viral load (cVL) trajectories for HIV patients on antiretroviral therapy (ART) in the Infectious Diseases Institute cohort, Kampala, Uganda, 2004–2013. The gray lines show each cohort participant's VL (A), log cVL (cVL1) (B), and cumulative log VL (cVL2) (C) trajectory as a function of time since cohort enrollment and initiation of ART. The 2.6 mark on the y-axis of part A is the log of the detection limit of the VL assay. The thick black lines show the locally weighted scatterplot smoothing (LOWESS) trend through these trajectories. The squares and triangles show the influence of AIDS-related and non-AIDS-related mortality on patients' trajectories, respectively. AIDS, acquired immunodeficiency syndrome.
Table 2.
Results From a Model of All-Cause Mortality Among Human Immunodeficiency Virus Patients on Antiretroviral Therapy in the Infectious Diseases Institute Cohort, Kampala, Uganda, 2004–2013a
| Variable | Model With cVL1 |
Model With cVL2 |
||
|---|---|---|---|---|
| AHR | 95% CI | AHR | 95% CI | |
| Per log10 increase in VL, log10 copies/mL | ||||
| Predicting 0–12 weeks ahead | 1.38 | 0.92, 2.05 | 1.13 | 0.72, 1.77 |
| Predicting 0–24 weeks ahead | 0.98 | 0.55, 1.75 | 0.89 | 0.51, 1.55 |
| Per log10 increase in cumulative viremia, log10 copy-years/mL | ||||
| Predicting 0–12 weeks ahead | 0.97 | 0.65, 1.44 | 1.63b | 1.02, 2.60 |
| Predicting 0–24 weeks ahead | 0.98 | 0.80, 1.22 | 0.50 | 0.17, 1.49 |
| Per 2-fold increase in CD4 cell count, cells/µL | ||||
| Predicting 0–12 weeks ahead | 0.58c | 0.46, 0.73 | 0.57c | 0.45, 0.72 |
| Predicting 0–24 weeks ahead | 0.68b | 0.49, 0.96 | 0.69b | 0.51, 0.92 |
| Per 10% increase in hemoglobin concentration, g/dL | ||||
| Predicting 0–12 weeks ahead | 0.77c | 0.70, 0.84 | 0.77c | 0.70, 0.83 |
| Predicting 0–24 weeks ahead | 0.72c | 0.63, 0.82 | 0.73c | 0.65, 0.82 |
| Per 2-fold increase in baseline CD4 cell count, cells/µL | 1.08 | 0.92, 1.28 | 1.08 | 0.92, 1.28 |
| Quartile of baseline VL, log10 copies/mLd | ||||
| 1 | 1 | Referent | 1 | Referent |
| 2 | 1.54 | 0.70, 3.40 | 1.51 | 0.68, 3.33 |
| 3 | 1.35 | 0.52, 3.53 | 1.28 | 0.53, 3.09 |
| 4 | 3.94e | 1.61, 9.64 | 3.62c | 1.71, 7.64 |
| Sex | ||||
| Female | 1 | Referent | 1 | Referent |
| Male | 1.10 | 0.58, 2.10 | 1.07 | 0.56, 2.05 |
| Baseline age, years | ||||
| ≤35 | 1 | Referent | 1 | Referent |
| 36–45 | 1.22 | 0.68, 2.19 | 1.29 | 0.71, 2.34 |
| 46–55 | 1.61 | 0.77, 3.38 | 1.71 | 0.82, 3.60 |
| ≥56 | 2.94b | 1.26, 6.86 | 3.02e | 1.30, 6.97 |
Abbreviations: AHR, adjusted hazard ratio; CI, confidence interval; cVL1, log cumulative viral load; cVL2, cumulative log viral load; VL, viral load.
a AHR and 95% CI for the hazard of dying of any cause from multivariate Cox proportional hazards models, with cumulative viremia calculated as either cVL1 or cVL2.
b P < 0.05.
c P < 0.001.
d Quartiles: first—≤105.07 log10 copies/mL; second—105.08 to 105.44 log10 copies/mL; third—105.45 to 105.77 log10 copies/mL; fourth—105.78 to 106.15 log10 copies/mL.
e P < 0.01.
Sensitivity analyses
Changing cVL2 to only accumulate VL above 1,000 copies/mL did not qualitatively affect results for either OI or mortality models (Supplementary Data). Excluding data prior to the 24-week visit decreased and increased the respective correlations of cVL1 and cVL2 with most recent log VL (Supplementary DataB). This sensitivity analysis did not qualitatively affect the results of the OI analysis (Supplementary Data); however, in the mortality analysis, while cVL2 remained significant, cVL1 additionally became statistically significant (Supplementary Data).
DISCUSSION
In the data from this Ugandan cohort of HIV-infected patients on ART, we found that most recent VL, but neither cVL metric, significantly predicted a patient's risk of acquiring a new OI. However, cVL2 (but neither VL nor cVL1) significantly predicted a patient's mortality risk. These significant associations persisted for only 12 weeks after the last measurement. In contrast, hemoglobin levels predicted risk of acquiring a new OI, and both hemoglobin level and CD4 cell count predicted mortality risk for up to 24 weeks postmeasurement. Our sensitivity analyses demonstrated that changing the detection limit from 400 copies/mL to 1,000 copies/mL did not qualitatively alter the results but that a cVL metric's predictive utility is sensitive to the inclusion of data falling within the first 24 weeks after ART initiation.
Previous studies have similarly shown that, after adjustment for CD4 count, most recent VL is not associated with mortality (17, 25, 26) (see also Supplementary Data). The lack of significant association between cVL and OI risk may be explained by the early incidence of the majority of OIs in this cohort (Figure 2A), as driven by very low CD4 counts at ART initiation (Supplementary Data) (27). This cohort was intensely counseled regarding treatment adherence, which may explain the substantial reduction in incident OIs over time (Figure 2A). Since more incident OIs occurred earlier rather than later while participants were on ART, they were less likely to be associated with cVL than most recent VL.
Within the 9 studies reviewed in Supplementary Data, 5 studies (11, 13–16) evaluated cVL as a predictor of AIDS. One study (28) evaluated cVL as a predictor of non-AIDS-defining outcomes, and 3 considered cVL as a health outcome, regressing it against other predictors (29–31). Among those evaluating AIDS-defining outcomes, 4 studies found statistically significant associations between cVL and AIDS-related outcomes (11, 14–16) and 1 did not (13). However, methodological differences (as described in Supplementary Data) impeded direct comparability. We highlight these differences noting that, while subtle, they fundamentally affect the interpretation of cVL and its relationship with health outcomes. We discuss several major characteristics of cVL analyses that should be considered during the interpretations below.
A patient's cVL summarizes the longitudinal history of VL measurements that go back to a specified starting point. Thus, the cVL starts from the patient's first VL reading (28), from ART initiation (12, 14, 15, 31), or after a specified delay—for example, 24 weeks (11) or 8 months (13) after ART initiation. However, cVL has also been calculated from the date of seroconversion (16). Patients may enter studies at very different time points postinfection, limiting the comparability of these metrics between individuals. Nonetheless, cVL could be a useful proxy for treatment success, as it reflects viral suppression patterns and the frequency, magnitude, and duration of viral blips. Although evidence from cellular studies suggests that viral replication during chronic infection drives certain aspects of HIV pathogenesis (32), cVL accumulated after ART initiation cannot account for the association between pretreatment VL and AIDS-defining outcomes.
Another consideration includes the scale of accumulation. Eight of the 9 studies reviewed accumulated VL on a linear scale (i.e., cVL1 (11–13, 15, 16, 28, 29, 31)) and 2 accumulated VL on a log scale (i.e., cVL2 (14, 29)). We demonstrated (Figure 1) that cVL1 assigns greater weight to large VL measurements, while cVL2 assigns greater weight to repeated intermediate measurements taken during otherwise successful periods of viral suppression. For this reason, cVL1 is strongly correlated with peak VL and the VL at treatment initiation (Supplementary Data), unless the analysis is restricted to data collected after 24 weeks post-treatment initiation (Supplementary DataB). In our analysis, cVL1 was also strongly negatively correlated with most recent log VL (Supplementary DataA) and positively correlated with CD4 cell count. The greater collinearity between cVL1 as compared with cVL2 and other predictor variables likely indicates that linear accumulation provides less information regarding the characteristics of patient VL history than accumulations calculated on the log scale. This is supported by our finding that cVL2 rather than cVL1 was predictive of mortality risk. Thus, statistical associations between cVL1 and health outcomes, as previously found, might be artifacts of confounding, since not all variables may have been appropriately controlled for (Supplementary Data). Alternately, such studies, including ours, might underestimate the true magnitude of the effect of cVL1 due to the difficulty involved in disentangling the effects of correlated variables.
In the choice of cVL metric, the log-linear relationship between VL and infectivity (33, 34) should be considered. HIV infectivity and pathogenesis may arise from different mechanistic relationships with VL. However, we are not aware of any clinical processes/outcomes that scale linearly with untransformed VL. Indeed, many biological processes are log-linear, and VLs are commonly evaluated on a log scale. In addition, when calculating cVL2, by dividing each VL by the VL detection limit before log transformation, we assume that risk of OI and mortality accumulates only due to detectable VL. Without this approach, a patient with a VL that has been suppressed for a long duration may have a cVL similar to that of someone who has a short follow-up time but with viral blips. We consequently suggest that analyses should accumulate cVL on a log scale and include the limit of detection.
Even after the accumulation starting point and scale transformation have been chosen, a cVL metric may be included in the statistical analysis in a variety of ways. Marconi et al. (15) accumulated patient cVL over the entire observation period and then used it as a constant predictor. This amounts to using information from the future to predict past events and should be avoided. All other studies evaluating cVL as a predictor, including our own, incorporated time-updated cVL to predict the risk of an AIDS-defining outcome during a subsequent observation period. While most studies, including our own, included cVL as a continuous predictor variable, both Chirouze et al. (13) and Marconi et al. (15) included cVL as a binary variable because continuous measures of cVL were not statistically significant in their analysis. The need to categorize cVL to achieve statistical significance may indicate that the chosen scale of accumulation does not correspond well to an underlying linear relationship between cVL and the study outcome.
Because cVL metrics, particularly cVL1, are highly collinear with many other covariates that are already well known to predict AIDS-defining outcomes, covariate adjustment will in large part determine whether any statistically significant association is epidemiologically meaningful. This suggests that researchers conducting cVL analyses should adopt a principled approach to covariate adjustment and avoid exclusion of other covariates simply because they are collinear with cVL, or because they are not significant in intermediate models (i.e., backward stepwise selection). Similarly, Kaplan-Meier curves stratified by cVL or other univariate visualizations may also be misleading (12). Some covariates that are collinear with cVL metrics may themselves be better predictors of health outcomes. For instance, for studies accumulating cVL starting at ART initiation, cVL1 is highly correlated with the highest VL post-ART initiation (0.88 in the study by Cole et al. (16); 0.34 here) because patient VLs decline rapidly after ART initiation and cVL1 is disproportionately driven by large VL measurements. Further, peak VL may be a good proxy for chronic phase set-point VL, which plays a known role in HIV pathogenesis (17). Thus, previous findings that cVL1 significantly predicts health outcomes may be driven by an association between set-point VL and both cVL1 and the health outcome, rather than a direct role of cVL1. Of the 6 reviewed studies that evaluated cVL as a predictor, only 1 compared the predictive utility of cVL1 with that of peak VL. The study in question found that peak VL and cVL1 were highly collinear and performed equally well in predicting AIDS-defining outcomes (16).
The accuracy of a patient's measured cVL is determined by the frequency of VL monitoring, and this is important when a patient's VL varies substantially over time. During chronic untreated HIV infection, set-point VLs are relatively stable (35) and accurate cVL calculations may only require fairly infrequent measurement. VL trajectories are more variable during the acute, late, or AIDS phases and for persons on ART (36). In treated individuals, VL trajectories usually remain below the detectability limit except for occasional short-lived blips that may arise from, for example, imperfect adherence. For such patients, measurements taken only every few months are unlikely to identify blips and, if they do, will fail to characterize their duration. Fung et al. (37) noted the importance of sampling frequencies to studies of viral blips. cVL, as a summary of a patient's VL trajectory, including blips, is similarly susceptible to biases related to sampling frequency.
Sampling frequency also affects the interpretation of the prediction interval. The health outcome predictive accuracy of VL and other laboratory measurements probably decreases with increasing time. Since laboratory measurements in this cohort were made every other visit, every 24 weeks, our model explicitly allowed predictor coefficients to change with time following measurements. This enabled us to assess the change in their prognostic utility between 0–12 weeks postmeasurement and 12–24 weeks postmeasurement. More volatile variables (e.g., VL) were only statistically significant predictors of a new OI during the first interval. More stable predictors (e.g., hemoglobin, CD4 count) remained predictive for the full 24 weeks (Supplementary Data), with the exception of cVL2, which may reflect the difficulty in resolving its association due to the correlations identified above. We speculate volatility in VL to arise from intrinsic viral dynamics and from the clinician's or patient's responses to measurements (e.g., increased adherence after a viral blip).
Thus, the use of cVL as a prognostic predictor requires caution in both design and interpretation. We assume that similar considerations apply in studies where cVL is used as an outcome. Although we employed systematic strategies regarding cVL metrics and the adjustment of covariates, our study did have limitations. Similar to prior studies, we were limited to VL assays with lower and upper detection limits. cVL only approximates the true underlying cVL, as viral blips may occur at a smaller temporal resolution than the sampling frequency. We addressed, but did not eliminate, discrepant sampling frequency for explanatory and outcome variables. Our study also analyzed a resource-limited cohort with substantially lower CD4 cell counts and higher VLs at enrollment than previous cVL analyses. Investigators should consider these differences when making comparisons between studies. Kowalkowski et al. (28) focused on non-AIDS-defining diseases, which are known to result from the accumulation of virus-induced inflammation (38). However, etiological mechanisms differ greatly within and between AIDS-defining and non-AIDS-defining diseases, suggesting that the functional relationships between VL trajectories and outcomes may be variable. Our study had a limited sample size to allow for multiple comparisons; therefore, we have interpreted our results cautiously, bearing that in mind.
In conclusion, we suggest that future work is necessary before deciding whether cVL is indeed a useful prognostic measure in clinical settings. In particular, we recommend that future analyses be accompanied by simulations using within-host models of HIV replication and pathogenesis, in which the underlying parameters are known. This would help identify principles for choosing between cVL metrics and covariate specification in cohorts with highly variable levels of left-censorship, infrequent measurements, and collinear variables.
Supplementary Material
ACKNOWLEDGMENTS
Author affiliations: Infectious Diseases Institute, College of Health Sciences, Makerere University, Kampala, Uganda (Joseph B. Sempa, Barbara Castelnuovo, Agnes N. Kiragga); Department of Biology, McMaster University, Hamilton, Ontario, Canada (Jonathan Dushoff); Department of Statistics and Data Sciences and Department of Integrative Biology, University of Texas at Austin, Austin, Texas (Michael J. Daniels); South African Department of Science and Technology/National Research Foundation Centre of Excellence in Epidemiological Modelling and Analysis (SACEMA), University of Stellenbosch, Stellenbosch, South Africa (Joseph B. Sempa, Martin Nieuwoudt); and Center for Computational Biology and Bioinformatics, University of Texas at Austin, Austin, Texas (Steven E. Bellan).
This work was supported by the Infectious Diseases Institute at Makerere University (Kampala, Uganda), where the clinic is located. J.B.S. worked at the Infectious Diseases Institute and had permission to fully access these data. J.B.S. conducted this research as part of the International Disease Dynamics and Data Research Scholars Exchange Program, funded by US National Institutes of Health grant R25GM102149 (to J.R.C.P. and A.W.). J.D. was supported by a James S. McDonnell Foundation grant, and S.E.B. and M.J.D. were supported and partially supported, respectively, by US National Institute of General Medical Sciences MIDAS grant U01GM087719 (to L.A.M. and A.P.G.). M.N. was supported by core Department of Science and Technology/National Research Foundation SACEMA funding.
We thank Dr. Lauren Ancel Meyers and members of the Meyers Lab at the University of Texas at Austin for useful discussions.
B.C. and A.N.K. are co-Principal Investigators in this cohort study.
Conflict of interest: none declared.
REFERENCES
- 1. Palella FJ Jr, Delaney KM, Moorman AC et al. Declining morbidity and mortality among patients with advanced human immunodeficiency virus infection. HIV Outpatient Study Investigators. N Engl J Med. 1998;33813:853–860. [DOI] [PubMed] [Google Scholar]
- 2. Corbeau P, Reynes J. Immune reconstitution under antiretroviral therapy: the new challenge in HIV-1 infection. Blood. 2011;11721:5582–5590. [DOI] [PubMed] [Google Scholar]
- 3. Gupta RK, Hill A, Sawyer AW et al. Virological monitoring and resistance to first-line highly active antiretroviral therapy in adults infected with HIV-1 treated under WHO guidelines: a systematic review and meta-analysis. Lancet Infect Dis. 2009;97:409–417. [DOI] [PubMed] [Google Scholar]
- 4. Dubé MP, Sattler FR. Inflammation and complications of HIV disease. J Infect Dis. 2010;20112:1783–1785. [DOI] [PubMed] [Google Scholar]
- 5. Cohen MS, Gay CL. Treatment to prevent transmission of HIV-1. Clin Infect Dis. 2010;50(suppl 3):S85–S95. [DOI] [PMC free article] [PubMed] [Google Scholar]
- 6. Rutherford GW, Anglemyer A, Easterbrook PJ et al. Predicting treatment failure in adults and children on antiretroviral therapy: a systematic review of the performance characteristics of the 2010 WHO immunologic and clinical criteria for virologic failure. AIDS. 2014;28(suppl 2):S161–S169. [DOI] [PubMed] [Google Scholar]
- 7. Supervie V, Viard J-P, Costagliola D et al. Heterosexual risk of HIV transmission per sexual act under combined antiretroviral therapy: systematic review and bayesian modeling. Clin Infect Dis. 2014;591:115–122. [DOI] [PMC free article] [PubMed] [Google Scholar]
- 8. Secretariat UNITAID, World Health Organization. 2013 HIV/AIDS Diagnostics Technology Landscape. Semi-Annual Update. Geneva, Switzerland: World Health Organization; 2013. http://www.unitaid.eu/images/UNITAID_2013_Semi-annual_Update_HIV_Diagnostics_Technology_Landscape.pdf Published November 2013. Accessed September 2, 2014. [Google Scholar]
- 9. van Zyl GU, Preiser W, Potschka S et al. Pooling strategies to reduce the cost of HIV-1 RNA load monitoring in a resource-limited setting. Clin Infect Dis. 2011;522:264–270. [DOI] [PMC free article] [PubMed] [Google Scholar]
- 10. Webb K, Revill P, Phillips A. Implementation Issues for Monitoring People on ART in Low-Income Settings in Sub-Saharan Africa. (Workshop held in Harare, Zimbabwe, March 11 and 12, 2015) London, United Kingdom: HIV Modelling Consortium; 2015. [Google Scholar]
- 11. Mugavero MJ, Napravnik S, Cole SR et al. Viremia copy-years predicts mortality among treatment-naive HIV-infected patients initiating antiretroviral therapy. Clin Infect Dis. 2011;539:927–935. [DOI] [PMC free article] [PubMed] [Google Scholar]
- 12. Wright ST, Hoy J, Mulhall B et al. Determinants of viremia copy-years in people with HIV/AIDS after initiation of antiretroviral therapy. J Acquir Immune Defic Syndr. 2014;661:55–64. [DOI] [PMC free article] [PubMed] [Google Scholar]
- 13. Chirouze C, Journot V, Le Moing V et al. Viremia copy-years as a predictive marker of all-cause mortality in HIV-1-infected patients initiating a protease inhibitor-containing antiretroviral treatment. J Acquir Immune Defic Syndr. 2015;682:204–208. [DOI] [PubMed] [Google Scholar]
- 14. Zoufaly A, Stellbrink H-J, der Heiden MA et al. Cumulative HIV viremia during highly active antiretroviral therapy is a strong predictor of AIDS-related lymphoma. J Infect Dis. 2009;2001:79–87. [DOI] [PubMed] [Google Scholar]
- 15. Marconi VC, Grandits G, Okulicz JF et al. Cumulative viral load and virologic decay patterns after antiretroviral therapy in HIV-infected subjects influence CD4 recovery and AIDS. PLoS One. 2011;65:e17956. [DOI] [PMC free article] [PubMed] [Google Scholar]
- 16. Cole SR, Napravnik S, Mugavero MJ et al. Copy-years viremia as a measure of cumulative human immunodeficiency virus viral burden. Am J Epidemiol. 2010;1712:198–205. [DOI] [PMC free article] [PubMed] [Google Scholar]
- 17. Pinzone MR, Di Rosa M, Cacopardo B et al. HIV RNA suppression and immune restoration: can we do better? Clin Dev Immunol. 2012;2012:515962. [DOI] [PMC free article] [PubMed] [Google Scholar]
- 18. Nash D, Wu Y, Elul B et al. Program-level and contextual-level determinants of low-median CD4+ cell count in cohorts of persons initiating ART in eight sub-Saharan African countries. AIDS. 2011;2512:1523–1533. [DOI] [PMC free article] [PubMed] [Google Scholar]
- 19. World Health Organization. Scaling Up Antiretroviral Therapy in Resource-Limited Settings: Treatment Guidelines for a Public Health Approach. Geneva, Switzerland: World Health Organization; 2003. http://www.who.int/hiv/pub/prev_care/en/arvrevision2003en.pdf. Accessed October 2, 2015. [Google Scholar]
- 20. Katabira ET, Kamya MR, eds. National Antiretroviral Treatment and Care Guidelines for Adults and Children. Kampala, Uganda: Uganda Ministry of Health; 2003. http://apps.who.int/medicinedocs/documents/s16200e/s16200e.pdf. Accessed October 2, 2015. [Google Scholar]
- 21. Kamya MR, Mayanja-Kizza H, Kambugu A et al. Predictors of long-term viral failure among Ugandan children and adults treated with antiretroviral therapy. J Acquir Immune Defic Syndr. 2007;462:187–193. [DOI] [PubMed] [Google Scholar]
- 22. Castelnuovo B, Manabe YC, Kiragga A et al. Cause-specific mortality and the contribution of immune reconstitution inflammatory syndrome in the first 3 years after antiretroviral therapy initiation in an urban African cohort. Clin Infect Dis. 2009;496:965–972. [DOI] [PubMed] [Google Scholar]
- 23. Department of HIV/AIDS, World Health Organization. Access to Antiretroviral Drugs in Low- and Middle-Income Countries. Geneva, Switzerland: World Health Organization; 2014. http://www.iplusacademy.org/pluginfile.php/3580/mod_resource/content/1/Access_to_ARVs_in_low_and_middle_income_countries.pdf. Accessed February 15, 2015. [Google Scholar]
- 24. Therneau TM, Grambsch PM, eds. Modeling Survival Data: Extending the Cox Model. (Statistics for Biology and Health) New York, NY: Springer Publishing Company; 2000. [Google Scholar]
- 25. Eastburn A, Scherzer R, Zolopa AR et al. Association of low level viremia with inflammation and mortality in HIV-infected adults. PLoS One. 2011;611:e26320. [DOI] [PMC free article] [PubMed] [Google Scholar]
- 26. Zhang S, van Sighem A, Gras L et al. Clinical significance of transient HIV type-1 viraemia and treatment interruptions during suppressive antiretroviral treatment. Antivir Ther. 2010;154:555–562. [DOI] [PubMed] [Google Scholar]
- 27. Rubaihayo J, Tumwesigye NM, Konde-Lule J. Trends in prevalence of selected opportunistic infections associated with HIV/AIDS in Uganda. BMC Infect Dis. 2015;15:187. [DOI] [PMC free article] [PubMed] [Google Scholar]
- 28. Kowalkowski MA, Day RS, Du XL et al. Cumulative HIV viremia and non-AIDS-defining malignancies among a sample of HIV-infected male veterans. J Acquir Immune Defic Syndr. 2014;672:204–211. [DOI] [PMC free article] [PubMed] [Google Scholar]
- 29. Lima VD, Sierra-Madero J, Wu Z et al. Comparing the efficacy of efavirenz and boosted lopinavir using viremia copy-years. J Int AIDS Soc. 2014;17:18617. [DOI] [PMC free article] [PubMed] [Google Scholar]
- 30. Saracino A, Monno L, Scudeller L et al. X4 viruses are frequently archived in patients with long-term HIV infection but do not seem to influence the “inflamm-aging” process. BMC Infect Dis. 2013;13:220. [DOI] [PMC free article] [PubMed] [Google Scholar]
- 31. Mugavero MJ, Amico KR, Westfall AO et al. Early retention in HIV care and viral load suppression: implications for a test and treat approach to HIV prevention. J Acquir Immune Defic Syndr. 2012;591:86–93. [DOI] [PMC free article] [PubMed] [Google Scholar]
- 32. Ford ES, Puronen CE, Sereti I. Immunopathogenesis of asymptomatic chronic HIV infection: the calm before the storm. Curr Opin HIV AIDS. 2009;43:206–214. [DOI] [PMC free article] [PubMed] [Google Scholar]
- 33. Quinn TC, Wawer MJ, Sewankambo N et al. Viral load and heterosexual transmission of human immunodeficiency virus type 1. Rakai Project Study Group. N Engl J Med. 2000;34213:921–929. [DOI] [PubMed] [Google Scholar]
- 34. Lingappa JR, Hughes JP, Wang RS et al. Estimating the impact of plasma HIV-1 RNA reductions on heterosexual HIV-1 transmission risk. PLoS One. 2010;59:e12598. [DOI] [PMC free article] [PubMed] [Google Scholar]
- 35. Cohen MS, Shaw GM, McMichael AJ et al. Acute HIV-1 infection. N Engl J Med. 2011;36420:1943–1954. [DOI] [PMC free article] [PubMed] [Google Scholar]
- 36. Barnabas RV, Webb EL, Weiss HA et al. The role of coinfections in HIV epidemic trajectory and positive prevention: a systematic review and meta-analysis. AIDS. 2011;2513:1559–1573. [DOI] [PMC free article] [PubMed] [Google Scholar]
- 37. Fung IC-H, Gambhir M, van Sighem A et al. The clinical interpretation of viral blips in HIV patients receiving antiviral treatment: are we ready to infer poor adherence? J Acquir Immune Defic Syndr 2012;601:5–11. [DOI] [PubMed] [Google Scholar]
- 38. Hunt PW. HIV and inflammation: mechanisms and consequences. Curr HIV/AIDS Rep. 2012;92:139–147. [DOI] [PubMed] [Google Scholar]
Associated Data
This section collects any data citations, data availability statements, or supplementary materials included in this article.