Abstract
We experimentally analyze the signal-to-noise ratio of continuous wave (CW) near infrared spectroscopy (NIRS) reflectance systems based on light emitting diodes and silicon photomultipliers for high performance low cost NIRS biomedical systems. We show that under suitable experimental conditions such systems exhibit a high SNR, which allows an SDS of 7 cm, to our knowledge the largest ever demonstrated in a CW-NIRs system.
OCIS codes: (120.3890) Medical optics instrumentation; (040.6040) Silicon; (230.5160) Photodetectors; (290.1350) Backscattering; (300.6340) Spectroscopy, infrared; (110.0113) Imaging through turbid media
1. Introduction
Near Infrared Spectroscopy (NIRS) is a generalised term used to specify a non invasive optical technology for monitoring in real time local hemodynamic changes in human tissues. The principle of NIRS is based on the relative transparency of tissues in the near-infrared spectrum. In this wavelength range the light absorption is mainly due to the oxy and de-oxy haemoglobin (O2Hb and HHb, respectively) of the blood. Photons when passing through the human tissues, including bones and the skull, are heavily scattered. Therefore, a detector, placed relative close on the same body area to the light source, can collects the back-scattered photons, being their travel similar to a banana-shaped pathway. The information carried out by the re-emerging photons is related to the dynamical change of O2Hb and HHb concentrations in the blood [1–4].
In neuroscience research functional near-infrared spectroscopy and imaging (fNIRS/fNIRI) have become a widely used investigation methodology in the last 20 years, since cortical activity in the brain produces an increase of oxygen consumption and thus a variation of O2Hb and HHb concentration [5]. Numerous NIRS techniques and instruments have been developed [6–9]. The simplest requires two continuous wave light sources at two wavelengths, multiplexed at low frequency, and a photo-detector separated by a few centimetres from the sources (CW-NIRS) [10]. The variation of the O2Hb and HHb concentration in the blood is determined by measuring the time variation of the diffused light intensity at the two wavelengths, by using either a modified Beer-Lambert law or a light diffusion model [9]. CW instruments are less expensive compared to the more complex time domain or frequency domain NIRS systems, which require a picosecond pulsed or radio frequencies modulated light source respectively and measure, in addition to the intensity, the time of flight or the phase of light after passing through the tissue respectively. CW-NIRs systems are then suitable for miniaturization and portability. These advantages have led to the fabrication of instruments with multiple sources and detectors for topographic imaging of the real time hemodynamics based on CW-NIRS [10]. Nevertheless, CW instruments have the limitation of monitoring relative variations in the concentration of O2Hb and HHb, while phase or time resolved instruments allow absolute quantification. This drawback has a minor impact in neuroscience applications, where the significant signals are simply the variations in response to the brain activity [11,12].
CW-fNIRS instruments require to increase the Source Detector Separation (SDS) [10,13–15], since a larger SDS allows to study deeper tissue regions, and therefore, a larger cortical volume. This is particularly important since photons traveling through deeper tissue volumes carry more information on the brain activity. A typical human head has, in fact, a layered structure: the thick skin/skull layer protect the folded cortex layer, that is grey matter, suspended in cerebral spinal fluid (CSF), with a white underlying matter layer. Each layer has different optical properties. In human, the cortex has a typical thickness of 2-4 mm, and due to its folded layer has a variable depth from the skin (1-7 cm). However, the increase of the SDS requires higher sensitivity for light detection, in order to achieve a high signal to noise ratio (SNR).
State of art commercial fNIRS and fNIRI instruments have a SDS in the 20-40 mm range [7,10]. The most used detectors are photomultiplier tubes (PMTs), photodiodes (PDs) and avalanche photodiode (APDs). Among these, the PMT is certainly the most sensitive, but it suffers of several disadvantages: it is bulky, fragile, vulnerable to overexposure, sensitive to magnetic fields, and it requires high bias voltages (500-1500 V). It cannot be used in wearable and portable instruments. PDs and APDs, being semiconductor detectors, have the advantage of small size, lightness, insensitivity to magnetic fields, and lower operating voltage (typical 0-5V for PDs and 50-150V for APDs). However, their sensitivity to weak light signals is lower than PMTs, limiting the achievable SDS to about 20-40 mm. To further improve the SDS with high SNR, the choice of the detector is critical. Among the numerous possibilities, the Silicon Photomultiplier (SiPM) appears a particularly promising alternative for CW-fNIRS instruments [10,16,17]. The SiPM is a pixelated photodetector of APDs working in Geiger Mode. The pixels, APDs with integrated resistances in series, are connected in parallel trough a metal grid, and reverse biased at a voltage higher than the breakdown voltage. The detection principle is based on the photon absorption, followed by the triggering of an avalanche breakdown which gives raise to a fast current pulse, proportional in amplitude to the number of fired pixels. Compared to the other semiconductor photodetectors the SiPM presents major advantages of sensitivity, high internal gain, and speed of response [18–21]. Compared to PMTs the SiPM is much more compact, easy to handle, much lower operating voltage, mechanically robust, optically resistant, and electrically reliable. The potential advantage of SiPMs in NIRS has been described in [16]. In this work it was shown that a miniaturized NIRS instrument, assembled with a two-colour LED sources and a SIPM detector can reach a sufficient SNR up to an SDS of 50 mm, i.e. about 70% larger than the commonly used SDS.
In this paper, we systematically investigate the achievable SNR, maximum SDS, and minimum optical source power required for a CW-NIRs system based on a LED source and a SiPM detector.
For this purpose we measure the SiPM response in a plastic phantom which emulates the optical absorption and scattering of a human head, for different SDS between 20 and 70 mm, and for different source optical powers and repetition rates. Experimental results are compared to the expected optical signals calculated by Monte Carlo simulations and to the minimum required SNR. Particular attention has been devoted to maintain the SiPM in its linear response range of operation.
2. Experimental
2.1 SiPM detector
The SiPM used in this work, fabricated by STMicroelectronics, consists of 50 × 50 pixels. The pixel active area is 40 × 40 μm2, the filling factor (FF) is 62%, and the total device area is 6.45 mm2 [22,23]. The SiPM devices were fabricated by using highly doped p + (100) oriented Si substrates with a p-type epitaxy. A p + enrichment region was obtained through boron ion implantation. Such enrichment defines both the device active area and the Breakdown Voltage (BV). The anode is contacted from the backside, while the cathode is fabricated through diffusion from a heavily As doped polycrystalline silicon layer deposited on top. The quenching resistor of 220 kΩ, needed for device Geiger mode operation, fabricated in doped polycrystalline silicon, is integrated directly in contact to the cathode. Optical isolation trenches filled with oxide and metal surround the pixel active area in order to reduce electro-optical coupling effects (crosstalk) between adjacent pixels. An anti-reflection coating is integrated on the top surface. The main parameters of such SiPM devices are summarized in Table 1.
Table 1. SiPM parameters at −27°C.
| Pixels no. | 50 × 50 |
|---|---|
| Pixel active dimension (μm) | 40 × 40 |
| Filling Factor | 0.62 |
| BV (V) | −27.7 ± 0.1 |
| Dark currents (A)a | 0.8 × 10⁻⁶ |
| Gaina | 6 × 10⁵ |
Measured at VBIAS = −30V.
The SiPM responsivity and dynamic range in CW regime were measured and the results compared with those of a commercial PD (Hamamatsu S1337–1010BQ – 100mm2) and of an APD (Hamamatsu S2385 – 19.6 mm2).
Responsivity measurements were carried out with a Bentham PVE330 in the 300-1100 nm spectral range. To prevent SiPM saturation neutral optical filters (OD = 5dB) were employed to limit the source light intensity.
The CW dynamic range of detectors was determined at 660 nm (Coherent Cube 660 laser), by measuring the photo-current as a function of the source light power in the range 0.5 pW/cm2 to 10 mW/cm2. The source power was calibrated by using a laser power meter (Coherent FieldMax II). The detector currents were acquired by using a Keithley 2602A with 0.5s integration time. Dark current was subtracted offline.
2.2 CW-NIRS experimental setup
The plastic phantom emulating the human brain tissues was realized by INO Biomimic Optical Phantom division [24]. It consists in a cylinder with four different layers that mimic the optical properties of the different layers of a human brain: the scalp-skull matter, the cerebral spinal fluid, the grey matter and the white matter. The phantom is made of polyurethane, which provides long term stability. Small particles of TiO2 were used as the scattering agents, while carbon black as absorbing dye. The thickness and the optical properties of the four layers are summarized in Table 2 and an image of the phantom is shown in Fig. 1. The absorption coefficients μa and the effective scattering coefficients μs′ of the four layers have been measured by the producer using the time resolved transmittance method [25] at a wavelength of 850 nm on samples with a thickness of 2 cm, while their value at 735 nm was extrapolated from the datasheet [24].
Table 2. Optical phantom parameters.
| 735 nm |
850 nm |
|||||
|---|---|---|---|---|---|---|
| Layer # | Thichness (mm) |
μa (mm−1) |
μs’ (mm−1) |
μa (mm−1) |
μs’ (mm−1) |
|
| L1 (Skull) | 10 | 0.021 | 0.939 | 0.019 | 0.904 | |
| L2 (CSF) | 2 | 0.001 | 0.025 | 0.001 | 0.025 | |
| L3 (Gray Matter) | 4 | 0.019 | 0.612 | 0.017 | 0.577 | |
| L4 (White Matter) | 80 | 0.013 | 0.965 | 0.011 | 0.930 | |
Fig. 1.
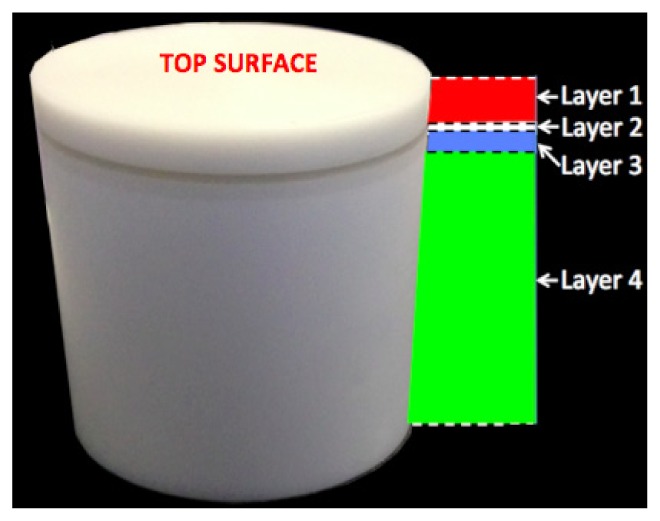
Image of the Phantom.
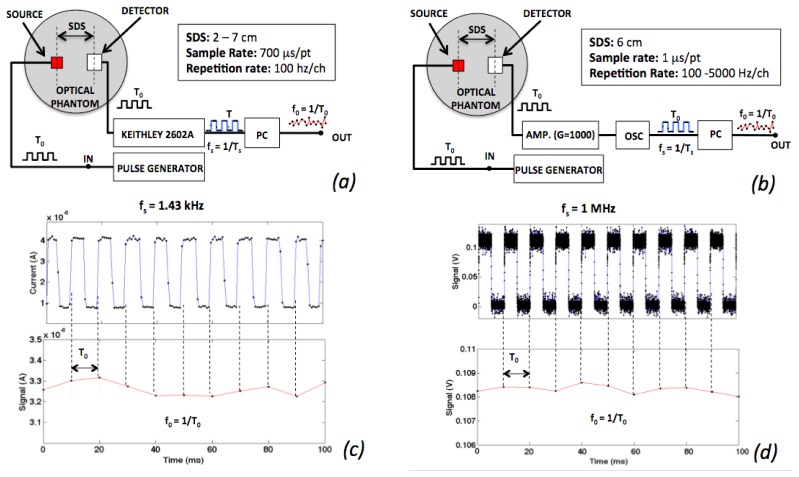
Figure 2 shows the two experimental setups used to measure the optical signal and the SNR. The optode (light source / detector pair), the same for both setups, is formed by two LEDs operating at 735 nm and 850 nm wavelength (EPITEX 735 / 850) and a SiPM detector as above described. The LEDs and the SiPM were soldered on two small separated PCBs with BNC output connections for instrument interfacing. Each PCB was mounted on a mechanical support anchored to a 3-axial micro-positioner in order to adjust the SDS between 2 cm and 7 cm with an accuracy of 100 μm. A 4 mm thick black silicone o-ring, glued on each PCB surface, shields the LEDs and the SiPM detector from lateral light diffusion and improves the contact to the plastic phantom surface.
Fig. 2.
SNR experimental setup: (a) SNR vs. SDS setup at constant repetition rate (f0 = 100Hz); (b) SNR vs. repetition rate (f0) setup at constant SDS (6 cm).
LEDs in both setups were turned on and off at a constant 50% Duty Cycle (DC), by controlling the current with a pulse generator (Agilent 81100A). The LED peak current was varied in the 5 mA - 40 mA range. The corresponding optical mean power, measured using a laser power meter (Coherent Field Max II) was ∼4 mW and ∼8 mW for the LED at 735 nm and 850 nm at 40 mA, respectively. The corresponding mean power density at the phantom surface was estimated to be ∼200 mW/cm2 and ∼400 mW/cm2 for the 735 nm and the 850 nm LED, respectively. These values are in the range typically used by fNIRs instruments [10].
In the first setup (Fig. 2(a)), the SDS was varied in the 2—7 cm range with 1 cm step. The LED ON-OFF repetition period (T0) was constant and the repetition rate (f0 = 1/T0) was 100 Hz per Channel, where each Channel corresponds to one LED. The photocurrent produced by the SiPM was measured by using a Keithley 2602A Source-Measure Unit. The sampling rate was 700 μs/pt, limited by the time latencies to store the data in the internal buffer of the SMU. At the end of each measurements cycle, the stored SiPM currents were acquired trough GPIB into a PC for offline analysis.
The second setup (Fig. 2(b)) allowed to vary the cycle frequency f0 in the range from 100 Hz to 5 kHz at a fixed SDS of 6 cm. The SiPM currents were amplified by a factor of 10,000 by using a Keithley 428 Current Amplifier with 1 MHz band and then acquired using a 1 GHz Tektronix TPO7500 Oscilloscope. The sampling rate was constant (1 μs/pt) in each measurement. The data stored by the OSC were acquired through GPIB into a PC for offline analysis.
Figures 2(c) and 2(d) show the raw signals measured with the two described setups (upper plot) and the post processed optical signals (lower plots), indicated in the following as s and S, respectively. The data point of S is defined as the difference between the average raw signal measured for each LED in the ON semi-cycle subtracted by the average raw signal measured for each LED in the OFF semi-cycle. For example, in Fig. 2(c) the optical signal has one data point every 10 ms (LED ON-OFF repetition period T0) per each LED channel.
Each data point of S was acquired 100 times at each wavelength. No multiplexing between channels was used so the signals at 735nm and 850 nm wavelength were acquired sequentially.
The SNR measured in the two described setups was defined as 20log10(mS/σS), where σS is the standard deviation of the data points S with average mS. SNR was measured for 10 times and so that the average value and the standard deviation have been calculated.
SNR measurements have been carried out using the phantom in two different configurations, with sources and detector in contact either with the back or with the front surface. In the first configuration, similarly to a previously published experiment [16], the phantom results as a homogenous turbid media with μa and μs′ of the 4th layer (Table 2). In the second configuration the phantom emulates a more realistic human head, with four layers (skull-scalp, CSF, grey and white matter) having their appropriate optical properties [26–28] and then the obtained results are closer to the real case.
3. Modelling
The mS values as a function of the SDS were compared to Monte Carlo (MC) simulations. The MC calculations were performed using the open access multi-layered 2D simulator developed by L. Wang and S. L. Jacques [29, 30] provided at [31] using the optical parameters of Table 2, with an anisotropy factor g = 0.62 and refractive indexes n1 = 1 (air) and n2 = 1.521 (polyurethane) for the external ambient and the phantom medium, respectively [24, 25]. The step size was 100 μm and the simulated number of photons equal to 1,000,000.
The variation of O2Hb and HHb concentration occurs in response to a functional brain activity. This implies a variation Δμ of the extinction coefficient which produces a change of optical signal, from Sth0 to Sth1.
The theoretical value of the Sth1 / Sth0 ratio according to the MBLL is:
| (1) |
where DPF is the Differential Pathlength Factor.
The minimum SNR (SNRMIN) required to resolve the optical signal variation is evaluated as:
| (2) |
where σmax should be at least one third of the optical signal variation, i.e., σmax = (Sth1-Sth0)/3σS, in order to adequately detect the variations in the O2Hb and HHb concentration. By simple calculation we find:
| (3) |
SNRMIN, from Eq. (3), was calculated assuming a change in concentration of the O2Hb and HHb of 1 μM and −0.25 μM, respectively [5], and the extinction coefficients and the DPF taken from [32] and [33], respectively, for 735 nm and 850 nm wavelengths.
4. Results and discussion
The responsivity of the SiPM biased at −30 V (OV = 2.2 V and G≈6 × 10⁵) is shown in Fig. 3, compared to those of a silicon APD (Hamamatsu S3884) operating at −141 V (G≈100) and of a silicon photodiode (Hamamatsu S1337–1010BQ) operating at 0 V (red line). The SiPM shows the maximum responsivity in the red region (peaked at 670 nm with a value of 2.3 × 10⁵ AW−1nm−1) and an excellent response in the NIR wavelength region of interest (700–900 nm), larger than 5 × 10⁴ AW−1nm−1. SiPM responsivity is comparable with that of traditional vacuum tube PMTs and not reachable by other silicon detectors, thanks to its high internal gain and good quantum efficiency .
Fig. 3.
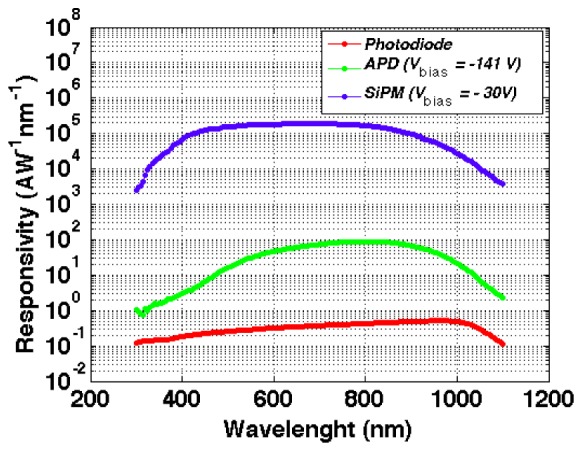
Comparisons of the responsivity vs. wavelength at −27°C of some silicon detectors (blue line STMicroelrctronics SiPM, green line Hamamtsu S3884 APD, red line Hamamatsu S1337–1010BQ Photodiode).
For a CW light source, in the linear regime, with a photon current fPH (photons/sec), the photocurrent IP is given by:
| (4) |
where q is the electron charge, G the gain, and PDE the photon detection efficiency. The SiPM response is linear until the incident photon flux is below the number of pixels within the characteristic pixel RC recharge time during which the pixel is blind to the arrival of new photons.
Figure 4 shows the SiPM photocurrent as a function of the optical power density produced by a CW laser at 660 nm. The linear range is roughly 5 decades, from 250 fW/cm2 to 0.5 nW/cm2. The corresponding photocurrent are 40 nA and 2 mA, respectively.
Fig. 4.
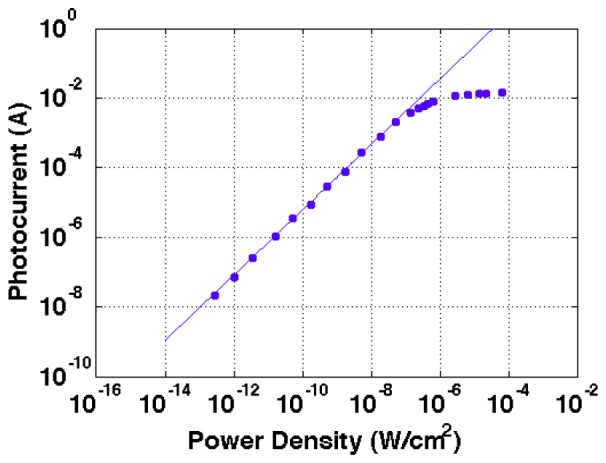
Photocurrent vs Power Density of the STMicroelectronics SiPM biased at −30V and at −27°C in response to a laser source with 660 nm wavelength.
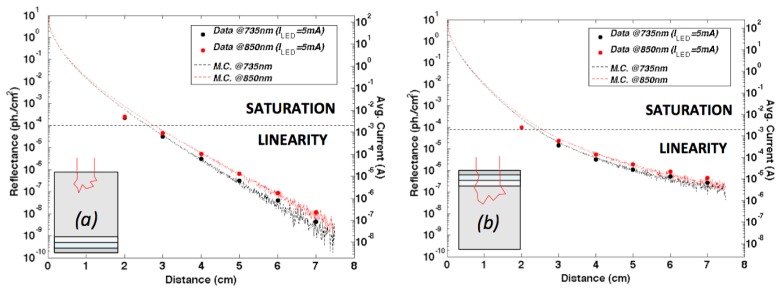
Figure 5 shows the NIRS reflectance at wavelengths of 735 nm and 850 nm as a function of SDS in the case of configuration 1 (Fig. 5(a)) and 2 (Fig. 5(b)), as above described (see insets), respectively. Data (points) and MC calculations (lines) are reported and compared. The MC calculations are performed by using the phantom parameters of Table 2. In all cases the LED pump currents are the same and equal to 5 mA. Note that for low distances the SIPM device is in saturation (indicated in figure), so the only part of the plots where significant analysis can be performed is for large SDS, approximately > 3 cm in the present experimental configuration. In the case of configuration 1 the expected reflectance behaviour is an almostperfect exponential trend with SDS, while in configutation 2 the trend in this semilogarithmic scale has curvature with upside concavity. Experimental data are in excellent agreement with
Fig. 5.
Comparisons between the expected optical signal and the measured average signal ms for (a) the 1st and (b) the 2nd phantom configuration as shown in the inset.
MC calculations in the region of SiPM linearity. It is extremely important to underline that when the sample has a structure with multilayers the trend is different compared to the case of single layer and that a larger reflectance is measured. Such circumstance indicates that the use of large SDS values is highly desirable since it allows to detect the layered structures of the sample under test and therefore it demonstrates the capability to investigate deeper regions of the sample.
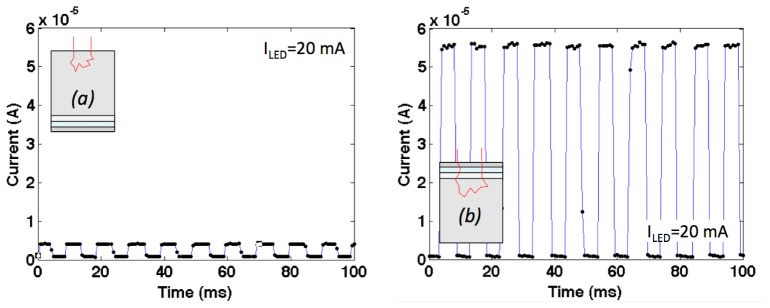
Figure 6 shows the raw SiPM current signal s as a function of time at the 6 cm SDS for the phantom configuration 1 (Fig. 6(a)) and 2 (Fig. 6(b)), respectively, by using a 735 nm LED (the worst case wavelength for the minimum SNR requirement) pumped with 20 mA current. The large difference between the two raw signals is evident, and this confirms the extremely large sensitivity of the proposed system at large SDS. In both cases anyway the detector
Fig. 6.
Raw signal s measured at a SDS of 6 cm in response to a source 735nm LED pumped at 20 mA for (a) the 1st and (b) the 2nd phantom configuration.
currents are high (>1μA), thanks to the large internal amplification of the SiPM. This indicates the possibility to fabricate simple, low cost, and miniaturized data readout without the need for elaborated and complex ultra-low noise circuitry even at large SDS.
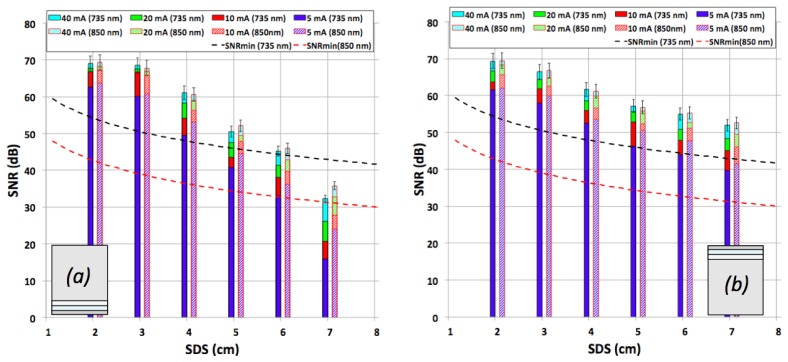
Figure 7 shows the measured SNR values for the different SDSs in the two configurations, together with the calculated lower bound SNR values (dashed lines, evaluated by Eq. (3)) for both wavelengths. For configuration 1, the maximum SDS, up to which sufficient SNR is achieved is roughly 5 cm, while for configuration 2, it is ≥ 7 cm.
Fig. 7.
SNR vs. SDS for a repetition rate of 100 Hz per channel measured for (a) the 1st and (b) the 2nd phantom configuration as shown in the inset.
Figure 8 shows the experimental SNR at 6 cm SDS and 735 nm wavelength, the worst wavelength case for the SNR requirement, as a function of the repetition rate f0 at a number of LED pump current levels. The minimum SNR, evaluated according to Eq. (3) is reported as a horizontal dashed line. It is evident that for sufficiently large LED pump currents (≥ 20 mA) the experimental SNR is above the minimum SNR for frequencies till a few kHz (2 kHz at 40 mA).
Fig. 8.
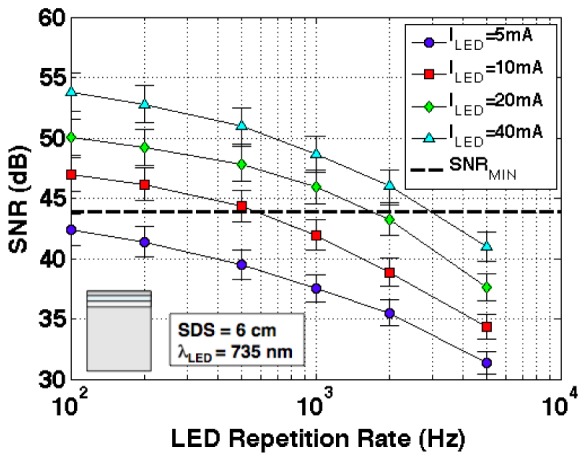
SNR vs. repetition rate (f0), at different LED pump currents, measured for the 2nd phantom configuration, as shown in the inset, at a SDS of 6 cm and for the 735 nm LED.
Overall, for the case of configuration 1, our estimates of maximum SDS, for a LED pump current of 40 mA, is twice compared to the value in [10], and in agreement with the results of [16]. For the case of configuration 2, our value of maximum SDS, assuming a minimum required SNR of about 45 dB, is more than double than the commonly used 3 cm [10]. The repetition rate of 100 Hz is, compared to the relatively slow hemodynamics, absolutely sufficient. To our knowledge this is the highest SDS ever proposed in a CW-NIRS system.
Furthermore, the excellent SNR measured at a repetition rate of 2 kHz and 6 cm SDS, pumping the LED at current level in the range of commercial CW-NIRS instruments, shows the potentiality, using the SiPM, to design a compact and low cost imagining system with hundreds of optodes with a sensing penetration depth capability never reached by commercial NIRI system.
5. Conclusion
We have shown that the SDS up to which sufficient SNR is experimentally found is about 6 cm for configuration 1 (uniform phantom) while it is about 7 cm in configuration 2 (multilayered phantom) which is more representative of the real case of human brain. Moreover, the SNR at SDS 6 cm is high enough even at a repetition rate o few kHz for LED pump current in the range of commercial CW-NIRS system. We have shown that the proposed use of silicon photomultipliers in functional near-infrared spectroscopy allows a large potential for future development of precise, low-cost, compact and modular functional CW-NIRS instrument with high SNR even at a SDS of 7 cm.
References and links
- 1.Owen-Reece H., Smith M., Elwell C. E., Goldstone J. C., “Near infrared spectroscopy,” Br. J. Anaesth. 82(3), 418–426 (1999). 10.1093/bja/82.3.418 [DOI] [PubMed] [Google Scholar]
- 2.Rolfe P., “In Vivo Near-Infrared Spectroscopy,” Annu. Rev. Biomed. Eng. 2(1), 715–754 (2000). 10.1146/annurev.bioeng.2.1.715 [DOI] [PubMed] [Google Scholar]
- 3.Ferrari M., Mottola L., Quaresima V., “Principles, techniques, and limitations of near infrared spectroscopy,” Can. J. Appl. Physiol. 29(4), 463–487 (2004). 10.1139/h04-031 [DOI] [PubMed] [Google Scholar]
- 4.Murkin J. M., Arango M., “Near-infrared spectroscopy as an index of brain and tissue oxygenation,” Br. J. Anaesth. 103(Suppl 1), i3–i13 (2009). 10.1093/bja/aep299 [DOI] [PubMed] [Google Scholar]
- 5.Wolf M., Wolf U., Toronov V., Michalos A., Paunescu L. A., Choi J. H., Gratton E., “Different time evolution of oxyhemoglobin and deoxyhemoglobin concentration changes in the visual and motor cortices during functional stimulation: a near-infrared spectroscopy study,” Neuroimage 16(3), 704–712 (2002). 10.1006/nimg.2002.1128 [DOI] [PubMed] [Google Scholar]
- 6.Gibson A. P., Hebden J. C., Arridge S. R., “Recent advances in diffuse optical imaging,” Phys. Med. Biol. 50(4), R1–R43 (2005). 10.1088/0031-9155/50/4/R01 [DOI] [PubMed] [Google Scholar]
- 7.Wolf M., Ferrari M., Quaresima V., “Progress of near-infrared spectroscopy and topography for brain and muscle clinical applications,” J. Biomed. Opt. 12(6), 062104 (2007). 10.1117/1.2804899 [DOI] [PubMed] [Google Scholar]
- 8.Ferrari M., Quaresima V., “A brief review on the history of human functional near-infrared spectroscopy (fNIRS) development and fields of application,” Neuroimage 63(2), 921–935 (2012). 10.1016/j.neuroimage.2012.03.049 [DOI] [PubMed] [Google Scholar]
- 9.Strangman G., Boas D. A., Sutton J. P., “Non-invasive neuroimaging using near-infrared light,” Biol. Psychiatry 52(7), 679–693 (2002). 10.1016/S0006-3223(02)01550-0 [DOI] [PubMed] [Google Scholar]
- 10.Scholkmann F., Kleiser S., Metz A. J., Zimmermann R., Mata Pavia J., Wolf U., Wolf M., “A review on continuous wave functional near-infrared spectroscopy and imaging instrumentation and methodology,” Neuroimage 85(Pt 1), 6–27 (2014). 10.1016/j.neuroimage.2013.05.004 [DOI] [PubMed] [Google Scholar]
- 11.Villringer A., Chance B., “Non-Invasive optical spectroscopy and imaging of human brain function,” Trends Neurosci. 20(10), 435–442 (1997). 10.1016/S0166-2236(97)01132-6 [DOI] [PubMed] [Google Scholar]
- 12.Obrig H., “NIRS in clinical neurology - a ‘promising’ tool?” Neuroimage 85(Pt 1), 535–546 (2014). 10.1016/j.neuroimage.2013.03.045 [DOI] [PubMed] [Google Scholar]
- 13.Harris D. N. F., Cowans F. M., Wertheim D. A., Hamid S., “NIRS in Adults - Effects of Increasing Optode Separation,” Adv. Exp. Med. Biol. 345, 837–840 (1994). 10.1007/978-1-4615-2468-7_109 [DOI] [PubMed] [Google Scholar]
- 14.Delpy D. T., Cope M., “Quantification in tissue near-infrared spectroscopy,” Philos. Trans. R. Soc. Lond. B Biol. Sci. 352(1354), 649–659 (1997). 10.1098/rstb.1997.0046 [DOI] [Google Scholar]
- 15.Germon T. J., Evans P. D., Barnett N. J., Wall P., Manara A. R., Nelson R. J., “Cerebral near infrared spectroscopy: emitter-detector separation must be increased,” Br. J. Anaesth. 82(6), 831–837 (1999). 10.1093/bja/82.6.831 [DOI] [PubMed] [Google Scholar]
- 16.Zimmermann R., Braun F., Achtnich T., Lambercy O., Gassert R., Wolf M., “Silicon photomultipliers for improved detection of low light levels in miniature near-infrared spectroscopy instruments,” Biomed. Opt. Express 4(5), 659–666 (2013). 10.1364/BOE.4.000659 [DOI] [PMC free article] [PubMed] [Google Scholar]
- 17.Sanfilippo D., Valvo G., Mazzillo M., Piana A., Carbone B., Renna L., Fallica P. G., Agrò D., Morsellino G., Pinto M., Canicattì R., Galioto N., Tomasino A., Adamo G., Stivala S., Parisi A., Curcio L., Giaconia C., Busacca A. C., Pagano R., Libertino S., Lombardo S., “Design and development of a fNIRS system prototype based on SiPM detectors,” Proc. SPIE 8990, 899016 (2014). [Google Scholar]
- 18.Buzhan P., Dolgoshein B., Ilyin A., Kantserov V., Kaplin V., Karakash A., Pleshko A., Popova E., Smirnov S., Volkov Yu., Filatov L., Klemin S., Kayumov F., “An advanced study of silicon photomultiplier,” ICFA Instr. Bull. 23, 28–41 (2001). [Google Scholar]
- 19.Finocchiaro P., Pappalardo A., Cosentino L., Belluso M., Billotta S., Bonanno G., Carbone B., Condorelli G., Di Mauro S., Fallica G., Mazzillo M., Piazza A., Sanfilippo D., Valvo G., “Characterization of a novel 100-channel silicon photomultiplier—Part II: charge and time,” IEEE Trans. Electron. Dev. 55(10), 2765–2773 (2008). 10.1109/TED.2008.2003235 [DOI] [Google Scholar]
- 20.Renker D., Lorenz E., “Advances in solid state photon detectors,” J. Inst. 4, P04004 (2009). [Google Scholar]
- 21.Mazzillo M., Condorelli G., Sanfilippo D., Valvo G., Carbone B., Piana A., Fallica G., Ronzhin A., Demarteau M., Los S., Ramberg E., “Timing performance of large area silicon photomultiplier fabricated at STMicroelectronics,” IEEE Trans. Nucl. Sci. 57(4), 2273–2279 (2010). 10.1109/TNS.2010.2049122 [DOI] [Google Scholar]
- 22.M. Mazzillo, F. Nagy, D. Sanfilippo, G. Valvo, B. Carbone, A. Piana, and G. Fallica, “Silicon Photomultiplier Technology for Low-Light Intensity Detection” Proc. IEEE Sensors, (2013). [Google Scholar]
- 23.Pagano R., Corso D., Lombardo S., Valvo G., Sanfilippo D. N., Fallica G., Libertino S., “Dark current in silicon photomultiplier pixels: data and model,” IEEE Trans. Electron. Dev. 59(9), 2410–2416 (2012). 10.1109/TED.2012.2205689 [DOI] [Google Scholar]
- 24.Fantôme Optique Biomimic, http://www.ino.ca/fr/produits/fantôme-optique-biomimic/.
- 25.Bouchard J. P., Veilleux I., Jedidi R., Noiseux I., Fortin M., Mermut O., “Reference optical phantoms for diffuse optical spectroscopy. Part 1 - Error analysis of a time resolved transmittance characterization method,” Opt. Express 18(11), 11495–11507 (2010). 10.1364/OE.18.011495 [DOI] [PubMed] [Google Scholar]
- 26.Bevilacqua F., Piguet D., Marquet P., Gross J. D., Tromberg B. J., Depeursinge C., “In vivo local determination of tissue optical properties: applications to human brain,” Appl. Opt. 38(22), 4939–4950 (1999). 10.1364/AO.38.004939 [DOI] [PubMed] [Google Scholar]
- 27.Comelli D., Bassi A., Pifferi A., Taroni P., Torricelli A., Cubeddu R., Martelli F., Zaccanti G., “In vivo time-resolved reflectance spectroscopy of the human forehead,” Appl. Opt. 46(10), 1717–1725 (2007). 10.1364/AO.46.001717 [DOI] [PubMed] [Google Scholar]
- 28.Jacques S. L., “Optical properties of biological tissues: a review,” Phys. Med. Biol. 58(11), R37–R61 (2013). 10.1088/0031-9155/58/11/R37 [DOI] [PubMed] [Google Scholar]
- 29.Wang L., Jacques S. L., Zheng L., “MCML - Monte Carlo modeling of light transport in multi-layered tissues,” Comput. Methods Programs Biomed. 47(2), 131–146 (1995). 10.1016/0169-2607(95)01640-F [DOI] [PubMed] [Google Scholar]
- 30.Wang L., Jacques S. L., Zheng L., “CONV - Convolution for responses to a finite diameter photon beam incident on multi-layered tissues,” Comput. Methods Programs Biomed. 54(3), 141–150 (1997). 10.1016/S0169-2607(97)00021-7 [DOI] [PubMed] [Google Scholar]
- 31.Oregon Medical Laser Center , Monte Carlo Simulations, http://omlc.org/software/mc/.
- 32.Wray S., Cope M., Delpy D. T., Wyatt J. S., Reynolds E. O. R., “Characterization of the near infrared absorption spectra of cytochrome aa3 and haemoglobin for the non-invasive monitoring of cerebral oxygenation,” Biochim. Biophys. Acta 933(1), 184–192 (1988). 10.1016/0005-2728(88)90069-2 [DOI] [PubMed] [Google Scholar]
- 33.Duncan A., Meek J. H., Clemence M., Elwell C. E., Tyszczuk L., Cope M., Delpy D. T., “Optical pathlength measurements on adult head, calf and forearm and the head of the newborn infant using phase resolved optical spectroscopy,” Phys. Med. Biol. 40(2), 295–304 (1995). 10.1088/0031-9155/40/2/007 [DOI] [PubMed] [Google Scholar]


