Abstract
We designed and fabricated a novel terahertz (THz) otoscope to help physicians to diagnose otitis media (OM) with both THz diagnostics and conventional optical diagnostics. We verified the potential of this tool for diagnosing OM using mouse skin tissue and a human tympanic membrane samples prior to clinical application.
OCIS codes: (170.3890) Medical optics instrumentation; (170.6795) Terahertz imaging; (170.3880) Medical and biological imaging; (300.6495) Spectroscopy, terahertz; (170.6510) Spectroscopy, tissue diagnostics
1. Introduction
Individuals with hearing impairments can experience reduced quality of life associated with poor communication ability. Hearing impairments are prevalent in the U.S., affecting approximately 12.7% of the adult population (≥12 years old) and >50% of those over 65 [1]. The most common cause of hearing impairment in adults is the late diagnosis and inappropriate treatment of pediatric otitis media (OM) [2]. Therefore, accurate and early diagnosis for OM is very important to prevent subsequent hearing impairment.
OM encompasses everything that happens within the middle ear in response to inflammatory changes, such as organic changes, differences in the mucous membrane and epithelial cells, and bone destruction. Current diagnostics for OM are based on verifying the existence of tympanic membrane perforation and confirming the presence of pus in the middle ear using optical otoscopes or surgical optical microscopes. However, when changes to cells and organs can be visually verified, the disease is already significantly advanced. Moreover, the diagnostic accuracy of OM varies depending on the physician’s clinical experience. To overcome these problems, tympanometry [3] and novel optical methods such as optical coherence tomography (OCT) [4] have been used to diagnose OM. However, tympanometry has some limitations regarding diagnostic standardization and should be performed by an audiometry expert. OCT can diagnose OM by detecting a bacterial biofilm within the middle ear; however, it has not been confirmed that the development of biofilm occurs in the early stage of OM. The most common OM symptom is the presence of pus. The pus commonly comes into contact with the membrane [5, 6]. If a novel technology can detect pus in the middle ear, it could be used for the early and accurate diagnosis of OM.
Terahertz (THz) electromagnetic waves are highly sensitive to biomolecules and water; they have been applied to many biomedical applications [7–12] including diagnosing various types of cancer [13–17]. The fundamental reason for the use of THz waves in cancer diagnosis is that they sensitively interact with water molecules. Because water is a major constituent of pus, THz technology would also be feasible for OM diagnostics.
In this study, we designed and fabricated a novel THz otoscope to help physicians diagnose OM using both THz and conventional optical methods. We investigated the utility of THz diagnostics for OM using mouse skin and human tympanic membrane.
2. THz otoscope design and fabrication
The schematic diagram of the fabricated THz otoscope is shown in Fig. 1. The THz otoscope was designed by integrating a THz module with a commercial optical otoscope (piccolight, KaWe, Germany). The optical otoscope was largely maintained in its original shape to allow simultaneous use of conventional and THz diagnostics. A 2- × 1-cm hole was cut on the right side of the otoscope to allow THz module integration. The THz module was designed and fabricated to ensure that THz waves travel through an ear speculum and the tympanic cavity to detect THz wave reflection from the tympanic membrane. The total optical path is as follows: i) THz waves are generated from lateral photo-Dember currents in a forward direction from a semiconductor (Tx) [18], ii) THz waves are collimated by a hemispherical silicon lens and pass through a silicon splitter with 1/2-inch diameter and 3-mm thickness, iii) THz waves are reflected from indium tin oxide (ITO) glass that enables both optical and THz diagnostics since it is transparent in optical regime and is metallic in THz regime [19], iv) THz waves pass through an ear speculum with a 5-mm diameter hole and are reflected back from the tympanic membrane, v) reflected THz waves go back to a photoconductive antenna receiver (Rx) after reflecting from the ITO glass, silicon splitter, and metal plate. Tx and Rx are driven by femto-second laser pulses with optical fibers as we previously described [10].
Fig. 1.
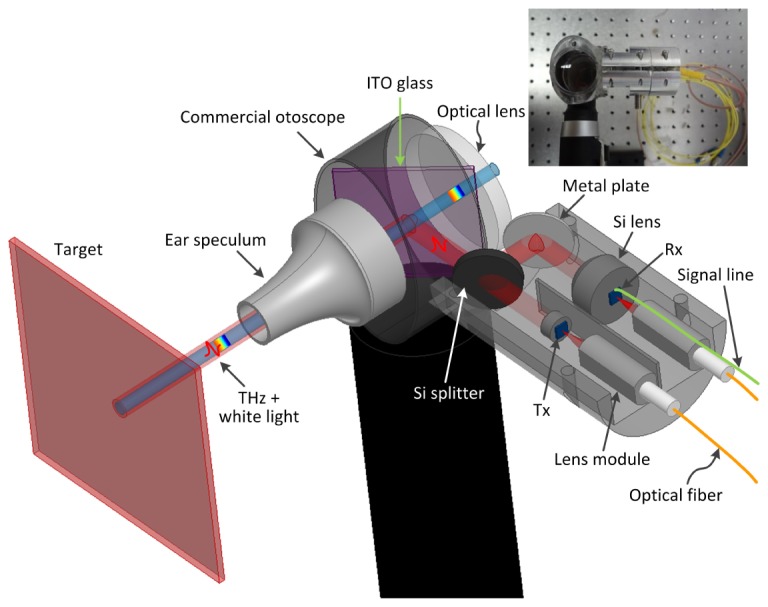
Schematic diagram of the THz otoscope. This integrated device comprised a commercial optical otoscope and fiber-coupled THz module. The inset is a photograph of the fabricated THz otoscope.
The most important consideration during THz otoscope development was the silicon lens for THz collimation. It should be designed to have minimal losses due to the ear speculum and THz wave divergence. A Zemax software program based on the ray trace method was therefore used in the design process. The shape of the silicon lens was selected as hemispheric for ease of fabrication, and the lens radius was determined to be 5-mm to allow passage through the 5-mm diameter ear speculum hole with minimal losses. The length of the optical path from Tx to Rx was 130 mm. Two hypothetical apertures with a 5-mm diameter derived from the ear speculum were located at each 40-mm (outgoing position) and 90-mm point (incoming position) in the optical path. Because the shape and radius were fixed, the collimation form of the THz waves depends on the lens height. The simulation of ray tracing for THz waves was performed at 1-THz frequency. The maximum ray angle was 34° in our simulation because THz waves over a ray angle of 35° were blocked by two hypothetical apertures for any lens height. The root-mean-square (RMS) beam diameters of THz waves for different silicon lens heights along the optical path length are shown in Fig. 2. Finally, the optimal silicon lens dimension for THz wave collimation was chosen to have a 5-mm radius and 2.92-mm height to allow minimal losses and beam divergence. The silicon lens for Rx was larger than that for Tx to effectively detect the THz signal.
Fig. 2.
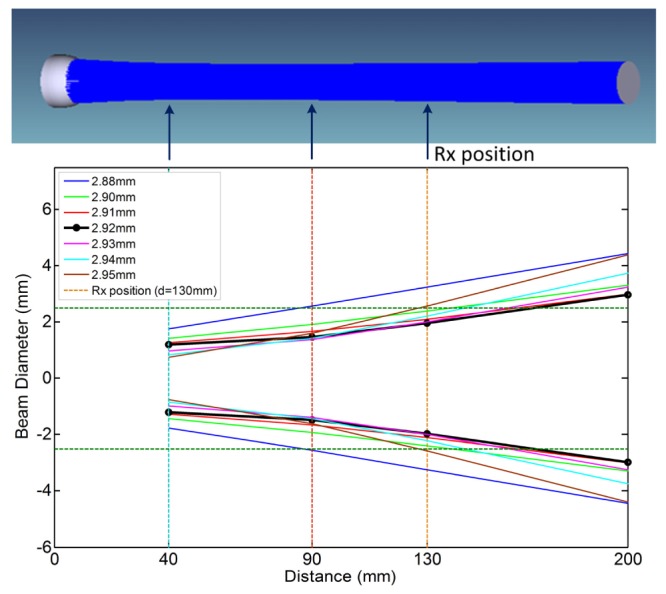
Propagation profile of THz wave optical paths depending on the Tx silicon lens height. The simulation was performed using the Zemax optical-design program.
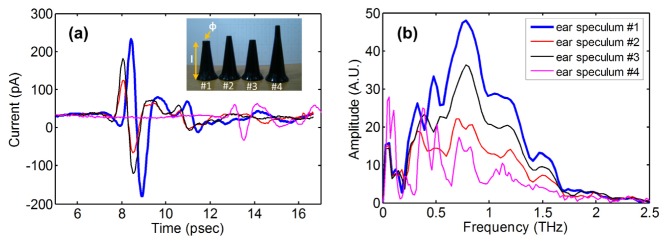
During practical inspection for OM diagnosis, physicians usually use disposable ear-specula such as that shown in the inset of Fig. 3(a). We assessed difference in THz signal with four types of commercial ear specula (HEINE optotechnik Gmbh & Co. KG). The lengths of ear specula shown in the inset of Fig. 3(a) were 2.9, 3.3, 2.9, and 4.1 cm, and the end diameters were 5, 3, 4, and 2.3 mm, respectively. To obtain reference THz signals, a metal plate was placed 6 mm from the end of the ear speculum since that is the usual distance from the tympanic membrane during examination. The time-domain signals and their spectra are shown in Fig. 3(a) and 3(b), respectively. We were able to obtain the maximum THz signals when ear speculum #1 was used, which has the largest end-tip diameter and shortest length. We also measured a primary reference THz signal using the otoscope. The peak-to-peak amplitude of the signal was 462 pA, and the spectrum extends up to 2 THz as shown in Fig. 3 (thick blue line).
Fig. 3.
Alteration of THz pulses with different ear specula. The L and phi dimensions of these specula are as follows: #1) 2.9 cm, 5 mm; #2) 3.3 cm, 3 mm; #3) 2.9 cm, 4 mm; and #4) 4.1 cm, 2.3 mm. (a) Time-domain signals and (b) their spectra. The maximum THz signal (thick blue line) was obtained with ear speculum #1.
3. Definition of THz diagnostics for OM
The diagnosis of OM with THz waves is primarily detecting presence of pus on the inner side of the tympanic membrane. Ultimately, it is equivalent to detecting presence of water content in the inner side of a tympanic membrane. The tympanic membrane is a thin (~100-μm thick), optically transparent membrane located at the interface between the external and middle ear. The membrane is separated into cuticle, fibrous, and mucous layers. Because its organization is similar to that of skin, we hypothesized that the THz refractive index of skin would range from 1.9 to 2.4 based on previous studies [14, 20, 21]. To determine an identification method that could be used to detect the presence of water behind a tympanic membrane, we performed experiments with thin dielectric film and mouse skin tissue using the ear speculum #1 to ensure the best THz signals.
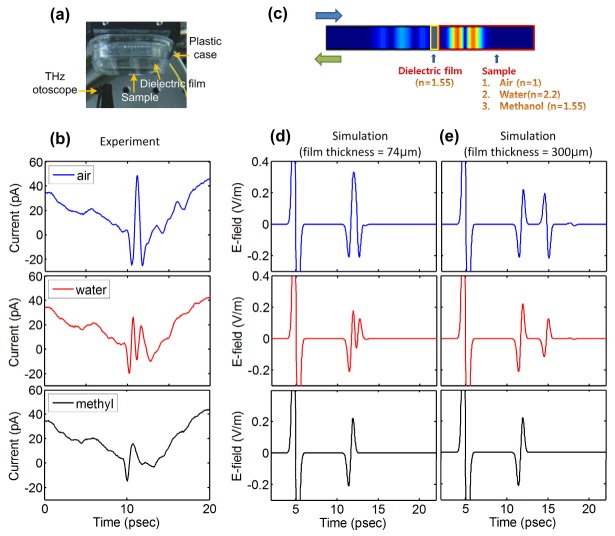
First, we considered three types of situations to clarify how THz waves would be reflected from samples behind the membrane. The refractive indices of the samples are smaller, identical, or greater than that of the membrane. A thin (74-μm thick) polyethylene dielectric film is considered as the membrane. We measured the reflected THz pulses from samples of air, water, and methanol that were placed in contact with the back side of the film, as shown in Fig. 4(a). We were able to observe that the shapes of THz pulses could be clearly distinguished as shown in Fig. 4(b). The reflected THz pulses from air, water and methanol were observed as one large pulse, two small pulses, and one small pulse, respectively. To analyze the differences of these THz pulses, we performed finite difference time-domain (FDTD) simulations. The refractive index of the polyethylene film was set as nfilm = 1.55, while those of air, water, methanol were set as nair = 1, nwater = 2.2, and nmethanol = 1.55, respectively. Next, incident-Gaussian THz pulses with 0–2 THz spectra propagate from the left to the film; samples are shown in Fig. 4(c). With a 74-μm film thickness, the shapes of the reflection signals in simulation [Fig. 4(d)] corresponded to those in the experiment. Based on the simulation result with a 300-μm-thick film as shown in Fig. 4(e), we could confirm that the reason for different shapes of the reflected THz pulses was the superposition of two THz pulses reflected from an air/film interface on front side of the film and a film/sample interface on back side of the film. The reflected THz pulse from the first interface (air/dielectric film) was the same regardless of the sample at the second interface (dielectric film/samples). On the other hand, the reflected THz pulse from the second interface changed depending on the sample. The amplitude and phase of THz waves reflected from the sample depend on the difference in refractive indices and are determined by the Fresnel diffraction formula. If the refractive indices of a film and sample are the same, there is no second reflection pulse (as with the methanol simulation result). These results showed that the presence of water could be identified based on different shapes of THz pulses determined by membrane thickness and different refractive indices at a membrane/sample interface.
Fig. 4.
Experimental and simulated results with thin dielectric film illustrating the cause of pulse-shape changes. (a) Photograph of the experimental setup. (b) Experimental time-domain signals for three samples. (c) Simulation scheme. (d)–(e) Simulation results when 74- and 300-μm-thick films were used, respectively. The large pulse at 5 ps is the incident THz pulse.
Second, we experimented on 102-μm-thick mouse skin tissue. The skin tissue is a good model to know the shape of THz pulses when the water exists behind the tympanic membrane. We hypothesized that the refractive index of the tympanic membrane are similar to those of the skin tissue since the refractive indices of mucous and fibrous layer are similar to that of skin tissue, it was practically employed in a previous study in optical regime [22]. The refractive indices of mucous and fibrous tissues are similar to that of water in the THz regime [18, 19]. Accordingly, we expected that the THz pulse would be one small pulse when water exists behind the skin. This is an identical situation to that in which methanol exists behind the dielectric film, as shown in the bottom of Figs. 4(b), 4(d) and 4(e). The one small THz pulse is easily distinguished from one large THz pulse which would be detected when no water was behind the skin. The experimental setup is shown in Fig. 5(a), and the experiment was performed before fabricating the THz otoscope. We built an acrylic chamber to attach mouse skin tissue and supply the water vapor. We then measured the THz pulse before and after dropping water using a pipette; the time-domain THz signals are shown in Fig. 5(b). As expected, one large pulse was obtained before water dropping, and one small pulse was obtained after water dropping. The reflected THz pulse from the second mouse skin/air interface almost disappeared when the water was added to behind the mouse skin. The peak-to-peak amplitude reduced by 54% compared to that before the water was added. This suggests that physicians could easily identify pus inside a tympanic membrane using this THz otoscope. To confirm the possibility of early OM diagnosis, we measured the signal alterations of THz pulses according to the change in moisture behind the mouse skin. Alterations in THz pulses while supplying 3-cc water vapor/min are depicted in Figs. 5(c) and 5(d). When the water vapor was supplied for 80 minutes, the THz pulses gradually became smaller over time, and saturation was noted after 80 minutes. The saturated peak-to-peak amplitude was 72% relative to the baseline amplitude. These proof-of-concept results confirm the potential of early OM diagnosis using reflected THz pulses from the membrane.
Fig. 5.
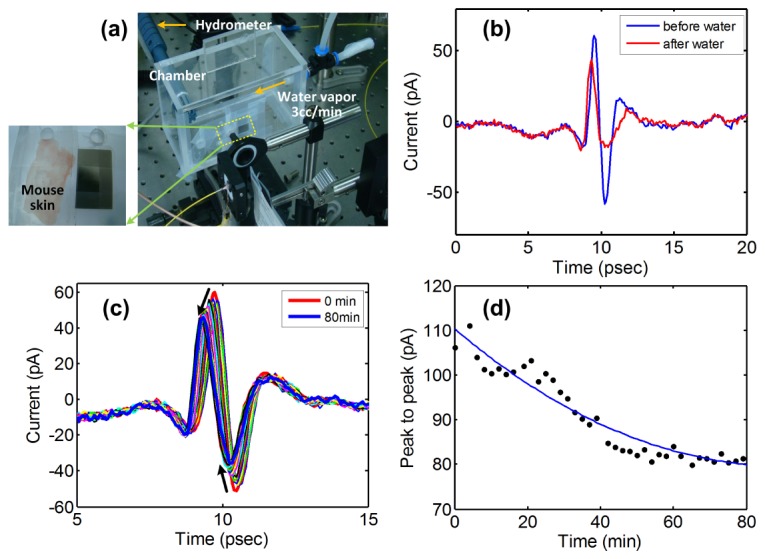
Mouse skin experiment results. (a) Photographs of the experimental setup. (b) THz time-domain signals before and after water dropping. (c) The THz signal changes depending on the moisture level while supplying 3-cc water vapor/min. (d) Peak-to-peak amplitude versus moisture (shown over time).
4. Ex vivo human tympanic membrane experiment using a THz otoscope
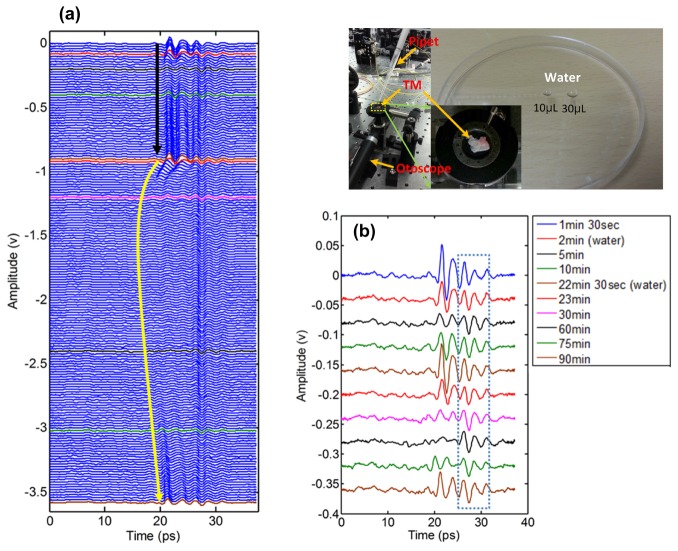
Lastly, we performed ex vivo human tympanic membrane experiments to confirm that our THz otoscope was useful for practical measurement and diagnosis. Human tympanic membrane was obtained from a patient who underwent subtotal petrosectomy due to intractable infection. Subtotal petrosectomy involves complete exenteration of all air cells of the temporal bone. The external auditory canal is closed as a blind sac, and the cavity obliterated with abdominal fat and a temporalis muscle flap. This procedure includes complete removal of tympanic membrane to prevent iatrogenic cholesteatoma [23]. The tympanic membrane is inevitable surgical specimen in that patient and we used that. The study protocol was approved by the Institutional Review Board and Hospital Research Ethics Committee of Severance Hospital. The membrane was naturally dried and attached on a circular mount as shown in inset of Fig. 6. The reflected THz pulses were measured during 90 min as shown in Fig. 6(a). The measured THz pulses were depicted with 30-s intervals and numerically shifted to allow easy observation of the pulse change over time. Figure 6(b) shows several representative THz pulses at specific times. We dropped 10-μl water onto the dried membrane 1.5 minutes after beginning the measurement. The THz pulse amplitude (2-min measurement time, red) immediately decreased after water dropping as was observed in the mouse skin experiment. The THz pulse amplitude continually decreased until 5 min (black) and gradually recovered until 22.5 min. It would be occurred along the change of absorbing water content by the tympanic membrane. For reproducibility, 10-μl water was again dropped onto the membrane at 22 min 30 s. The amplitude also decreased when the water was dropped; however, the pulse shifted forward in time window [yellow curved arrow shown in Fig. 6(a)]. Unlike the previous result, the reflection pulse almost disappeared, and the recovery time to the original THz pulse amplitude was more than 67 min. We assume this result was due to re-dropping water onto a membrane that was not completely dried and was therefore geometrically distorted because of heavy moisture. Accordingly, the THz pulse almost disappeared because of the non-flat reflection interface. This finding implies a limitation of our THz otoscope. Because the power intensity of THz sources is extremely weak compared to optical sources, most current applications using THz waves are hampered by a reflection phenomenon; unlike a scattering phenomenon, this is very sensitive to the reflection angle. Furthermore, the tympanic membrane is cone shaped and is tilted with respect to the external auditory meatus at 40°. Although it is currently very difficult to measure the reflection THz pulse from a membrane in an in vivo environment, stronger THz wave power sources would make the THz otoscope a valuable medical device for diagnosing OM.
Fig. 6.
Experiment results with human tympanic membrane using the THz otoscope. (a) Alteration of reflected THz pulses over 90 min. (b) Several THz pulses over different time. The inset shows photographs of the experiment setup and 10- and 30-μl water drops. As in the mouse skin experiments, the THz pulse was decreased in the presence of water drops. When the membrane was geometrically distorted due to heavy moisture, the THz pulse almost disappeared due to the deformed (not flat) reflection interface. We show several THz pulses at specific times. The pulses in the dashed box in (b) are not reflection THz pulses from samples; rather, they are reflection THz pulses from internal structure within a prototype version of the otoscope.
5. Summary and conclusions
We designed and fabricated a novel THz otoscope equipped with a hemispheric silicon lens to ensure maximum efficiency in the total optical path of THz waves. The inclusion of ITO glass in the THz otoscope allows physicians to diagnose OM with both THz and conventional optical diagnostics. To determine THz diagnostics for OM, we observed reflection signals from samples behind a thin dielectric film and found that the presence of water behind the membrane could be distinguished based on THz pulse shape. Mouse skin tissue, which has similar refractive indices as the tympanic membrane, was utilized to verify THz diagnostics for OM. The presence of water behind the mouse skin was easily distinguished based on differences in pulse shapes and peak-to-peak amplitudes of reflected THz pulses. The potential for early OM diagnosis using the THz otoscope was confirmed by alteration of THz pulse depending on water moisture level. Finally, we performed ex vivo human tympanic membrane experiments to verify that the THz otoscope can be used for practical and accurate measurement. The presence of water behind the human tympanic membrane was well detected. One limitation for practical use of the THz otoscope is that THz waves are very sensitive to membrane geometry, but this could be overcome by developing more intense THz sources. In future work, we will continually try to overcome this limitation through another approach such as using a THz lens that is actively controlled to maximum reflection.
Acknowledgments
This study was supported by NRF grant funded by the Korea government (MSIP No. 2013R1A1A2A10004669, 2014R1A1A2057454); and the IT R&D program of MOTIE/KEIT (10045238, Development of the Portable Scanner for THz Imaging and Spectroscopy); and the Technology Innovation Program (10060136) funded By the Ministry of Trade, industry & Energy (MI, Korea); and the World Class Institute (WCI) Program of the National Research Foundation of Korea (NRF) funded by the Ministry of Science, ICT and Future Planning. (NRF Grant Number: WCI 2011-001).
References and links
- 1.Lin F. R., Niparko J. K., Ferrucci L., “Hearing Loss Prevalence in the United States,” Arch. Intern. Med. 171(20), 1851–1852 (2011). 10.1001/archinternmed.2011.506 [DOI] [PMC free article] [PubMed] [Google Scholar]
- 2.Kenna M. A., “Acquired Hearing Loss in Children,” Otolaryngol. Clin. North Am. 48(6), 933–953 (2015). 10.1016/j.otc.2015.07.011 [DOI] [PubMed] [Google Scholar]
- 3.Palmu A., Puhakka H., Rahko T., Takala A. K., “Diagnostic value of tympanometry in infants in clinical practice,” Int. J. Pediatr. Otorhinolaryngol. 49(3), 207–213 (1999). 10.1016/S0165-5876(99)00207-4 [DOI] [PubMed] [Google Scholar]
- 4.Nguyen C. T., Jung W., Kim J., Chaney E. J., Novak M., Stewart C. N., Boppart S. A., “Noninvasive in vivo optical detection of biofilm in the human middle ear,” Proc. Natl. Acad. Sci. U.S.A. 109(24), 9529–9534 (2012). 10.1073/pnas.1201592109 [DOI] [PMC free article] [PubMed] [Google Scholar]
- 5.Minovi A., Dazert S., “Diseases of the middle ear in childhood,” GMS Curr. Top. Otorhinolaryngol. Head Neck Surg. 13, Doc11 (2014). [DOI] [PMC free article] [PubMed] [Google Scholar]
- 6.Harmes K. M., Blackwood R. A., Burrows H. L., Cooke J. M., Harrison R. V., Passamani P. P., “Otitis media: diagnosis and treatment,” Am. Fam. Physician 88(7), 435–440 (2013). [PubMed] [Google Scholar]
- 7.Markelz A. G., Roitberg A., Heilweil E. J., “Pulsed terahertz spectroscopy of DNA, bovine serum albuminand collagen between 0.1 and 2.0 THz,” Chem. Phys. Lett. 320(1–2), 42–48 (2000). 10.1016/S0009-2614(00)00227-X [DOI] [Google Scholar]
- 8.Fischer B., Hoffmann M., Helm H., Wilk R., Rutz F., Kleine-Ostmann T., Koch M., Jepsen P., “Terahertz time-domain spectroscopy and imaging of artificial RNA,” Opt. Express 13(14), 5205–5215 (2005). 10.1364/OPEX.13.005205 [DOI] [PubMed] [Google Scholar]
- 9.Oh S. J., Choi J., Maeng I., Park J. Y., Lee K., Huh Y.-M., Suh J.-S., Haam S., Son J.-H., “Molecular imaging with terahertz waves,” Opt. Express 19(5), 4009–4016 (2011). 10.1364/OE.19.004009 [DOI] [PubMed] [Google Scholar]
- 10.Ji Y. B., Lee E. S., Kim S.-H., Son J.-H., Jeon T.-I., “A miniaturized fiber-coupled terahertz endoscope system,” Opt. Express 17(19), 17082–17087 (2009). 10.1364/OE.17.017082 [DOI] [PubMed] [Google Scholar]
- 11.Ji Y. B., Kim S.-H., Jeong K., Choi Y., Son J.-H., Park D. W., Noh S. K., Jeon T.-I., Huh Y.-M., Haam S., Lee S. K., Oh S. J., Suh J.-S., “Terahertz spectroscopic imaging and properties of gastrointestinal tract in a rat model,” Biomed. Opt. Express 5(12), 4162–4170 (2014). 10.1364/BOE.5.004162 [DOI] [PMC free article] [PubMed] [Google Scholar]
- 12.Taylor Z. D., Singh R. S., Bennett D. B., Tewari P., Kealey C. P., Bajwa N., Culjat M. O., Stojadinovic A., Lee H., Hubschman J.-P., Brown E. R., Grundfest W. S., “THz medical imaging: In vivo hydration sensing,” IEEE Trans. Terahertz Sci. Technol. 1(1), 201–219 (2011). 10.1109/TTHZ.2011.2159551 [DOI] [PMC free article] [PubMed] [Google Scholar]
- 13.Woodward R. M., Wallace V. P., Pye R. J., Cole B. E., Arnone D. D., Linfield E. H., Pepper M., “Terahertz pulse imaging of ex vivo basal cell carcinoma,” J. Invest. Dermatol. 120(1), 72–78 (2003). 10.1046/j.1523-1747.2003.12013.x [DOI] [PubMed] [Google Scholar]
- 14.Wallace V. P., Fitzgerald A. J., Shankar S., Flanagan N., Pye R., Cluff J., Arnone D. D., “Terahertz pulsed imaging of basal cell carcinoma ex vivo and in vivo,” Br. J. Dermatol. 151(2), 424–432 (2004). 10.1111/j.1365-2133.2004.06129.x [DOI] [PubMed] [Google Scholar]
- 15.Fitzgerald A. J., Wallace V. P., Jimenez-Linan M., Bobrow L., Pye R. J., Purushotham A. D., Arnone D. D., “Terahertz pulsed imaging of human breast tumors,” Radiology 239(2), 533–540 (2006). 10.1148/radiol.2392041315 [DOI] [PubMed] [Google Scholar]
- 16.Oh S. J., Kim S.-H., Ji Y. B., Jeong K., Park Y., Yang J., Park D. W., Noh S. K., Kang S. G., Huh Y. M., Son J. H., Suh J. S., “Study of freshly excised brain tissues using terahertz imaging,” Biomed. Opt. Express 5(8), 2837–2842 (2014). 10.1364/BOE.5.002837 [DOI] [PMC free article] [PubMed] [Google Scholar]
- 17.Ji Y. B., Park C. H., Kim H., Kim S.-H., Lee G. M., Noh S. K., Jeon T.-I., Son J.-H., Huh Y.-M., Haam S., Oh S. J., Lee S. K., Suh J.-S., “Feasibility of terahertz reflectometry for discrimination of human early gastric cancers,” Biomed. Opt. Express 6(4), 1398–1406 (2015). 10.1364/BOE.6.001398 [DOI] [PMC free article] [PubMed] [Google Scholar]
- 18.Klatt G., Hilser F., Qiao W., Beck M., Gebs R., Bartels A., Huska K., Lemmer U., Bastian G., Johnston M. B., Fischer M., Faist J., Dekorsy T., “Terahertz emission from lateral photo-Dember currents,” Opt. Express 18(5), 4939–4947 (2010). 10.1364/OE.18.004939 [DOI] [PubMed] [Google Scholar]
- 19.Dobroiu A., Yamashita M., Ohshima Y. N., Morita Y., Otani C., Kawase K., “Terahertz imaging system based on a backward-wave oscillator,” Appl. Opt. 43(30), 5637–5646 (2004). 10.1364/AO.43.005637 [DOI] [PubMed] [Google Scholar]
- 20.Pickwell E., Wallace V. P., “Biomedical applications of terahertz technology,” J. Phys. D Appl. Phys. 39(17), R301–R310 (2006). 10.1088/0022-3727/39/17/R01 [DOI] [Google Scholar]
- 21.Ashworth P. C., Pickwell-MacPherson E., Provenzano E., Pinder S. E., Purushotham A. D., Pepper M., Wallace V. P., “Terahertz pulsed spectroscopy of freshly excised human breast cancer,” Opt. Express 17(15), 12444–12454 (2009). 10.1364/OE.17.012444 [DOI] [PubMed] [Google Scholar]
- 22.Foth H., Färber S., Gauer A., Wagner R., “Thermal damage threshold at 633 nm of tympanic membrane of pig,” Hear. Res. 142(1-2), 71–78 (2000). 10.1016/S0378-5955(00)00013-7 [DOI] [PubMed] [Google Scholar]
- 23.Mattox D., Microsurgery of the Skull Base (Georg Thieme Verlag, 1988), Part. 5. [Google Scholar]


