Abstract
Recent technological advancements in optical spectroscopy allow for the construction of hyperspectral (broadband) portable tissue oximeters. In a series of our recent papers we have shown that hyperspectral NIRS (hNIRS) has similar or better capabilities in the absolute tissue oximetry as frequency-domain NIRS, and that hNIRS is also very efficient in measuring temporal changes in tissue hemoglobin concentration and oxygenation. In this paper, we extend the application of hNIRS to the measurement of event-related hemodynamic and metabolic functional cerebral responses during simulated driving. In order to check if hNIRS can detect event-related changes in the brain, we measured the concentration changes of oxygenated (HbO2) and deoxygenated (HHb) hemoglobin and of the oxidized state of cytochrome c oxidase, on the right and left prefrontal cortices (PFC) simultaneously during simulated driving on sixteen healthy right-handed participants (aged between 22–32). We used our in-house hNIRS system based on a portable spectrometer with cooled CCD detector and a driving simulator with a fully functional steering wheel and foot pedals. Each participant performed different driving tasks and participants were distracted during some driving conditions by asking general knowledge true/false questions. Our findings suggest that more complex driving tasks (non-distracted) deactivate PFC while distractions during driving significantly activate PFC, which is in agreement with previous fMRI results. Also, we found the changes in the redox state of the cytochrome C oxidase to be very consistent with those in the concentrations of HbO2 and HHb. Overall our findings suggest that in addition to the suitability of absolute tissue oximetry, hyperspectral NIRS may also offer advantages in functional brain imaging. In particular, it can be used to measure the metabolic functional brain activity during actual driving.
OCIS codes: (300.0300) Spectroscopy, (170.2655) Functional monitoring and imaging
1. Introduction
Near-infrared spectroscopy (NIRS) is a portable non-invasive method for real-time measurement of brain activity in real-life situations without noise and movement limitations or interfering with biological systems [1]. NIRS monitors the concentration changes of tissue chromophores based on changes in the attenuation of near-infrared spectra. Oxyhemoglobin (HbO2), deoxyhemoglobin (HHb) and cytochrome-C-oxidase (CCO) are significant NIR absorbers [2]. Oxygenated and deoxygenated hemoglobin reflect intravascular oxygenation.
CCO is the terminal electron acceptor in the mitochondrial respiratory chain [3] and contains four redox active metal centers; the copper A (CuA) center has a distinct redox-sensitive absorbance band in NIR region of the electromagnetic spectrum; it is responsible for 95% of cellular oxygen metabolism and ATP synthesis [2]. The total concentration of CCO in the short term is almost constant and it interconverts between reduced and oxidized states. The concentration changes of oxidized CCO (Δ[ox-CCO]) that can be monitored by NIRS represent changes in the CCO redox state and reflect the balance between cerebral oxygen delivery and utilization [4,5]. The brain cells have the highest mitochondrial density among all other body cells thus the concentration of CCO is significantly higher and easier to measure within brain tissue.
Most groups using NIRS use multispectral NIRS (mNIRS), typically employing light at two wavelengths emitted by laser diodes and measured by non-dispersing detectors such as photo multiplying tubes or avalanche photodiodes. In our group, we developed hyperspectral NIRS which uses a broadband light source and a portable spectrometer as a detector. We already have explored some advantages of hNIRS, including the possibility to measure absolute optical properties [6–8] and the effectiveness in functional brain imaging applications due to the use of the independent component analysis in the temporal-spectral domain [9]. In this functional study, we capitalize on the ability of hNIRS to accurately isolate different chromophores having overlapping absorption spectra, including CCO, and to effectively reduce noise to investigate how the healthy adult brain responds to complex driving tasks using dual-channel hyperspectral fNIRS.
Driving is an activity that involves various functions of the brain such as visual attention, planning, decision-making and motor control; each of these functions activate specific regions of the brain: visual attention activates the occipital lobe (posterior brain network), motor control activates the parietal lobe and more complex driving tasks that require planning or decision making mostly activate the frontal lobes. Malfunction of any of these regions may increase the risk of accidents. Brain activity can be assessed by measuring the concentration changes of HbO2, HHb, and an intracellular metabolism marker CCO [10].
It has been shown that in complex motor and cognitive tasks the prefrontal cortex (PFC) is highly involved [11] in addition, this hairless area of the scalp minimizes the scattering and attenuation effect of the hair. In our measurements optodes were placed on the right and left PFC to measure Δ[HbO2], Δ[HHb] and Δ[ox-CCO] during driving and cranial activity of the PFC in complex driving tasks was assessed.
Recently a similar study has been done with the same driving simulation system and scenarios monitoring brain activity using fMRI and the frontal lobe only was activated under distracted driving conditions [12]. In the present study, we compare our hNIRS results with fMRI results of [12].
2. Materials and methods
2.1 Subjects
Sixteen healthy right-handed adult subjects, aged between 20 and 32 (Mean = 24.19, SD = 3.76) participated in this study (5 males and 11 females). All subjects had normal or corrected to normal vision and provided written informed consent prior to the beginning of the study. All subjects had an active driver’s license with an average driving experience of 6.38 years (SD = 4.26). The human subject research protocol REB 2008-003 was approved by the Ryerson University Ethics Board.
2.2 Driving simulation system
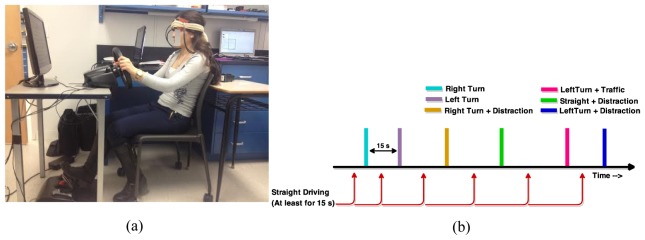
The driving simulation set-up contained a fully functional steering wheel, brake and accelerator pedals, an LCD monitor and speakers (Fig. 1(a)). STISIM drive software (version 2.08.08, System Technology Inc., Hawthorne, CA) was used to introduce driving tasks or distraction at proper moments and also record driving parameters such as speed, direction, acceleration, and timing. In addition to the road and traffic signs, participants could see the rear-view mirror, speedometer, RPM gauge and turn signals. On the left and right side of the steering wheel, there were two buttons and participants were asked to press the right one for TRUE and the left one for FALSE to answer general knowledge questions while driving. Participants sat on a chair in front of the monitor and steering wheel and were asked to drive safely, follow the traffic rules and GPS commands. All participants underwent a 10 minutes training session prior to the NIRS to get familiar with the system.
Fig. 1.
(a) Driving simulator and fNIRS measurement apparatus; (b) event-related driving scenario design.
2.3 Driving scenarios
With each subject fNIRS was performed during two driving scenarios: one without distractions and another with distractions (Fig. 1(b)). Each of two blocks took approximately 10 minutes (depending on the speed of driving). Both driving scenarios included several routine driving tasks such as right turns and left turns and the turns combined with the presence of pedestrians or traffic at intersections. There were at least 15s of straight driving between all driving tasks. Each task was introduced by a recorded voice (similar to GPS commands) 5 seconds prior to the task (e.g. “Turn left at the traffic light”). In the second scenario participants were distracted during right turn and straight driving left turn by general knowledge true/false questions (e.g. “A horse is larger than a puppy”), which they answered by pressing T or F buttons placed on the steering wheel. Driving tasks that were isolated and analyzed contained: straight driving, distracted straight driving, left turn in traffic, distracted left turn in traffic, right turn and distracted right turn.
2.4 fNIRS system and procedures
Figure 2 illustrates all the hardware components of the hNIRS experimental setup. A stabilized tungsten halogen light source (Thorlabs, OSL2BIR; Al-coated reflector bulb with enhanced illumination in the near infrared region) along with two QE65000 Ocean Optics spectrometers were used to obtain measurements at the broadband wavelength range of 700-900 nm (spectral resolution of 0.4 nm). While the maximum sampling rate of the spectrometer was 5 ms per spectrum, in order to achieve practical signal to noise ratio the collected light was sampled at 1 Hz, corresponding to the integration time of 1 s. One-meter long optical fiber bundles with 3 mm core diameter were used to transmit light from the source to the head and the collected light to the spectrometers. The optical intensity delivered to the skin was 150 mW/cm2, which was below the maximum permissible exposure for the incoherent light of 200 mW/cm2 [13]. To improve the throughput, the spectrometers were modified as described in [8]: the input slit was removed and the fibers in the bundle tip were shaped in the form of a 200 μm wide line. This allowed for a significant improvement of the signal with a sufficient spectral resolution (see Fig. 3).
Fig. 2.
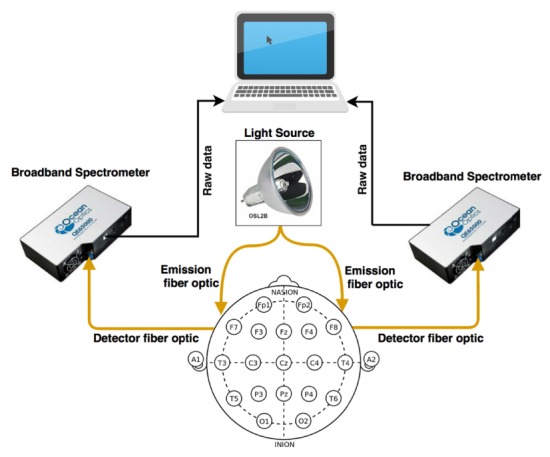
Diagram of the employed dual channel hNIRS setup.
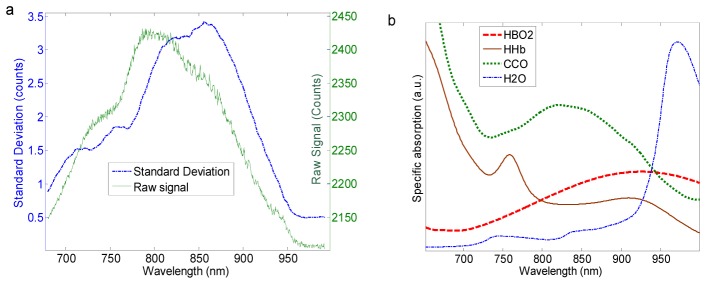
Fig. 3.
(a) the raw hNIRS signal (at a single time point) and the standard deviation of the raw signal measured on tissue mimicking phantom and human head; (b) the absorption spectra of tissue chromophores.
The measurement positions were determined using 10/20 EEG standard system (using an EEG standard cap). F7 and F8 locations were marked on each participant and the emitting and collecting optode pair were centered on each of those locations with 30 mm source-detector distance. All devices were securely placed on a table behind the subject to minimize the interference between the driver’s movements and the measurements.
2.5 hNIRS algorithm
Figure 3(a) shows a raw spectrum and the standard deviation of a typical data set during 10 minutes of measurements on the human forehead. The shapes of both curves in Fig. 3 reflect the shapes of the absorption spectra of tissue chromophores: they are limited by the high absorption by HHb at wavelengths shorter than 700 nm by water at wavelengths longer than 950 nm; the features around 760 nm and 870 nm correspond to the absorption maxima of HHb and HbO2, respectively. The temporal signal variations reflected by the standard deviation curve in Fig. 2(a) correspond to the physiological changes in the concentrations of HbO2, HHb, and ox-CCO, which occur both due to specific brain activity and spontaneously.
The purpose of the data analysis, which was performed using MATLAB (Mathworks, MA, version R2013b), was to isolate the changes due to specific brain activity during driving events. The signal preprocessing algorithm as shown in detail in Fig. 4 included steps as described in [9]: detrending and de-noising of the absorbance changes using the Matlab independent component analysis algorithm FastICA [14] within the wavelength range of 715 – 900 nm. The number of independent components was reduced to five based on the high temporal noise in the excluded components. These remaining five independent components were back-transformed to the original time-spectral domain of 715 – 900 nm using the inverse of the mixing matrix obtained using FastICA [9]. All these steps were taken to remove the baseline and to de-noise the absorbance changes. Then the measured absorbance changes were fitted to model based on the analytical solution to the diffusion approximation for a semi-infinite medium [15]:
where:
Fig. 4.
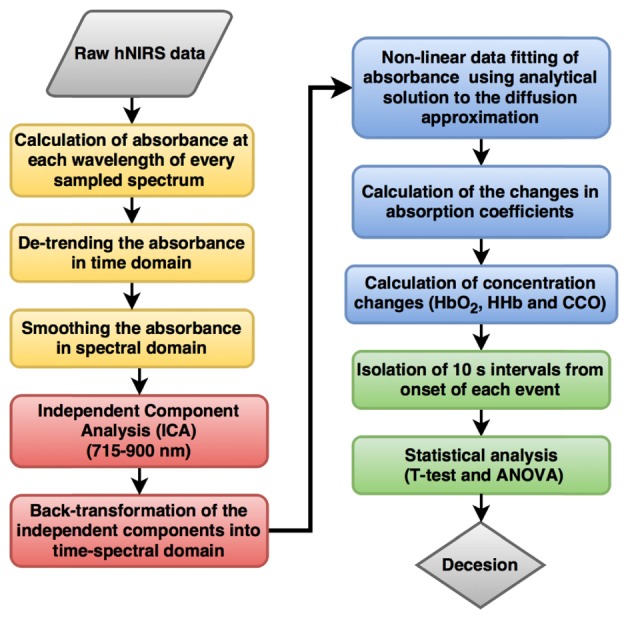
hNIRS data processing algorithm.
-
•
is the diffusion coefficient
-
•
is the reduced scattering coefficient
-
•
ρ is the source-detector distance (cm)
-
•
S is the source strength (W)
-
•
Z0 = 3D: depth at which all photons are scattered
-
•
Zb = 2 (nrel is the relative index of refraction): the distance between extrapolated boundary and physical surface
The non-linear fit was performed using the Matlab function ‘lsqcurvefit’, where the parameters of the fit were Δ[HbO2], Δ[HHb] and Δ[ox-CCO]:
The spectral fitting part of the above algorithm is conceptually similar to the one in [16], and the main modification was the addition of the time-spectral domain ICA for the signal de-noising.
The baseline values of the absorption coefficient were computed assuming the [HbO2] = 60 μM, [HHb] = 20 μM and the water fraction of 85% [6]. As we only consider the concentration changes the reduced scattering coefficient was assumed to be constant and modeled using the power function of the wavelength :
The detailed method of determining the baseline parameters is described in [6].
2.6 Statistical analysis
Five driving tasks (events) were considered for the analysis: “distracted straight driving”, “left turn in traffic”, “left turn in traffic with distraction”, “right turn”, and “right turn with distraction”. For each participant and for each event the changes in the chromophore concentrations: Δ[HbO2], Δ[HHb] and Δ[ox-CCO] were calculated and isolated within a 10-second time interval after the onset of each event.
For each isolated interval corresponding to an event, the initial value (at the very first moment of the event) was subtracted from the corresponding data trace and the event-related changes from the onset of each event were subject to the group statistical analysis. In addition, event-related changes in PFC were compared between distracted vs. non-distracted conditions to assess how distractions affect the activity in the PFC.
Statistical analysis including means, standard deviations, standard errors, paired-sample t-tests and one-way ANOVA were performed using MATLAB R2013b (Mathworks, USA).
After isolation of the 10-second intervals for each driving event, the results for each event type were averaged over 16 subjects and the standard deviation and standard error were calculated (shown in the figures as error bars). In order to evaluate the statistical significance of the event-related changes, the paired-sample t-test was performed between the very first moment of the stimulation and the moment of the maximum changes in the group-averaged traces (5-10 seconds after the onset of the event). Statistical significance was assumed at p < 0.05.
In order to compare the event-related changes between distracted vs. non-distracted conditions, the one-way ANOVA was conducted. The data being compared were grouped into two groups of “distracted” and “non-distracted” events then the one-way ANOVA was performed between the two groups; The ”non-distracted” group contained “right turn” and “left turn in traffic”. The “distracted” group contained: “Distracted right turn” and “distracted left turn”. The group average changes in [HbO2], [HHb] and [ox-CCO] and statistical difference between means of all chromophores and corresponding p-values between groups were analyzed. The parameters of the ANOVA were “complex driving task” as the commonly observed effect in both groups and the additional “cognitive task (distraction)” in the distracted group, representing the cognitive task effect.
3. Results
3.1 “Straight + distraction”
The average traces shown in Fig. 5 demonstrate that distraction during straight driving resulted in an increase in HbO2 (Fig. 5(a)) level accompanied by decreasing HHb (Fig. 5(b)) in both right and left PFC (p <0.05), however, changes in ox-CCO (Fig. 5(c)) were not statistically significant on either side. Similar trends as the average traces were observed in random individual changes.
Fig. 5.
The average changes during straight driving with distraction a) HbO2; b) HHb; c) ox-CCO.
3.2 “Right turn”
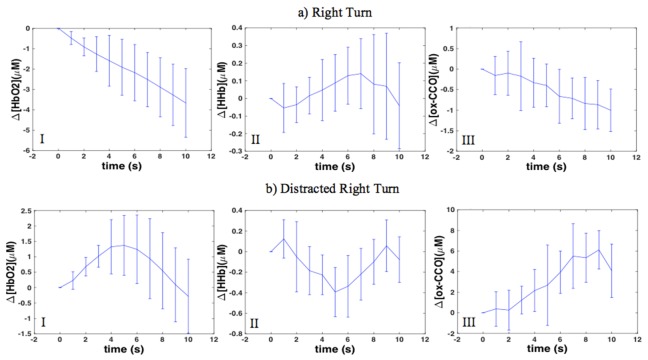
Figure 6(a) shows the average traces of Δ[HbO2], Δ[HHb] and Δ[ox-CCO] during right turn in right PFC. During the non-distracted condition as shown in Fig. 6(a-I) HbO2 concentration decreased (p <0.05) and HHb increased (Fig. 6(a-II)) significantly in both sides (p <0.05); concentration of ox-CCO decreased in both sides but the changes were significant (p <0.05) only in the right side (Fig. 6(a-III)).
Fig. 6.
Average traces of concentration changes in right PFC during a) right turn; b) distracted right turn; I: HbO2 ; II: HHb and III: ox-CCO.
3.3 “Right turn + distraction”
Figure 6(b) shows the average traces of Δ[HbO2], Δ[HHb] and Δ[ox-CCO] during distracted right turn in right PFC. In both right and left PFC under distraction HbO2 concentration increased as shown in Fig. 6(b-I) (p <0.05), HHb decreased (Fig. 6(b-II)) but it was statistically significant only in the right PFC (p <0.05) and also ox-CCO increased, however, these changes were statistically significant only in the left PFC (Fig. 6(b-III)).
3.4 “Left turn + traffic”
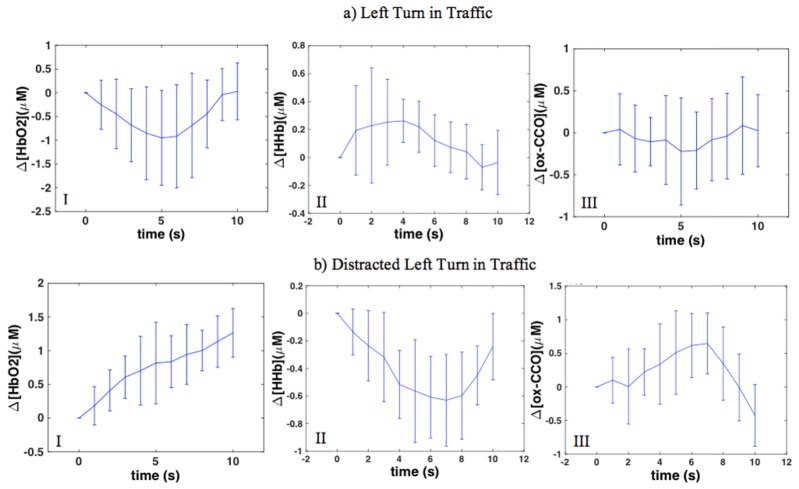
Figure 7(a) shows the averaged traces during left turn in traffic. Left turns in traffic resulted in a significant increase in HbO2 in the right PFC (p <0.05). The rest of the changes were not statistically significant in either side.
Fig. 7.
Average traces of concentration changes in right PFC during a) left turn in traffic; b) distracted left turn in traffic; I: HbO2; II: HHb and III: ox-CCO.
3.5 “Left turn + traffic + distraction”
Figure 7(b) shows the averaged traces during distracted left turn in traffic. According to the average traces, distracted left turns in traffic resulted in a significant increase in HbO2 accompanied by a significant decrease in HHb and an increase in ox-CCO in both right and left PFC (p < 0.05).
3.6 Results in summary
The significant average changes were observed in individual plots as well; Fig. 8 shows the event-related changes in one random participant under different conditions on right PFC. All results are summarized in Table 1. Right and left PFC were both significantly activated (p <0.05) during distracted right turn and distracted left turn in traffic similar to our fMRI findings. All activations induced by distractions were identified by increasing HbO2 and were mostly accompanied by decreasing HHb and increasing ox-CCO. Between all the events “left turn in traffic” resulted in the least consistent changes between participants.
Fig. 8.
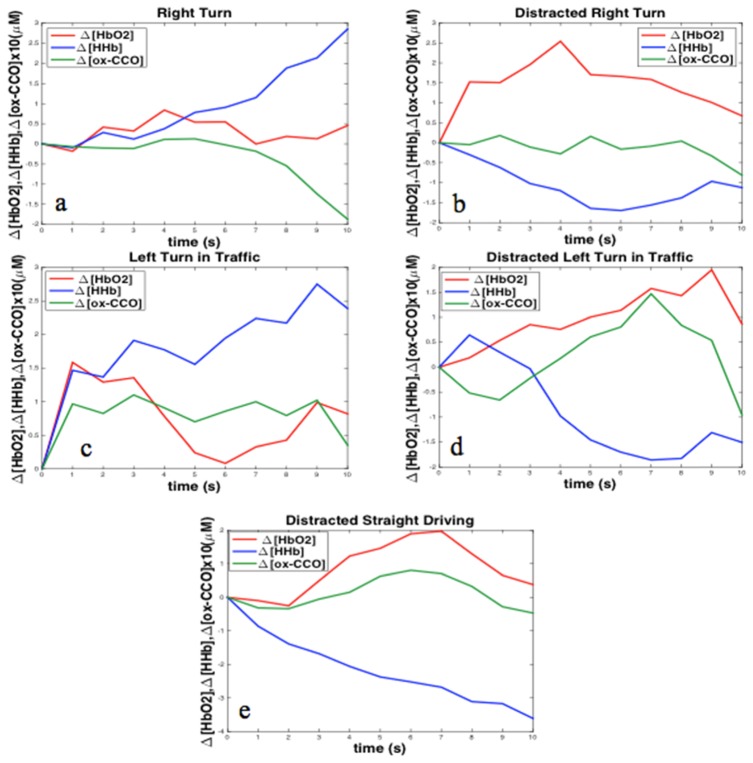
Individual event-related changes during different tasks in a single random participant in right PFC; induced changes due to: a) right turn; b) distracted right turn; c) left turn in traffic; d) distracted left turn in traffic and e) distracted straight driving.
Table 1. Average event-related changes in concentrations of HbO2, HHb and ox-CCO and calculated p-value from paired-sample t-tests (performed between the initial moment of each event and the maximum induced changes); arrows show the direction of the average changes that were statistically significant and the changes that were not statistically significant are shown by ≈.
| Event |
HbO2 |
HHb |
ox-CCO |
|||
|---|---|---|---|---|---|---|
| Left PFC | Right PFC | Left PFC | Right PFC | Left PFC | Right PFC | |
|
Right turn |
↘ | ↘ | ↗ | ↗ | ≈ | ↘ |
|
P = 0.02 |
P = 0.04 |
P = 0.05 |
P = 0.03 |
P = 0.3 |
P = 0.04 |
|
|
Right turn + distraction |
↗ | ↗ | ≈ | ↘ | ↗ | ≈ |
|
P = 0.008 |
P = 0.01 |
P = 0.1 |
P = 0.008 |
P = 0.004 |
P = 0.3 |
|
|
Left turn + traffic |
≈ | ↗ | ≈ | ≈ | ≈ | ≈ |
|
P = 0.2 |
P = 0.04 |
P = 0.1 |
P = 0.1 |
P = 0.1 |
P = 0.4 |
|
|
Left turn + traffic + distraction |
↗ | ≈ | ↘ | ↘ | ↗ | ↗ |
|
P = 0.01 |
P = 0.4 |
P = 0.05 |
P = 0.04 |
P = 0.01 |
P = 0.04 |
|
| Straight + distraction | ↗ | ↗ | ↘ | ↘ | ≈ | ≈ |
| P = 0.01 | P = 0.02 | P = 0.002 | P = 0.04 | P = 0.3 | P = 0.3 | |
In order to assess the effectiveness of the data de-noising by ICA we also performed a t-test as in Table 2 on the data obtained without the ICA de-noising step. In that case, the only significant changes were increases in Δ[HbO2] during “Right turn + distraction” (p = 0.01). All other p-values were greater than 0.1.
Table 2. Average concentration changes and one-way ANOVA results of all distracted conditions vs. average changes of all non-distracted conditions; positive means reflect an overall increase and negative means represent an overall decrease.
| Mean concentration changes (μM) | ||||||
|---|---|---|---|---|---|---|
| HbO2 | HHb | ox-CCO | ||||
| Right PFC | Non-Distracted | Distracted | Non-Distracted | Distracted | Non-Distracted | Distracted |
| −0.064 |
0.6938 |
0.256 |
−0.398 |
−0.094 |
0.18 |
|
|
p-value |
0.039 |
0.008 |
0.01 |
|||
|
Left PFC |
Non-Distracted |
Distracted |
Non-Distracted |
Distracted |
Non-Distracted |
Distracted |
| −2.140 |
0.230 |
0.177 |
−0.29 |
−0.071 |
−0.014 |
|
| p-value | 0.04 | 0.045 | 0.7 | |||
A statistical comparison between event-related changes due to distracted vs. non-distracted conditions along with one-way ANOVA results are shown in Table 2 and Fig. 9. This analysis was performed to generally assess the effect of distraction during driving. “Non-distracted” group contained: “straight”, “right turn” and “left turn in traffic”; distracted group contained: “straight + distraction”, “right turn + distraction” and “left turn in traffic + distraction”.
Fig. 9.
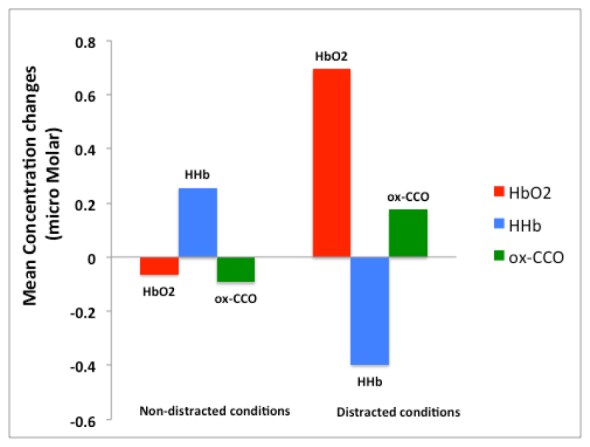
Group mean analysis based on one-way ANOVA (details are presented in Table 2).
Average changes in [HbO2], [HHb] and [ox-CCO] shown in Table 2 and Fig. 9, in particular, positive Δ[HHb] and negative Δ[ox-CCO], indicate that left and right turns without distractions deactivate both the left and right PFC. Oppositely, distractions during driving tasks caused activation of both right and left PFC in terms of all three chromophores. Furthermore, ANOVA p-values demonstrated that distracted and non-distracted conditions resulted in statistically significant opposite changes in [HbO2] and [HHb] (p < 0.05) in both right and left PFC. Furthermore, the directions of Δ[ox-CCO] in right PFC were opposite between distracted and non-distracted conditions (p < 0.05). However, for the left PFC the Δ[ox-CCO] between distracted and non-distracted groups was not statistically significant (p = 0.7). Our results show that distractions during “left turn + traffic”, a more complex driving task compared to right turn, resulted in greater activation in the right PFC.
4. Discussion
This study was designed to measure event-related activation changes in right and left prefrontal cortices by hNIRS during different driving conditions. The spectrometers were modified to improve the throughput, and the custom hyperspectral algorithm was developed to measure the changes in the [HbO2], [HHb] and [ox-CCO].
Six different driving events were investigated: “straight + distraction”, “right turn”, “right turn + distraction”, “left turn in traffic”, “left turn in traffic + distraction” and “straight + distraction”. An increase in [HbO2] concomitant with a decrease in [HHb] during a cognitive task reflects oxygen supply enhancement due to increased blood flow in response to the brain activation that was accompanied by an increase in ox-CCO representing tissue oxygen consumption increase [17]. In all distracted conditions PFC activation (increased oxygen delivery) was observed along with an increase in [ox-CCO]. PFC was activated due to distractions during driving and resulted in an increase in both oxygen consumption and oxygenated hemoglobin supply.
The concentration of CCO is much smaller than the concentrations of HbO2 and HHb, and for a long time, the feasibility of CCO measurements in the human brain by NIRS has been questioned. However, due to recent progress in both light detection and spectral analysis algorithms, in a series of recent papers, the feasibility of CCO measurements has been conclusively established [17–19]. To resolve all three chromophores, HbO2, HHb, and CCO the best spectral resolution provided by the hyperspectral method, which measures light absorbance at a quasi-continuum of wavelengths was required in combination with advanced data processing methods. In particular, the use of improved throughput spectrometers and time-spectral domain ICA was crucial to detect statistically significant event-related group results, although the data variance in this study was rather high. The reasons for that were the event-related nature of relatively subtle cerebral changes, the biasing influence of extra-cerebral hemodynamics on NIRS data, and a small number of fNIRS channels. Increasing of the number of channels to measure other regions of the brain simultaneously (especially posterior lobe which is responsible for visual attention) with research on advanced fNIRS signal processing (to enhance SNR and better isolate different chromophores) in the future may result in the feasibility of detecting event-related responses in individual subjects. Also, QE65000 is now a rather old spectrometer model. Upon completion of this study, we tested several new models of portable spectrometers with back-thinned cooled detectors (Avantes, Ocean Optics, and B&W Tek), and found them to provide significantly better sensitivity than QE65000. Currently, we are developing a new multichannel hNIRS system based on four units of a latest portable spectrometer model.
Although in this study we did not measure the occipital lobe that is responsible for visual attention, the previous fMRI study has shown that distractions activate the PFC accompanied by loss of enhanced activation in the occipital lobe required for higher visual attention in complex driving tasks [12,20].
Making a “right turn” significantly deactivated both right and left PFC; ox-CCO decreased and HHb increased following the deactivation (p < 0.05). The changes during “left turn + traffic” were not statistically significant, however, the average shows that left PFC was deactivated while right PFC was activated.
Previously published fMRI data collected during similar driving tasks [12] has shown activation in the right and left PFC during all distracted driving conditions, which agrees with our current findings using NIRS. No PFC activation was observed in fMRI results during the right or left turn that also agrees with our findings.
Overall, the ANOVA analysis of the behavior of all three chromophores shows that distractions activate both left and right PFC, which is in strong agreement with previous fMRI results [12].
Although the measured changes in CCO were statistically significant, the signal-to-noise ratio of measurements was rather low. Therefore, it is difficult to make quantitative conclusions on the changes [ox-CCO] based on these results. However, one can hypothesize that the relative changes in CCO must be much greater than the relative changes in hemoglobin oxygenation because the hemoglobin oxygenation reflects the intravascular oxygen concentration while changes in CCO reflect the utilization of the oxygen in the cells in the process of ATP production [22].
Understanding the brain activity during driving is of great social importance. Another study during actual driving has been done using mNIRS assessing brain activity during acceleration and deceleration in daytime and nighttime driving [21]. They have shown that the frontal eye fields (FEF) of the prefrontal cortex are highly activated while speed is changing. However, due to safety issues, those experiments were performed on a closed expressway and the only stimulations were acceleration and deceleration. Since they used an mNIRS system, they could not measure cerebral metabolic signals, so they measured only changes in. In future, we plan to continue studying brain activity during driving using hNIRS, in particular in elderly drivers.
5. Conclusions
In this study, we used hyperspectral fNIRS to investigate event-related activity in right and left prefrontal cortices during various driving conditions. Based on previous fMRI research we expected most significant activations during distractions. All cases of activation exhibited the typical activation pattern of increased HbO2 with simultaneously decreased HHb (with the exception of left turn in traffic in the right PFC), which provides an additional confirmation of the activation. Furthermore, the expected statistically significant responses of Δ[oxCCO] to functional activations were observed. Namely, Δ[oxCCO] increased concurrently with the increase in HbO2 except for “straight + distraction” condition in the left PFC. Such a consistent behavior of Δ[oxCCO] indicates that hyperspectral fNIRS can directly assess not only the vascular activity but also the event-related changes in cerebral oxygen metabolism.
Our results dovetail nicely with our previous fMRI findings using similar driving scenarios [12]. However, in order to better understand the relationship between activation of different cortical regions in the future we need to perform fNIRS measurements on parts of the brain simultaneously. Overall, our findings suggest that in addition to the suitability in absolute tissue oximetry, hyperspectral NIRS may also offer advantages in functional brain imaging. In particular, it can be used to measure the metabolic functional brain activity during actual driving.
References and links
- 1.Derosière G., Mandrick K., Dray G., Ward T. E., Perrey S., “NIRS-measured prefrontal cortex activity in neuroergonomics: strengths and weaknesses,” Front. Hum. Neurosci. 7, 583–595 (2013). 10.3389/fnhum.2013.00583 [DOI] [PMC free article] [PubMed] [Google Scholar]
- 2.Jöbsis F. F., “Noninvasive, infrared monitoring of cerebral and myocardial oxygen sufficiency and circulatory parameters,” Science 198(4323), 1264–1267 (1977). 10.1126/science.929199 [DOI] [PubMed] [Google Scholar]
- 3.Taanman J. W., “Human cytochrome c oxidase: structure, function, and deficiency,” J. Bioenerg. Biomembr. 29(2), 151–163 (1997). 10.1023/A:1022638013825 [DOI] [PubMed] [Google Scholar]
- 4.Smith M., “Shedding light on the adult brain: a review of the clinical applications of near-infrared spectroscopy,” Philos Trans A Math Phys Eng. Sci. 369 4452–4469 (2011). [DOI] [PubMed] [Google Scholar]
- 5.Kolyva C., Ghosh A., Tachtsidis I., Highton D., Cooper C. E., Smith M., Elwell C. E., “Cytochrome c oxidase response to changes in cerebral oxygen delivery in the adult brain shows higher brain-specificity than haemoglobin,” Neuroimage 85(Pt 1), 234–244 (2014). 10.1016/j.neuroimage.2013.05.070 [DOI] [PMC free article] [PubMed] [Google Scholar]
- 6.Yeganeh H. Z., Toronov V., Elliott J. T., Diop M., Lee T. Y., St Lawrence K., “Broadband continuous-wave technique to measure baseline values and changes in the tissue chromophore concentrations,” Biomed. Opt. Express 3(11), 2761–2770 (2012). 10.1364/BOE.3.002761 [DOI] [PMC free article] [PubMed] [Google Scholar]
- 7.Pucci O., Toronov V., St Lawrence K., “Measurement of the optical properties of a two-layer model of the human head using broadband near-infrared spectroscopy,” Appl. Opt. 49(32), 6324–6332 (2010). 10.1364/AO.49.006324 [DOI] [PubMed] [Google Scholar]
- 8.Diop M., Wright E., Toronov V., Lee T. Y., St Lawrence K., “Improved light collection and wavelet de-noising enable quantification of cerebral blood flow and oxygen metabolism by a low-cost, off-the-shelf spectrometer,” J. Biomed. Opt. 19(5), 057007 (2014). 10.1117/1.JBO.19.5.057007 [DOI] [PubMed] [Google Scholar]
- 9.Schelkanova I., Toronov V., “Independent component analysis of broadband near-infrared spectroscopy data acquired on adult human head,” Biomed. Opt. Express 3(1), 64–74 (2012). 10.1364/BOE.3.000064 [DOI] [PMC free article] [PubMed] [Google Scholar]
- 10.Banaji M., “A generic model of electron transport in mitochondria,” J. Theor. Biol. 243(4), 501–516 (2006). 10.1016/j.jtbi.2006.07.006 [DOI] [PubMed] [Google Scholar]
- 11.Miller E. K., Cohen J. D., “An integrative theory of prefrontal cortex function,” Annu. Rev. Neurosci. 24(1), 167–202 (2001). 10.1146/annurev.neuro.24.1.167 [DOI] [PubMed] [Google Scholar]
- 12.Schweizer T. A., Kan K., Hung Y., Tam F., Naglie G., Graham S. J., “Brain activity during driving with distraction: an immersive fMRI study,” Front. Hum. Neurosci. 7(7), 53 (2013). [DOI] [PMC free article] [PubMed] [Google Scholar]
- 13.Irving B. J., Fantini S., Quantitative Biomedical Optics: Theory, Methods, and Applications (Cambridge University Press, 2016). [Google Scholar]
- 14.H. Gavert, J. Hurri, and J. Sarela, The FastICA package for MATLAB. Lab. of Computer and Information Science, Helsinki University of Technology” (2005).
- 15.Fantini S., Franceschini M., Gratton E., “Semi-infinite-geometry boundary problem for light migration in highly scattering media: a frequency-domain study in the diffusion approximation,” J. Opt. Soc. Am. B 11(10), 2128 (1994). 10.1364/JOSAB.11.002128 [DOI] [Google Scholar]
- 16.Tisdall M. M., Tachtsidis I., Leung T. S., Elwell C. E., Smith M., “Increase in cerebral aerobic metabolism by normobaric hyperoxia after traumatic brain injury,” J. Neurosurg. 109(3), 424–432 (2008). 10.3171/JNS/2008/109/9/0424 [DOI] [PubMed] [Google Scholar]
- 17.Mason M., Nicholls P., Cooper C., “Re-evaluation of the near infrared spectra of mitochondrial cytochrome c oxidase: Implications for non-invasive in vivo monitoring of tissues,” Biochimica Biophysica Acta 1837(11), 1882–1891 (2014). 10.1016/j.bbabio.2014.08.005 [DOI] [PMC free article] [PubMed] [Google Scholar]
- 18.Kolyva C., Tachtsidis I., Ghosh A., Moroz T., Cooper C. E., Smith M., Elwell C. E., “Systematic investigation of changes in oxidized cerebral cytochrome c oxidase concentration during frontal lobe activation in healthy adults,” Biomed. Opt. Express 3(10), 2550–2566 (2012). 10.1364/BOE.3.002550 [DOI] [PMC free article] [PubMed] [Google Scholar]
- 19.Ghosh A., Elwell C., Smith M., “Review Article: Cerebral Near-Infrared Spectroscopy in Adults: A Work in Progress,” Anesth. Analg. 115(6), 1373–1383 (2012). 10.1213/ANE.0b013e31826dd6a6 [DOI] [PubMed] [Google Scholar]
- 20.Heekeren H. R., Kohl M., Obrig H., Wenzel R., von Pannwitz W., Matcher S. J., Dirnagl U., Cooper C. E., Villringer A., “Noninvasive Assessment of Changes in Cytochrome-c Oxidase Oxidation in Human Subjects During Visual Stimulation,” J. Cereb. Blood Flow Metab. 19(6), 592–603 (1999). 10.1097/00004647-199906000-00002 [DOI] [PubMed] [Google Scholar]
- 21.Yoshino K., Kato T., “Vector-based phase classification of initial dips during word listening using near-infrared spectroscopy,” Neuroreport 23(16), 947–951 (2012). 10.1097/WNR.0b013e328359833b [DOI] [PubMed] [Google Scholar]
- 22.Bale G., Mitra S., Meek J., Robertson N., Tachtsidis I., “A new broadband near-infrared spectroscopy system for in-vivo measurements of cerebral cytochrome-c-oxidase changes in neonatal brain injury,” Biomed. Opt. Express 5(10), 3450–3466 (2014). 10.1364/BOE.5.003450 [DOI] [PMC free article] [PubMed] [Google Scholar]


