

Abstract
Optical tweezers have emerged as a prominent light-based tool for pico-Newton (pN) force microscopy in mechanobiological studies. However, the efficacy of optical tweezers are limited in applications where concurrent metrology of the nano-sized structures under interrogation is essential to the quantitative analysis of its mechanical properties and various mechanotransduction events. We have developed an all-optical platform delivering pN force resolution in parallel with nano-scale structural imaging of the biological sample by combining optical tweezers with interferometric quantitative phase microscopy. These capabilities allow real-time micromanipulation and label-free measurement of sample’s nanostructures and nanomechanical responses, opening avenues to a wide range of new research possibilities and applications in biology.
OCIS codes: (350.4855) Optical tweezers or optical manipulation; (180.3170) Interference microscopy; (120.0120) Instrumentation, measurement, and metrology
1. Introduction
Optical tweezers (OTs) continue to remain a desired, and in many cases, the only non-destructive tool in biophysical studies that involve force measurements on the cellular, sub-cellular, and molecular scales [1–4]. Quantitative mechanobiological studies are relevant to understanding of cellular processes such as morphogenesis, differentiation, cytokinesis, growth, and motility [5]. We and others have utilized OTs to study membrane-based transduction [6, 7] and membrane-cytoskeleton interactions by extracting membrane nanotubes (tethers) from cells [8, 9].
While OTs provide excellent resolution in force measurements, sub-diffraction morphological changes in the load-bearing elements are undetectable using conventional microscopy. Super-resolution microscopy (SRM) methods employing fluorescent labels are not favorable as they impose changes on the molecular structures of the specimen [10] that affect its mechanical behavior [11]. Similarly, scanning probe SRM techniques such as atomic force microscopy (AFM) [12], tip-enhanced near-field optical microscopy [13], and the recent method of scanning optically trapped spheres for surface imaging [14] are not suitable for concurrent micromanipulation and wide-filed imaging of the sample. In addition to their poor temporal resolution for wide-field imaging, such techniques inherently disturb local force fields and may apply additional forces to the sample.
Although electron microscopy in fluids has been made possible [15], its application to live samples is limited mainly due to radiation damage and decreased resolution in imaging depth [16]. Low imaging contrast in addition to complex substrate, sample, and chamber preparations required to integrate electron microscopy with other microscopy modes further complicate its use in biological studies.
Interferometric quantitative phase microscopy (QPM) offers nanometer sensitivity to optical pathlength changes in transparent and semi-transparent objects, in a non-invasive and label-free manner [17]. The sample’s thickness and the mismatch between its refractive index (RI) and that of the surrounding medium result in optical pathlength delays that can be resolved at sub-nanometer resolution using QPM. Wide-field microscopy at video rates, nanometer sensitivity to changes in sample’s morphology, and the ease of integrating QPM methods with other investigative techniques (such as fluorescence microscopy) have led to a growing application of QPM in functional and structural biological studies [18, 19].
Here we report on a platform that for the first time combines stiffness-calibrated OTs with an interferometric QPM technique based on Zernike’s phase contrast and Gabor’s holography [20]. This combined optical micromanipulation and interferometric topography (COMMIT) platform allows simultaneous measurements of pN level forces with nm scale spatial resolution associated with the object under interrogation. Low coherence illumination and common-path interferometry allow for speckle-free imaging [20] at high phase stability [21].
2. Methods
2.1 COMMIT platform
Figure 1 shows a schematic of the COMMIT platform integrating OTs and interformetric QPM. We have previously reported the details of the OTs setup and stiffness calibration for optical micro manipulation and force microscopy [22]. Briefly, an Nd:YVO4 laser beam (Prisma 1064-V, Coherent) was expanded and coupled into an inverted microscope (Ti-Eclipse, Nikon Inc.) to form the optical trap. A 100X oil immersion objective lens (numerical aperture (NA) 1.49, Apo-TIRF, Nikon) was used for simultaneous imaging and optical trapping. A piezoelectric stage with 1 nm precision in x, y, and z coordinates was used to control the relative position of samples and the optical trap. Sulfate-modified polystyrene microspheres with mean diameter of 4.2 µm (Molecular probes) were used as handles for pulling tethers and optical probes for force measurements.
Fig. 1.

Schematic of the COMMIT platform. HL: Halogen lamp. CA: Condenser annulus. CL: Condenser lens. C: PZT controller. MO: Microscope objective. L: Nd:YVO4 laser. BE: Beam expander. M: Mirror. DM: Dichroic mirror. TL: Tube lens. BS: Beam splitter. FL: Focusing lens and IR filter. IP: Image plane and polarizer. L1 and L2: Achromatic doublets, f = 500 mm. SLM: Spatial light modulator. QPD: Quadrant photodetector. PZT: Piezoelectric translation stage.
The sample was illuminated by a 100W halogen lamp through a condenser annulus. Light that passes through the sample un-scattered (U0) forms the image of the condenser annulus at the Fourier plane of the achromatic doublet (L1). A reflective spatial light modulator (SLM) (Hamamatsu) was used in phase-only modulation mode in conjugation with a horizontal polarizer at the microscope’s output image plane to shift the phase of U0 in four π/2 steps. The un-scattered component interferes with the scattered light (U1) to form the sample’s image on the detector at the focal plane of the second achromatic doublet (L2).
An EM-CCD (C9100-13, Hamamatsu) captured the intensity maps of the sample (I1-4) corresponding to the four phase modulations. CCD’s exposure time was set to 30.5 ms. To accommodate full re-arrangement of the nematic liquid crystals in the SLM, field delays of 83 ms (SLM response time for a π/2 modulation) were used between the phase modulations. Twelve phase shifted images were acquired every second to yield quantitative phase resolved images at 3 fps. To obtain the phase delay map (φ), we first calculated the phase difference between U0 and U1 using the four intensity (I1-I4) maps:
| (1) |
The phase delay map was then calculated as:
| (2) |
where
| (3) |
The calculated phase delay map is correlated with the sample’s thickness along the propagation axis of the light (dz), center wavelength of the illumination (λ = 595 nm), and the local differences between the RIs of the sample and the surrounding medium (ns and nr, respectively):
| (4) |
We calibrated the stiffness of the optical trap against viscous drag forces since the trapped particle undergoes large displacements in our experiments [22]. Microspheres were trapped inside Modified Eagle Medium (MEM) at 37 °C, and a piezoelectric stage (Physik Instrumente) was used to move the trapping medium against the optically trapped particle at various speeds. For the force calibration process, microsphere’s displacements from the center of the optical trap were monitored at 10 KHz using a QPD (Pacific Silicon Sensor) in imaging mode, delivering a 10 nm resolution. Viscous drag forces were plotted against microsphere displacements to calculate the OTs stiffness (see Appendix for more details). Sub-pixel particle tracking [23] was used during cell experiments to calculate microsphere displacements in the CCD images at 10 nm spatial resolution.
2.2 Validation of interferometric QPM
A custom made microchip and polystyrene nanospheres of two different diameters were used to verify the validity of the topographical results. To fabricate the microchip, a microscope glass coverslip was spin coated with polymethylmethacrylate (MicroChem) at 4,000 rpm for 30 seconds. After spinning, the chip was transferred to a hot plate and heated to 180°C for 80 seconds. Arrays of patterns were then etched into the microchip using electron beam lithography (Leo SUPRA 55, Zeiss). The resulting patterns had depths ranging between 150 to 190 nm. An area on the chip was selected and imaged using AFM (Smart SPM-1000, AIST-NT Inc.) for comparison with the QPM topography results of the same region.
In addition to using the custom made microchip, we validated our system’s QPM measurements by imaging polystyrene nanospheres (Molecular Probes) with manufacturer-reported mean diameters ± standard deviation (SD) of 400 ± 17 nm and 630 ± 16 nm. The nanospheres were dispersed in water, transferred onto a microscope coverslip, and allowed to dry before imaging.
2.3 Cell culture and tether formation
We used the COMMIT platform to simultaneously form, image, and measure the dynamic forces associated with membrane tethers pulled from kidney (HEK-293) cells, as an illustrative nano-structured system. HEK-293 cells were seeded onto glass-bottom petri dishes coated with Poly-D-Lysine 24 hours before the experiments. Cells were cultured at 37 °C and 5% CO2 in a medium consisting of MEM and 10% fetal bovine serum. Prior to pulling tethers, cells were washed with 1X (≈ 320 mOsm) phosphate buffer saline, and the culture medium was replaced by a mixture of MEM and 4.2 µm microspheres. A microsphere was optically trapped and brought into contact with the membrane of an adhered cell until a surface attachment between the microsphere and the cell membrane was confirmed. The cell was then moved away from the optically trapped particle at 1 µm/s using the piezoelectric stage, extruding a membrane tether.
3. Results and discussion
The AFM-based topography and QPM-resolved image of the custom made microchip are shown in Figs. 2(ai) and 2(aii), respectively, and compared with each other in Fig. 2(aiii). While the lateral resolution of the quantitative phase image is diffraction limited, parallel to the direction of light propagation, QPM reported the size of the sub-diffraction structures within ± 7.2 nm of the corresponding features measured using AFM. The mean ± SD depth of the microchip features were measured as 179 ± 15 nm using AFM and 172 ± 16 nm using QPM. While there is excellent agreement in the peak height and phase values, as determined by AFM and QPM, respectively, there is a discrepancy between the neighboring peaks. We attribute this discrepancy to the halo effect intrinsic to phase imaging [24].
Fig. 2.

(a): Comparison between topographical results of AFM and QPM for a custom made microchip. (ai): Inverted AFM image of the custom made microchip; the color bar is in nanometers. (aii): QPM-resolved image of the region shown in (ai); color bar is in radians. (aiii): Overlapped cross sections of (ai) and (aii) along the dotted lines. Scale bars in panels (ai) and (aii) = 2 µm. (bi): Pseudo-3D representation of a quantitative phase image of two sets of polystyrene nanospheres. (bii): Phase profile of 400 nm diameter nanospheres. (biii): Phase profile of 630 nm diameter nanospheres. Manufacturer-reported mean ± SD diameters of the nanospheres were 400 ± 17 nm and 630 ± 16 nm. Diameters measured using QPM were 425 ± 13 nm and 616 ± 16 nm. Color bar is in radians. Scale bar = 5 µm.
Figure 2(b) shows the polystyrene nanospheres resolved by QPM. Assuming a value of 1.59 for npolystyrene nanosphere, the QPM-resolved mean ± SD nanosphere diameters of 425 ± 13 nm and 616 ± 16 nm are in good agreement with those reported by the manufacturer.
Figure 3 shows the quantitative phase image of a tether extracted from a HEK-293 cell using the COMMIT platform. In the absence of experimental methods to verify the nanostructure of cell membrane tethers, mechanical models of tethers have been widely based on the tenet that lipid membrane nanotubes exhibit perfect cylindrical shapes at equilibrium [25, 26]. For the first time, these label-free images reveal curvatures and diameter changes along the tether axis. Previous analyses, including those by our group [27] and others [28] had assumed a constant value of tether diameter (dtether) to estimate the bending energy of the membrane. Our observation of a non-uniform dtether, now suggests the importance of new analytical methods to accurately extract various membrane mechanical properties, and their spatially and temporally variations. The curved (catenoid) shape of the tether contour is in agreement with the predictions of recent multi-scale molecular models of bilayer nanotubes [29].
Fig. 3.
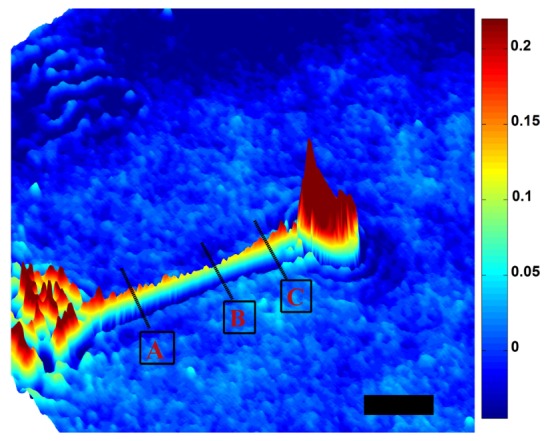
Pseudo-3D representation of the quantitative phase image of a tether extracted from a HEK-293 cell ≈ 40 s after elongation had stopped. Thinning along the tether axis results in a catenoid-like contour. Tether diameters at the A, B, and C boxed sections are measured as 456 nm, 253 nm, and 497 nm, respectively. Color bar is in radians. Scale bar = 5 µm.
Figure 4 and Visualization 1 (3.5MB, MOV) show illustrative examples of concurrent optical micromanipulation, force microscopy, and structural metrology during a membrane tether experiment. An optically trapped 4.2 µm microsphere was used to form a tether by detaching the cell membrane from the underlying cytoskeleton [Fig. 4(a)]. Following the detachment of a patch of membrane from the cytoskeleton, tether reaction force decreased during the elongation interval [Fig. 4(b)]. Membrane tether ruptures in reaction to the increased pulling force [Fig. 4(c)]. Subsequently, lipid bilayer re-assembled at the either ruptured end of the tether resulting in a brief reversal of the reaction force direction [Fig. 4(d)].
Fig. 4.

Dynamic quantitative measurement of membrane tether structure and reaction force during various time intervals (see Visualization 1 (3.5MB, MOV) ). (a): Tether formation interval. (b): Tether elongation interval. Tether reaction force decreased following the formation interval. (c): Increased pulling force resulted in tether rupture. (d): Lipid membrane reassembled on both ends of the ruptured tether and the direction of the reaction force was momentarily reversed (recoil). Increased diameters at both ends were resolved as a result of membrane folding. The arrows represent the magnitude and direction of tether reaction force. Color bars are in radians. Scale bars = 10 µm.
The maximum axial sensitivity of the QPM method depends on the RI difference between those of the sample (ns) and the surrounding medium (nmedia) [Eq. (4)], and is ultimately limited by the compound temporal phase noise of the system (5 mrad in our current setup). The QPM method employed in this study has been previously shown to produce topographical results from graphene structures at sub-nanometer accuracy [30]. In cellular applications, where low RI differences are involved (ncell reported in the range of 1.354 [31] to 1.8 [32] and nmedia = 1.337), the topography sensitivity of our platform ranges from 11 to 28 nm.
Some of the current limitations of our COMMIT system are related to imaging constrained to 2D (depth of field component not present), lateral resolution being diffraction limited, and the QPM speed with temporal resolution at 0.3 s. Fast transitions in the sample may result in a phase error (blur) depending on the acquisition rate of phase shifted images.
Given the diffraction limited lateral resolution of the imaging scheme, the phase resolved image may have motion blur if the corresponding points in the four phase shifted images fall outside of one airy disk. Therefore, in our system, the compound phase noise (5 mrad) is the dominant sensitivity noise for dynamic structural changes at rates of up to ~0.8 µm/s. Within this regime, the compound sensitivity noise is smaller than the average thermal fluctuations of cell membrane (e.g., 36 nm for erythrocyte membranes) [33], retaining the imaging sensitivity in measuring morphological changes in subcellular and membrane nanostructures.
In the tether extraction example presented in Figs. 4(a), 4(b), and Visualization 1 (3.5MB, MOV) , even though the motion is unidirectional and the tether has a simple and continuous geometry (tether diameter changing less than that of the compound noise between each two subsequently resolvable points along the tether), uncertainty due to motion blur in the measurements cannot be ruled out since the elongation rate is about 25% higher than the 0.8 µm/s limit. However, the contribution of the blur decreases below the compound noise for slower processes that follow upon termination of the elongation, which is the case for the image shown in Fig. 3.
While higher acquisition rates are needed to eliminate the blur in tracking processes such as fast vesicle transportation (up to 1.8 µm/s) [34], the current imaging rate can be reliably employed to monitor multitude of dynamic cellular processes. Our current platform can be used to study subcellular morphological changes at rates < 0.8 µm/s such as the changes in tethers held at constant lengths (as shown in Fig. 3), actin polymerization and filopodia growth in response to pulling forces in the range of 7 - 150 nm/s [35], nanoparticles transport inside cells (> 6 nm/s) [36], virus motility within cells (80 - 400 nm/s) [37], and cellular motility in 2 and 3 dimensions (> 100 nm/s) [38]. Furthermore, higher phase modulation rates (e.g. 10 ms/modulation) and use of microscope objectives with lower NA (e.g., 1.2) expand the range of transient phenomena that are resolvable with negligible motion blur to ~8 µm/s while still maintaining an stable optical trap.
Combined optical tweezers and QPM systems have been used to evaluate the thickness of erythrocytes at different orientations [39], and employed as a cell rotator to obtain 3D images of motile cells [40]. The COMMIT system offers the capability to obtain measurements of time-resolved forces exerted or delivered to a biological structure. Our system is also configured in common-path, which is more robust than Mach-Zender type paths [41].
Force-calibrated optical micromanipulation in conjunction with video rate QPM facilitates dynamic measurements of the transient nano-scale mechanical properties of cells and intracellular organelles by bridging nanomechanical measurements with real-time nano-structural information. The utility of force measurements is in characterization of the mechanical properties of cell membranes and quantification of the mechanical interactions between the membrane and the cytoskeleton. Cellular mechanical properties are also regarded as sensitive markers of disease [42, 43].
QPM conjoined with machine learning algorithms are also being investigated as a marker-free diagnostic tool in histopathology [19]. Therefore, COMMIT can potentially improve the reliability of the histological findings by combining both of these analytical capabilities in one platform. In mechanobiology studies, COMMIT can provide an unprecedented capability for simultaneous induction of precise mechanical stimuli along with quantitative analysis of the mechanical responses, and in-vivo measurement of the resulting sub-diffraction cell shape changes and organelle deformations [44].
4. Conclusions
We have provided the first demonstration of an experimental platform combining force calibrated OTs and QPM for concurrent optical micromanipulation at nanometer scale, pN force microscopy, and wide-field label-free non-invasive metrology of the sample with nanometer axial sensitivity. Our experimental platform provides capability to study a wide range of mechanobiological phenomena where simultaneous force quantification and nanometer measurements of biological structures may be needed.
Acknowledgments
This work was supported in part by a grant from the National Institutes of Health (2R01-DC02775) and National Science Foundation (BES-0522862). Additional support was provided by Bourns College of Engineering and the Center for Bioengineering Research at the University of California, Riverside.
Appendix.
The stiffness of the optical tweezers (OTs) was calibrated against calculated viscous-drag forces applied on an optically-trapped particle by moving the trapping medium against the particle. The trapped particle was imaged onto a quadrant photodetector (QPD) (Fig. 1), and its displacements were tracked using the displacement-calibrated differential voltage readouts of the QPD at 10 KHz. Position standard deviation of a stationary 4.2 µm diameter microsphere was < 10 nm as tracked using the QPD (Fig. 5
Fig. 5.
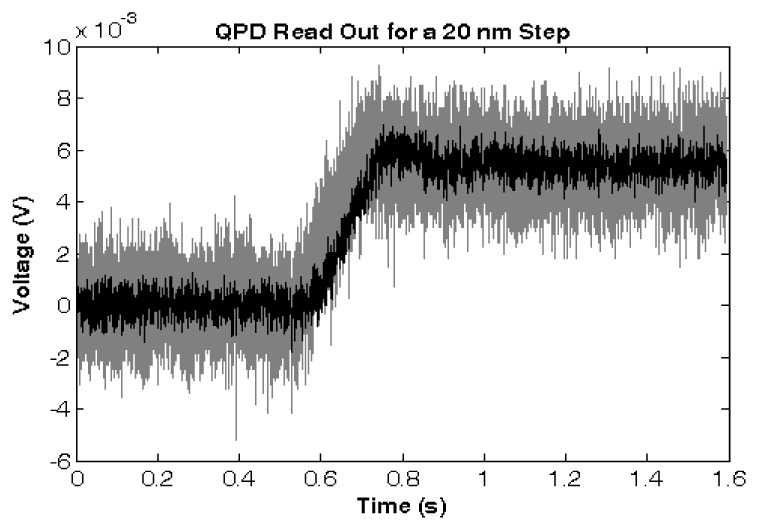
QPD voltage readout in response to a 20 nm PZT-controlled displacement of a 4.2 µm diameter microsphere through the focal spot of the laser beam, providing a signal-to-the-noise ratio of >2.
).
The viscous-drag force applied to the trapped microsphere was calculated as:
| (5) |
where η is the dynamic viscosity of Modified Eagle Medium (1.41 centipoise at 37 °C [45]), ν is the fluid velocity induced by the PTZ-controlled displacement of the trapping chamber, r is the radius of the microsphere (2.1 µm), and h is the height of the microsphere from the bottom of the trapping chamber (12 µm). Particle displacements from the center of the optical trap were tracked using the QPD, and plotted against the viscous-drag forces to calculate the OTs’ Hookean stiffness (Fig. 6
Fig. 6.
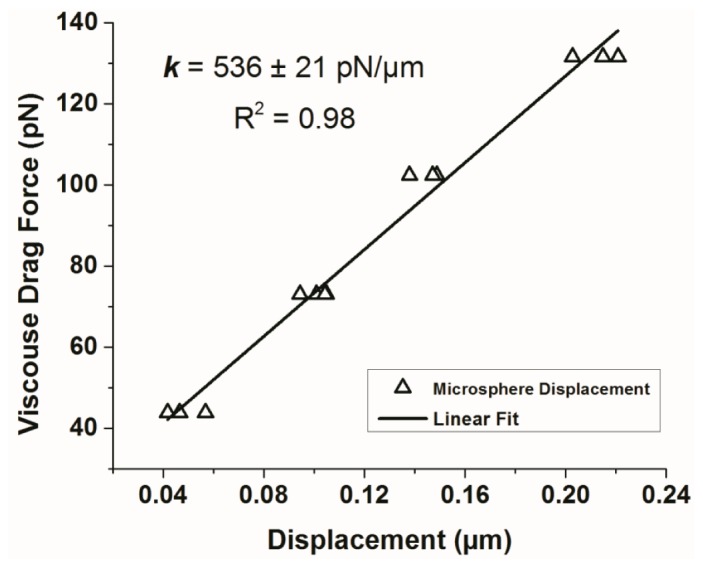
Stiffness calibration of the OTs. The Hookean stiffness (k) of the OTs is calculated as the slope of the linear fit to the displacement-force graph (F = kx).
).
References and links
- 1.Ashkin A., Schütze K., Dziedzic J. M., Euteneuer U., Schliwa M., “Force generation of organelle transport measured in vivo by an infrared laser trap,” Nature 348(6299), 346–348 (1990). 10.1038/348346a0 [DOI] [PubMed] [Google Scholar]
- 2.Blehm B. H., Selvin P. R., “Single-molecule fluorescence and in vivo optical traps: how multiple dyneins and kinesins interact,” Chem. Rev. 114(6), 3335–3352 (2014). 10.1021/cr4005555 [DOI] [PMC free article] [PubMed] [Google Scholar]
- 3.Fazal F. M., Block S. M., “Optical tweezers study life under tension,” Nat. Photonics 5(6), 318–321 (2011). 10.1038/nphoton.2011.100 [DOI] [PMC free article] [PubMed] [Google Scholar]
- 4.Siedlik M. J., Varner V. D., Nelson C. M., “Pushing, pulling, and squeezing our way to understanding mechanotransduction,” Methods 94, 4–12 (2016). [DOI] [PMC free article] [PubMed] [Google Scholar]
- 5.Iskratsch T., Wolfenson H., Sheetz M. P., “Appreciating force and shape—the rise of mechanotransduction in cell biology,” Nat. Rev. Mol. Cell Biol. 15(12), 825–833 (2014). 10.1038/nrm3903 [DOI] [PMC free article] [PubMed] [Google Scholar]
- 6.Brownell W. E., Qian F., Anvari B., “Cell membrane tethers generate mechanical force in response to electrical stimulation,” Biophys. J. 99(3), 845–852 (2010). 10.1016/j.bpj.2010.05.025 [DOI] [PMC free article] [PubMed] [Google Scholar]
- 7.Gauthier N. C., Fardin M. A., Roca-Cusachs P., Sheetz M. P., “Temporary increase in plasma membrane tension coordinates the activation of exocytosis and contraction during cell spreading,” Proc. Natl. Acad. Sci. U.S.A. 108(35), 14467–14472 (2011). 10.1073/pnas.1105845108 [DOI] [PMC free article] [PubMed] [Google Scholar]
- 8.Raucher D., Stauffer T., Chen W., Shen K., Guo S., York J. D., Sheetz M. P., Meyer T., “Phosphatidylinositol 4,5-bisphosphate functions as a second messenger that regulates cytoskeleton-plasma membrane adhesion,” Cell 100(2), 221–228 (2000). 10.1016/S0092-8674(00)81560-3 [DOI] [PubMed] [Google Scholar]
- 9.Khatibzadeh N., Spector A. A., Brownell W. E., Anvari B., “Effects of plasma membrane cholesterol level and cytoskeleton F-actin on cell protrusion mechanics,” PLoS One 8(2), e57147 (2013). 10.1371/journal.pone.0057147 [DOI] [PMC free article] [PubMed] [Google Scholar]
- 10.Bouvrais H., Pott T., Bagatolli L. A., Ipsen J. H., Méléard P., “Impact of membrane-anchored fluorescent probes on the mechanical properties of lipid bilayers,” Biochim. Biophys. Acta 1798(7), 1333–1337 (2010). 10.1016/j.bbamem.2010.03.026 [DOI] [PubMed] [Google Scholar]
- 11.Lulevich V., Shih Y. P., Lo S. H., Liu G. Y., “Cell tracing dyes significantly change single cell mechanics,” J. Phys. Chem. B 113(18), 6511–6519 (2009). 10.1021/jp8103358 [DOI] [PMC free article] [PubMed] [Google Scholar]
- 12.Müller D. J., Dufrêne Y. F., “Atomic force microscopy as a multifunctional molecular toolbox in nanobiotechnology,” Nat. Nanotechnol. 3(5), 261–269 (2008). 10.1038/nnano.2008.100 [DOI] [PubMed] [Google Scholar]
- 13.Mauser N., Hartschuh A., “Tip-enhanced near-field optical microscopy,” Chem. Soc. Rev. 43(4), 1248–1262 (2014). 10.1039/C3CS60258C [DOI] [PMC free article] [PubMed] [Google Scholar]
- 14.Friedrich L., Rohrbach A., “Surface imaging beyond the diffraction limit with optically trapped spheres,” Nat. Nanotechnol. 10(12), 1064–1069 (2015). 10.1038/nnano.2015.202 [DOI] [PubMed] [Google Scholar]
- 15.Thiberge S., Nechushtan A., Sprinzak D., Gileadi O., Behar V., Zik O., Chowers Y., Michaeli S., Schlessinger J., Moses E., “Scanning electron microscopy of cells and tissues under fully hydrated conditions,” Proc. Natl. Acad. Sci. U.S.A. 101(10), 3346–3351 (2004). 10.1073/pnas.0400088101 [DOI] [PMC free article] [PubMed] [Google Scholar]
- 16.de Jonge N., Ross F. M., “Electron microscopy of specimens in liquid,” Nat. Nanotechnol. 6(11), 695–704 (2011). 10.1038/nnano.2011.161 [DOI] [PubMed] [Google Scholar]
- 17.Kemper B., von Bally G., “Digital holographic microscopy for live cell applications and technical inspection,” Appl. Opt. 47(4), A52–A61 (2008). 10.1364/AO.47.000A52 [DOI] [PubMed] [Google Scholar]
- 18.Popescu G., Deflores L. P., Vaughan J. C., Badizadegan K., Iwai H., Dasari R. R., Feld M. S., “Fourier phase microscopy for investigation of biological structures and dynamics,” Opt. Lett. 29(21), 2503–2505 (2004). 10.1364/OL.29.002503 [DOI] [PubMed] [Google Scholar]
- 19.Sridharan S., Macias V., Tangella K., Kajdacsy-Balla A., Popescu G., “Prediction of prostate cancer recurrence using quantitative phase imaging,” Sci. Rep. 5, 9976 (2015). 10.1038/srep09976 [DOI] [PMC free article] [PubMed] [Google Scholar]
- 20.Wang Z., Millet L., Mir M., Ding H., Unarunotai S., Rogers J., Gillette M. U., Popescu G., “Spatial light interference microscopy (SLIM),” Opt. Express 19(2), 1016–1026 (2011). 10.1364/OE.19.001016 [DOI] [PMC free article] [PubMed] [Google Scholar]
- 21.Kemper B., Vollmer A., Rommel C. E., Schnekenburger J., von Bally G., “Simplified approach for quantitative digital holographic phase contrast imaging of living cells,” J. Biomed. Opt. 16(2), 026014 (2011). 10.1117/1.3540674 [DOI] [PubMed] [Google Scholar]
- 22.Sarshar M., Wong W. T., Anvari B., “Comparative study of methods to calibrate the stiffness of a single-beam gradient-force optical tweezers over various laser trapping powers,” J. Biomed. Opt. 19(11), 115001 (2014). 10.1117/1.JBO.19.11.115001 [DOI] [PMC free article] [PubMed] [Google Scholar]
- 23.Parthasarathy R., “Rapid, accurate particle tracking by calculation of radial symmetry centers,” Nat. Methods 9(7), 724–726 (2012). 10.1038/nmeth.2071 [DOI] [PubMed] [Google Scholar]
- 24.Wilson T., Sheppard C. J., “The halo effect of image processing by spatial frequency filtering,” Optik (Stuttg.) 59(1), 19–23 (1981). [Google Scholar]
- 25.Waugh R. E., Hochmuth R. M., “Mechanical equilibrium of thick, hollow, liquid membrane cylinders,” Biophys. J. 52(3), 391–400 (1987). 10.1016/S0006-3495(87)83227-7 [DOI] [PMC free article] [PubMed] [Google Scholar]
- 26.Brochard-Wyart F., Borghi N., Cuvelier D., Nassoy P., “Hydrodynamic narrowing of tubes extruded from cells,” Proc. Natl. Acad. Sci. U.S.A. 103(20), 7660–7663 (2006). 10.1073/pnas.0602012103 [DOI] [PMC free article] [PubMed] [Google Scholar]
- 27.Khatibzadeh N., Gupta S., Farrell B., Brownell W. E., Anvari B., “Effects of cholesterol on nano-mechanical properties of the living cell plasma membrane,” Soft Matter 8(32), 8350–8360 (2012). 10.1039/c2sm25263e [DOI] [PMC free article] [PubMed] [Google Scholar]
- 28.Sheetz M. P., “Cell control by membrane-cytoskeleton adhesion,” Nat. Rev. Mol. Cell Biol. 2(5), 392–396 (2001). 10.1038/35073095 [DOI] [PubMed] [Google Scholar]
- 29.Baoukina S., Marrink S. J., Tieleman D. P., “Molecular structure of membrane tethers,” Biophys. J. 102(8), 1866–1871 (2012). 10.1016/j.bpj.2012.03.048 [DOI] [PMC free article] [PubMed] [Google Scholar]
- 30.Wang Z., Chun I. S., Li X., Ong Z.-Y., Pop E., Millet L., Gillette M., Popescu G., “Topography and refractometry of nanostructures using spatial light interference microscopy,” Opt. Lett. 35(2), 208–210 (2010). 10.1364/OL.35.000208 [DOI] [PMC free article] [PubMed] [Google Scholar]
- 31.Curl C. L., Bellair C. J., Harris T., Allman B. E., Harris P. J., Stewart A. G., Roberts A., Nugent K. A., Delbridge L. M. D., “Refractive index measurement in viable cells using quantitative phase-amplitude microscopy and confocal microscopy,” Cytometry A 65(1), 88–92 (2005). 10.1002/cyto.a.20134 [DOI] [PubMed] [Google Scholar]
- 32.Przibilla S., Dartmann S., Vollmer A., Ketelhut S., Greve B., von Bally G., Kemper B., “Sensing dynamic cytoplasm refractive index changes of adherent cells with quantitative phase microscopy using incorporated microspheres as optical probes,” J. Biomed. Opt. 17(9), 097001 (2012). 10.1117/1.JBO.17.9.097001 [DOI] [PubMed] [Google Scholar]
- 33.Rappaz B., Barbul A., Hoffmann A., Boss D., Korenstein R., Depeursinge C., Magistretti P. J., Marquet P., “Spatial analysis of erythrocyte membrane fluctuations by digital holographic microscopy,” Blood Cells Mol. Dis. 42(3), 228–232 (2009). 10.1016/j.bcmd.2009.01.018 [DOI] [PubMed] [Google Scholar]
- 34.Morfini G., Pigino G., Mizuno N., Kikkawa M., Brady S. T., “Tau binding to microtubules does not directly affect microtubule-based vesicle motility,” J. Neurosci. Res. 85(12), 2620–2630 (2007). 10.1002/jnr.21154 [DOI] [PubMed] [Google Scholar]
- 35.Bornschlögl T., Romero S., Vestergaard C. L., Joanny J. F., Van Nhieu G. T., Bassereau P., “Filopodial retraction force is generated by cortical actin dynamics and controlled by reversible tethering at the tip,” Proc. Natl. Acad. Sci. U.S.A. 110(47), 18928–18933 (2013). 10.1073/pnas.1316572110 [DOI] [PMC free article] [PubMed] [Google Scholar]
- 36.Chithrani D. B., Dunne M., Stewart J., Allen C., Jaffray D. A., “Cellular uptake and transport of gold nanoparticles incorporated in a liposomal carrier,” Nanomedicine (Lond.) 6(1), 161–169 (2010). [DOI] [PubMed] [Google Scholar]
- 37.Mueller J., Pfanzelter J., Winkler C., Narita A., Le Clainche C., Nemethova M., Carlier M. F., Maeda Y., Welch M. D., Ohkawa T., Schmeiser C., Resch G. P., Small J. V., “Electron tomography and simulation of baculovirus actin comet tails support a tethered filament model of pathogen propulsion,” PLoS Biol. 12(1), e1001765 (2014). 10.1371/journal.pbio.1001765 [DOI] [PMC free article] [PubMed] [Google Scholar]
- 38.Fraley S. I., Feng Y., Krishnamurthy R., Kim D. H., Celedon A., Longmore G. D., Wirtz D., “A distinctive role for focal adhesion proteins in three-dimensional cell motility,” Nat. Cell Biol. 12(6), 598–604 (2010). 10.1038/ncb2062 [DOI] [PMC free article] [PubMed] [Google Scholar]
- 39.Cardenas N., Mohanty S. K., “Optical tweezers assisted quantitative phase imaging led to thickness mapping of red blood cells,” Appl. Phys. Lett. 103(1), 013703 (2013). 10.1063/1.4812985 [DOI] [Google Scholar]
- 40.Merola F., Miccio L., Memmolo P., Di Caprio G., Galli A., Puglisi R., Balduzzi D., Coppola G., Netti P., Ferraro P., “Digital holography as a method for 3D imaging and estimating the biovolume of motile cells,” Lab Chip 13(23), 4512–4516 (2013). 10.1039/c3lc50515d [DOI] [PubMed] [Google Scholar]
- 41.Mico V., Zalevsky Z., García J., “Common-path phase-shifting digital holographic microscopy: A way to quantitative phase imaging and superresolution,” Opt. Commun. 281(17), 4273–4281 (2008). 10.1016/j.optcom.2008.04.079 [DOI] [Google Scholar]
- 42.Cross S. E., Jin Y. S., Rao J., Gimzewski J. K., “Nanomechanical analysis of cells from cancer patients,” Nat. Nanotechnol. 2(12), 780–783 (2007). 10.1038/nnano.2007.388 [DOI] [PubMed] [Google Scholar]
- 43.Guck J., Schinkinger S., Lincoln B., Wottawah F., Ebert S., Romeyke M., Lenz D., Erickson H. M., Ananthakrishnan R., Mitchell D., Käs J., Ulvick S., Bilby C., “Optical deformability as an inherent cell marker for testing malignant transformation and metastatic competence,” Biophys. J. 88(5), 3689–3698 (2005). 10.1529/biophysj.104.045476 [DOI] [PMC free article] [PubMed] [Google Scholar]
- 44.Szafranski J. D., Grodzinsky A. J., Burger E., Gaschen V., Hung H.-H., Hunziker E. B., “Chondrocyte mechanotransduction: effects of compression on deformation of intracellular organelles and relevance to cellular biosynthesis,” Osteoarthritis Cartilage 12(12), 937–946 (2004). 10.1016/j.joca.2004.08.004 [DOI] [PubMed] [Google Scholar]
- 45.Denniss S., Rush J., “Polyvinylpyrrolidone can be used to cost-effectively increase the viscosity of culture media,” FASEB J. 29(1 Supplement), 1029.1019 (2015). [Google Scholar]