

Abstract
Objective:
We aimed to investigate the role of oxidative stress in the progression of multiple sclerosis (MS).
Methods:
We determined by liquid chromatography–tandem mass spectrometry nonenzymatic (F2-isoprostanes) and enzymatic oxidation products of arachidonic acid (prostaglandin F2α [PGF2α]) in plasma and CSF of 45 controls (other neurologic disease [OND] with no signs of inflammation) and 62 patients with MS. Oxidation products were correlated with disease severity and validated biomarkers of inflammation (chemokine ligand 13; matrix metalloproteinase-9; osteopontin) and axonal damage (neurofilament light protein).
Results:
Compared with OND controls, plasma concentrations of F2-isoprostanes and PGF2α were significantly lower in patients with progressive disease, and decreased with increasing disability score (Expanded Disability Status Scale). In contrast, CSF concentrations of PGF2α, but not F2-isoprostanes, were significantly higher in patients with progressive disease than OND controls (p < 0.01). The content of PGF2α in CSF increased with disease severity (p = 0.044) and patient age (p = 0.022), although this increase could not be explained by age. CSF PGF2α decreased with natalizumab and methylprednisolone treatment and was unaffected by the use of nonsteroidal anti-inflammatory drug in secondary progressive MS. CSF PGF2α did not associate with validated CSF markers of inflammation and axonal damage that themselves did not associate with the Expanded Disability Status Scale.
Conclusions:
Our data suggest that MS progression is associated with low systemic oxidative activity. This may contribute to immune dysregulation with CNS inflammation accompanied by increased local cyclooxygenase-dependent lipid oxidation.
Multiple sclerosis (MS) is usually relapsing-remitting at onset, but, with time, a majority of patients convert to a secondary progressive disease course, for which current therapies are ineffective. Recently, increased oxidative stress has been proposed as a pathogenic mechanism leading to progressive MS.1 However, a decrease in reactive oxygen species (ROS) derived from NADPH oxidase 2 has been associated with more severe experimental autoimmune encephalomyelitis, a model of MS.2,3 Moreover, disease progression correlates with altered activity of ROS-producing immune cells.4–6 Thus, changes in local and systemic oxidative stress are of interest for the transition into progressive MS, and we hypothesize that low oxidative stress may promote such progression.
F2-isoprostanes (F2-IPs) are considered the gold-standard biomarker of in vivo oxidative stress.7 They are formed predominantly via nonenzymatic oxidation of arachidonic acid (20:4). However, the most frequently determined F2-IP (8-iso-PGF2α), can also be generated during enzymatic oxidation of 20:4 to prostaglandin F2α (PGF2α), involving cyclooxygenase.8 As cyclooxygenase is significantly induced during inflammation, it can lead to incorrect biomarker assignment and interpretation.8 Therefore, we quantified the ROS-derived F2-IP and enzyme-derived PGF2α in plasma and CSF of patients with MS. We correlated these oxidation markers with disease severity, patient age, and other clinical measures. To explore whether CNS 20:4 oxidation changes with treatment, we also analyzed samples from 2 intervention studies of patients with progressive MS treated with natalizumab or methylprednisolone.
METHODS
Materials.
Standards of F2-IP (5[R]-iPF2α-VI, 5[S]-iPF2α-VI, 5-iPF2α-VI-d11, 8-iso-15[S]-PGF2α, 8-iso-15[R]-PGF2α, 8-iso-15[S]-PGF2α-d4, and 15[R]-PGF2α), 15(S)-PGF2α (hereafter referred to as PGF2α), 20:4, and 20:4-d8 were from Cayman Chemicals (Ann Arbor, MI). Artificial CSF was from Tocris Bioscience (Bristol, UK). Methanol (Fisher Scientific Inc.), hexane, and ethyl acetate (Lab Scan) were of high-performance liquid chromatography grade, and Bond Elut CertifyII SPE columns were from Agilent Technologies (Santa Clara, CA). Other chemicals were from Sigma, unless indicated otherwise.
Standard protocol approvals, registrations, and patient consents.
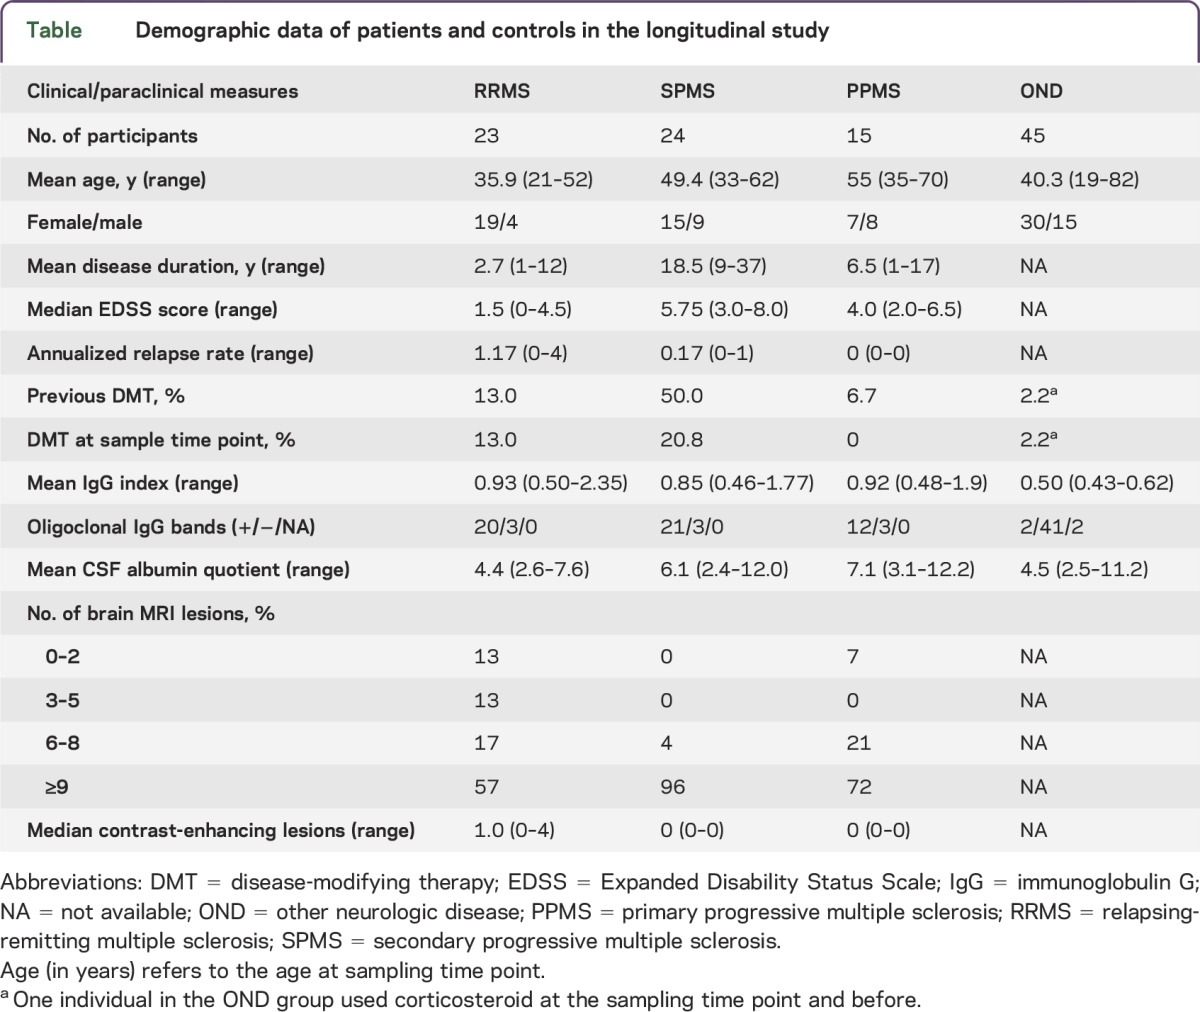
The ethical review boards of the Karolinska Institute in Sweden (DN: 2009/2107-31-2) approved the study involving 62 patients with MS with a diagnosis according to the revised McDonald criteria9 and a heterogeneous control group of 45 individuals with other neurologic diseases (ONDs) (see the table for demographic data). These controls with ONDs displayed no clinical and neuroradiologic features of MS and no signs of intrathecal inflammation as shown by the presence of oligoclonal bands, increased immunoglobulin G index, or pleocytosis (higher than upper normal limit, i.e., >5,000 cells/mL). The ethics committee of the Capital Region of Denmark approved the 2 intervention studies with natalizumab10 (n = 24) and methylprednisolone11 (n = 30). Written informed consent was obtained from all participants. Disease severity was assessed using the Expanded Disability Status Scale score. CSF was collected during diagnostic workup according to clinical routine,10,11 and for the Swedish study, venous EDTA blood samples were collected at the same time. Following centrifugation (15 minutes, 2,700g, room temperature), the resulting plasma was stored at −80°C until use. CSF mononuclear and polymorphonuclear cells were determined by flow cytometry and albumin with an automated system (Beckman Coulter UniCel DxC 800 Pro). Chemokine CXCL13, matrix metalloproteinase-9, osteopontin, and neurofilament light protein were determined using corresponding ELISA kits.12 Coded samples were shipped frozen on dry ice to Australia for liquid chromatography–tandem mass spectrometric analysis of F2-IP and PGF2α. Upon receipt, frozen samples were placed immediately at −80°C until analysis was performed blinded within 12 months. The Sydney Local Health District Ethics Review Committee (X12-0102 and HREC/12/RPAH/174) approved use and analyses of all human samples.
Table.
Demographic data of patients and controls in the longitudinal study
Sample preparation.
Frozen CSF and plasma samples were thawed for 4 minutes at 25°C, then kept on ice at all times. A solution of internal standards (1 ng 8-iso-15[S]-PGF2α-d4, 1 ng 5[R/S]-iPF2α-d11, and 2.5 μg 20:4-d8 in nitrogen-purged ethanol) was added to 1 mL of plasma or CSF and mixed briefly. Samples were subjected to alkaline hydrolysis by adding 1 mL 1 M KOH in methanol containing 0.005% butylated hydroxytoluene, purging each tube with nitrogen, followed by incubation at 37°C for 30 minutes. Samples were acidified with 2 mL of sodium acetate (100 mM, pH 4.6) and the pH-adjusted to 4.6 using HCl. Following centrifugation (10 minutes, 800g, 4°C), the supernate was applied to SPE columns preconditioned with 2 mL of methanol, followed by 2 mL of sodium acetate containing 5% (v/v) methanol, pH 7. Columns were washed with 2 mL of methanol/water (1:1, v/v) followed by 2 mL of ethyl acetate/hexane (1:3, v/v). Analytes were eluted with 2 mL of ethyl acetate/methanol (9:1, v/v), evaporated to dryness under nitrogen, and reconstituted in 50 μL of 50% methanol containing 0.01% acetic acid.
Liquid chromatography–tandem mass spectrometry.
PGF2α, F2-IP, and 20:4 in CSF and plasma were quantified by liquid chromatography–tandem mass spectrometry (QQQ 6490 mass spectrometer; Agilent Technologies) with an ESI source and multiple-reaction monitoring in negative ionization mode. A Zorbax Eclipse C18 column (2.1 × 50 mm, 1.8 μm; Agilent Technologies) was used for separation at a flow rate of 0.35 mL/min, with a gradient of A: 0.01% acetic acid in water, and B: 100% methanol. Solvent B was increased initially from 50% to 60% B in the first 15 minutes, then to 90% at 15.1 minutes, 100% at 20 minutes, and held for 3 minutes before re-equilibration at 50%. For quantification, specific ion pairs were monitored: 5-series F2-IP m/z 353 → 115; 5-iPF2α-VI-d11 m/z 364 → 115; 15-series F2-IP m/z 353 → 193; 15-F2t-IsoP-d4 m/z 357 → 197; 20:4 m/z 303 → 205; 20:4-d8 m/z 311 → 213. Quantification was achieved by peak area comparison with the corresponding internal standard, using Mass Hunter software. Only peaks coeluting with internal standard and with a signal-to-noise ratio of ≥3 (defined as limit of detection) were quantified. Results were expressed as amount of oxidized lipid per volume or 20:4 content. Samples in which F2-IP and PGF2α were below detection limit were not considered for statistical analyses, resulting in variable n-numbers for different F2-IP and PGF2α. The linearity and reproducibility of the assay was confirmed by spiking plasma or CSF before hydrolysis with authentic standards of 5-iPF2α-VI and 15-F2t-IsoP (0.05–2.5 ng/mL) or 20:4 (0.1–100 μg/mL). Intra- and interday coefficients of variation (calculated from the responses of the internal standards) were 1.8%–12.6% and 6.4%–15.2% for the 5-series F2-IPs, and 3.1%–12.2% and 2.9%–13.5% for the 15 series F2-IPs, respectively.
Statistical analyses.
Statistical analyses were performed using GraphPad Prism version 6.0 for Macintosh (San Diego, CA). For comparison of median values between >2 groups, Kruskal-Wallis test with Dunn posttest was used. Because this was an exploratory study, no adjustment for multiple comparisons was made. Correlation analyses were performed using Spearman ranked correlation at 95% confidence interval. For the intervention studies, statistical significance was determined by the Wilcoxon matched-pairs signed rank test.
RESULTS
Plasma F2-IPs decrease with MS progression.
We first examined systemic oxidative stress in progressive MS by measuring the concentrations of 20:4, F2-IP, and PGF2α in plasma of controls with OND and patients with MS at various disease stages. The method used allowed for quantification of 4 series of F2-IP (figure 1A). Because of the limited availability of authentic standards required for unambiguous assignment of chromatographic peaks, we restricted our analysis to F2-IP species for which standards were available commercially (figure 1B).
Figure 1. Arachidonic acid (20:4) oxidation pathways.

(A) General structures of the 4 series of F2-isoprostanes formed from 20:4 via radical (R•) mediated oxidation. (B) Chemical structures of the 20:4 oxidation products studied (B.a–B.f) and corresponding heavy isotope-labeled internal standards (B.g and B.h). Compounds B.a–B.e are formed via nonenzymatic oxidation of 20:4, whereas B.f is formed enzymatically and nonenzymatically.
Plasma concentrations of F2-IP and PGF2α were significantly lower in patients with progressive MS compared to patients with relapsing-remitting MS (RRMS) and OND controls (figure 2). This was true for individual 5- and 15-species and for the sum of products detected for each IP series. The amount of the oxidation products formed can be affected by the concentration of substrate13; however, plasma 20:4 concentrations did not vary between controls with OND and patients with MS (figure 2G). These results indicate that MS progression is not associated with increased systemic oxidative stress.
Figure 2. Decrease in F2-isoprostanes in blood plasma of patients with progressive MS.

Results show values (ng/mL plasma) for the specific 5-series products 5(R)-iPF2α (A) and 5(S)-iPF2α (B), the specific 15-series products 8-iso-15(R)-PGF2α (C), 8-iso-15(S)-PGF2α (D), and 15(R)-PGF2α (E), as well as the enzymatic product 15(S)-PGF2α (F) and the precursor arachidonic acid, 20:4 (G). Patients were classified as follows: ONDs (n = 45), RRMS (n = 23), SPMS (n = 24), and PPMS (n = 15). A heterogeneous group of individuals with ONDs (n = 45) were used as control with the following diagnoses: unspecified sensory disturbances (n = 18), different psychological symptoms (n = 6), dizziness (n = 1), unspecified headache (n = 4), chronic idiopathic fatigue (n = 1), balance disturbance (n = 1), visual disturbance (n = 2), muscle diseases (n = 2), trigeminal neuralgia (n = 1), ulcerative colitis (n = 1), spinal stenosis (n = 1), stroke (n = 1), polymyositis (n = 1), postcommotion syndrome (n = 1), unspecific sarcoidosis (n = 1), hypokalemia (n = 1), hypesthesia (n = 1), and Bechterew disease (n = 1). Data show results for individual participants and mean ± SEM. Statistical significance was determined by the Kruskal-Wallis multiple comparison test. **p < 0.01, ***p < 0.001, ****p < 0.0001. MS = multiple sclerosis; OND = other neurologic disease; PPMS = primary progressive MS; RRMS = relapsing-remitting MS; SPMS = secondary progressive MS.
PGF2α but not F2-IP is increased in CSF from patients with progressive MS.
We next determined 20:4 and 20:4 oxidation products in CSF from patients with MS and OND controls. Concentrations of different F2-IP species (figure 3, A–E) and 20:4 (figure 3G) were comparable in controls and patients. However, CSF of patients with progressive MS contained significantly higher concentrations of PGF2α than CSF of patients with RRMS and OND controls (figure 3F). Normalizing the F2-IP and PGF2α data to CSF 20:4 did not change the overall results, consistent with the similar concentrations of 20:4 in controls and patients with MS. These results indicate that MS is associated with an increase in enzymatic oxidation of 20:4 rather than general oxidative stress in the CNS.
Figure 3. Concentrations of F2-isoprostane in CSF of controls with OND (n = 33) and patients with multiple sclerosis who had different disease courses.

Disease courses included RRMS (n = 19), SPMS (n = 31), and PPMS (n = 25). Results show values (ng/mL CSF) for the specific 5-series products: 5(R)-iPF2α (A) and 5(S)-iPF2α (B); the specific 15-series products: 8-iso-15(R)-PGF2α (C), 8-iso-15(S)-PGF2α (D), 15(R)-PGF2α (E), and 15(S)-PGF2α (F), as well as arachidonic acid (G). Red symbols: second KI batch; black symbols: third KI batch; blue symbols: baseline samples from the Danish NAPMS Study. Data are shown for individuals and as means ± SEM. Statistical significance was determined by the Kruskal-Wallis multiple comparison test. *p < 0.05. OND = other neurologic disease; PPMS = primary progressive multiple sclerosis; RRMS = relapsing-remitting multiple sclerosis; SPMS = secondary progressive multiple sclerosis.
Associations among PGF2α, disease severity, CSF biomarkers, and age.
In CSF, the concentration of PGF2α increased with disease severity assessed by the Expanded Disability Status Scale score, irrespective of whether PGF2α was standardized to CSF volume (rs = 0.280, p = 0.044) (not shown) or normalized to 20:4 (figure e-1A at Neurology.org/nn). Such association was not observed for 8-iso-15(S) PGF2α (figure e-1B) and other F2-IP (not shown). In contrast to PGF2α, none of the validated CSF biomarkers determined correlated with disease severity (figure e-1, C–I). The CSF concentration of PGF2α (ng/μg 20:4) increased with patient age (figure e-1J), although it remained higher in progressive patients compared with age-matched controls with OND (figure e-1K). Also, CSF PGF2α remained higher in patients with secondary progressive MS taking nonsteroidal anti-inflammatory drugs compared with OND controls (figure e-1L). PGF2α did not correlate significantly with any of the biomarkers determined (figure e-2).
In plasma, the content of PGF2α and each individual F2-IP species decreased with increasing disease severity (figure e-3, A–F). Plasma PGF2α decreased with patient age (figure e-3G) but it remained significantly lower in progressive patients compared with age-matched OND controls (figure e-3H). As a result, the CSF/plasma ratio of PGF2α and F2-IP (except for 8-iso-15[R] PGF2α) were higher in patients with MS who had progressive disease compared with controls with OND (figure e-3, I–N), despite a decrease in the CSF/plasma ratio of 20:4 (figure e-3O). These data suggest that the disease-associated increase in CSF PGF2α originates from increased local enzymatic oxidation of 20:4 rather than circulating PGF2α. This interpretation is consistent with the absence of MS-associated increase in the CSF/plasma albumin ratio (figure e-3P).
Treatment effect on CSF lipid oxidation in progressive MS.
To assess whether lipid oxidation in CNS is affected by current MS therapies, we determined CSF F2-IP from patients with progressive MS treated with natalizumab or methylprednisolone.10,11 F2-IPs were affected variably by natalizumab: compared with baseline, the contents of 5(R)-iPF2α, 5(S)-iPF2α, 8-iso-15(R)-PGF2α, and 8-iso-15(S)-PGF2α (figure 4, A–D) decreased significantly following 60 weeks of treatment, while 15(R)-PGF2α remained unchanged (p = 0.563; figure 4E). In contrast to nonenzymatic 15(R)-PGF2α, its corresponding stereoisomer and enzymatic product, 15(S)-PGF2α, was significantly decreased after treatment compared with baseline (p = 0.002; figure 4F). CSF concentrations of 20:4 did not vary significantly between baseline and treatment (data not shown).
Figure 4. Natalizumab treatment decreases PGF2α in CSF of patients with secondary progressive MS and primary progressive MS.

Results are shown for the specific F2-IP 5-series: 5(R)-iPF2α (n = 12) (A) and 5(S)-iPF2α (n = 7) (B); and the 15-series: 8-iso-15(R)-PGF2α (n = 10) (C), 8-iso-15(S)-PGF2α (n = 11) (D), and 15(R)-PGF2α (n = 6) (E), as well as the enzymatic oxidation product 15(S)-PGF2α (n = 10) (F), respectively, before (baseline) and after treatment with natalizumab (60 weeks) with data expressed as ng/mL CSF. Data show results for individual participants and mean ± SEM. Open circle symbols represent values at or below detection limit. Dotted line represents the average LOD for each product. Statistical significance was determined by Wilcoxon matched-pairs signed rank test. LOD = limit of detection; MS = multiple sclerosis.
We repeated the above analyses in a separate set of CSF samples from patients with progressive MS at baseline and 60 weeks after treatment with methylprednisolone.11 In this cohort of 23 patients, PGF2α was detected in CSF samples of only 7 patients. In all of these patients, methylprednisolone treatment also significantly decreased PGF2α (p = 0.031) without changing the content of 20:4 (p = 0.819). Similar to the situation with natalizumab, CSF F2-IPs were generally but not consistently lower at 60 weeks compared with baseline, and this did reach statistical significance only in the case of 8-iso-15(S)-PGF2α (p = 0.031). Together, these results suggest that enzymatic lipid oxidation in CNS of progressive MS is decreased by modulating the enzymatic activity of inflammatory cells (with methylprednisolone) or blocking their migration into the CNS (with natalizumab).
DISCUSSION
There are 2 main new findings in the present study. First, compared with OND controls, the concentration of PGF2α in CSF is elevated in participants with progressive MS, and it increases with disease progression while it is decreased by treatment with natalizumab and methylprednisolone. The disease-associated increase in PGF2α does not simply reflect the heightened state of inflammation and breakdown of the blood–brain barrier typical of RRMS.14 Rather, it may represent pathologic responses to CNS resident cells, as disease severity did not correlate with CSF inflammatory cells and biomarkers, or the albumin ratio. Together, the data suggest that cyclooxygenase-mediated formation of PGF2α may have a role in the pathogenesis of progressive MS.
Second, plasma concentrations of F2-IP were significantly lower in patients with progressive MS than OND controls and patients with RRMS. This is consistent with progressive MS being a consequence of impaired NADPH oxidase-dependent oxidative dampening of systemic immune activation.2,3 A potential implication of these findings is that the use of antioxidants may be counterproductive, and that instead agents increasing NADPH oxidase activity may be worth considering.
Although not commonly recognized, our observation of increased CSF PGF2α in patients with progressive MS is in agreement with previous reports. Thus, cyclooxygenase-2 is expressed in CD64+ macrophages/microglia in actively demyelinating human lesions15 and in damaged or apoptotic oligodendrocytes.16 Cyclooxygenase-derived products in addition to PGF2α (PGE2, PGI2, and PGD2) are elevated in the CSF of patients with MS17 and animal models of the disease.18 Moreover, cyclooxygenase inhibition improves MS symptoms in models of the disease.19
The synthesis of prostaglandins is complex,20 with their biological effects mediated via specific cellular receptors. Our findings, combined with previous reports, suggest inhibition of prostaglandin synthesis or their action as a potential drug target(s) for the treatment of MS. Because selective cyclooxygenase inhibitors can have severe side effects,21 a better understanding of the processes that link elevated CSF PGF2α to MS is required to identify appropriate therapeutic targets to treat MS.18
In contrast to previous reports of increased oxidative stress in patients with MS,22,23 we found no evidence for MS being associated with an increase in CSF F2-IP, considered the “gold standard” for the assessment of in vivo oxidative stress.7 Consistent with our findings, others24,25 also reported no significant difference between patients with MS and controls in their CSF content of 8,12-iPF2α-VI (5-series F2-IP), determined by mass spectrometry. However, an increase in the CSF concentration of 8-iso-15(S)-PGF2α was reported in the CSF of patients with MS with F2-IP determined by ELISA.26–28 We attribute these apparent discrepancies to differences in the methods used to determine F2-IP. It is well known that results from ELISA are not directly comparable to those determined by mass spectrometry–based assays,29 with the former being less specific and commonly yielding higher values for 8-iso-15(S)-PGF2α than mass spectrometry–based assays. Thus, our findings are overall consistent with the literature and strongly suggest that oxidative stress is not increased in the CSF of patients with MS, and it does not appear to have a role in disease progression. While our study did not detect an increase in CSF F2-IP in patients with MS, it does not exclude the possibility that localized oxidative stress and damage to brain tissue contribute to the lesions observed in patients with MS.30
MS lesions are thought to arise as a result of the migration of immune cells through the blood–brain barrier, resulting in an inflammatory cascade that leads to myelin loss, axonal damage, and neuronal death.31 Binding of leukocytes α4-integrin to VCAM-1 on the vascular endothelium facilitates the migration of leukocytes across the blood–brain barrier.32 The humanized α4-integrin monoclonal antibody natalizumab blocks the recruitment of circulating immune cells to the CNS33 and it has recently been shown to reduce intrathecal inflammation and tissue damage in patients with progressive MS.11 The observed decrease in enzymatic and some nonenzymatic markers of 20:4 oxidation in the CSF after natalizumab treatment suggests that intrathecal pathogenic events are triggered by systemic immune cells entering the CNS and this may be amenable to treatment. Consequently, the reduced lipid oxidation following natalizumab treatment is driven by decreased intrathecal inflammation. The finding of decreased CSF PGF2α following treatment with the glucocorticoid methylprednisolone34 is also important since we found that treatment was associated with clinical improvement as well as improvement in magnetization transfer ratio measurements in brain MRI studies.11 This may reflect a direct effect of methylprednisolone on the biosynthesis of PGF2α rather than a general inhibition of intrathecal inflammation since we found little effect of monthly methylprednisolone pulse treatment on a panel of other biomarkers in progressive MS.11 The lack of correlation between CSF PGF2α and validated inflammatory biomarkers, and the differences in their response to treatments, further suggests that multiple pathologic mechanisms coexist in patients with MS contributing to the complexity of this disease.
Our results indicate the potential utility of CSF PGF2α as a biomarker of progressive MS. However, the causal role of any abnormal finding in MS, such as an increase in CSF PGF2α, will need experimental support because it can also represent events secondary to the disease process, for example a reduced level of physical activity resulting from ambulation handicap. Currently used MRI biomarkers are adequate for patients with RRMS but do not reflect the complex pathogenesis of progressive MS. Although mass spectrometry–based determination of PGF2α is labor-intense, the specificity and reproducibility of the quantitative data for the 6 prostanoids investigated (figure 1B), over several separate batches of analyses and involving 3 independent cohorts of patients from 2 different sites, cannot be achieved with other laboratory methods.
The decrease in plasma concentration of several types of F2-IP in patients with MS is important. If replicated, plasma F2-IP could serve as a more easily obtainable biomarker for progressive MS. The data are consistent with rodent studies that imply a genetic deficiency in NADPH oxidase–derived ROS to contribute to progressive MS via inadequate oxidative dampening of immune competent cells.2,3 Thus, there is a possible role for regulation of the oxidative burst in humans, and genetic characteristics may be decisive in whether, how soon, and how serious the development of progressive MS ensues. To date, genetic studies have largely been restricted to incidence of disease, while correlation with disease severity and progression remains to be determined.
This study shows that PGF2α is significantly increased in the CSF of patients with progressive MS and that this is associated with disease severity and amenable to treatment, but independent of age. Since PGF2α has biological activities, such as modulation of immunologic effector cell functions35,36 and vasoconstriction,37 our results warrant future studies addressing whether cyclooxygenase-derived oxidation products of 20:4, including PGF2α, contribute to MS pathogenesis. In addition, the surprisingly low systemic concentrations of F2-IP deserve further attention regarding potential mechanisms of disease progression, its treatment, and in relation to their use as systemic biomarker.
Supplementary Material
GLOSSARY
- F2-IP
F2-isoprostane
- MS
multiple sclerosis
- OND
other neurologic disease
- PGF2α
prostaglandin F
- ROS
reactive oxygen species
- RRMS
relapsing-remitting multiple sclerosis
Footnotes
Supplemental data at Neurology.org/nn
Funding information and disclosures are provided at the end of the article. Go to Neurology.org/nn for full disclosure forms. The Article Processing Charge was paid by the authors.
AUTHOR CONTRIBUTIONS
M. Lam: study design, analyses or interpretation of data, drafting or revising the manuscript. G. Maghzal: analyses or interpretation of data, drafting or revising the manuscript. M. Khademi: study design or conceptualization, analyses or interpretation of data, drafting or revising the manuscript. F. Piehl: study design or conceptualization, analyses or interpretation of data, drafting or revising the manuscript. R. Ratzer: study design or conceptualization, drafting or revising the manuscript. J. Romme Christensen: study design or conceptualization, analyses or interpretation of data, drafting or revising the manuscript. F. Sellebjerg: study design or conceptualization, analyses or interpretation of data, drafting or revising the manuscript. T. Olsson: study design and conceptualization, analyses or interpretation of data, drafting or revising the manuscript. R. Stocker: study design and conceptualization, analyses or interpretation of data, drafting or revising the manuscript. All authors accept responsibility for conduct of research and give final approval.
STUDY FUNDING
This work was supported by grants from the National Health and Medical Research Council of Australia (1003484 and 1037879 to R.S.), the Office of Health and Medical Research, NSW State Government, the European Commission Directorate-General for Research & Innovation (HEALTH-F2-2012-278611), the Swedish Research Council (F.P. and T.O.), the Danish MS Society, the Danish Council for Strategic Research, Brdr. Rønje Holding, the Lounkær Foundation, the AFA Foundation, Knut and Alice Wallenberg Foundation, and the Swedish Brain Foundation.
DISCLOSURE
M. Lam, G. Maghzal, and M. Khademi report no disclosures. F. Piehl served on the data safety monitoring committee for Parexel/Chugai, received research support from Biogen, Novartis, Genzyme. R. Ratzer received travel funding from Biogen Idec, Genzyme. J. Christensen served on the scientific advisory board for Biogen Idec, received travel funding and/or speaker honoraria from Biogen, TEVA, Novartis, consulted for Biogen, TEVA. F.T. Sellebjerg served on the scientific advisory board for Biogen Idec, Genzyme, Merck Serono, Sanofi-Aventis, Teva, Novo Nordisk, received travel funding and/or speaker honoraria from Biogen, Bayer Schering, Genzyme, Merck Serono, Novartis, Sanofi-Aventis, Schering-Plough, Teva, is a section editor for Multiple Sclerosis and Related Disorders, consulted for Biogen Idec, received research support from Biogen Idec, Sanofi-Aventis, Novartis, Danish Strategic Research Council, Danish Multiple Sclerosis Society, Lounkær Foundation. T. Olsson served on the scientific advisory board for Merck Serono, Biogen Idec, Genzyme/Sanofi-Aventis, Novartis, received speaker honoraria from Novartis, Biogen Idec, Sanofi-Aventis, Merck, Genzyme, MedImmune, was coeditor for Current Opinion in Immunology; received research support from Merck, Biogen Idec, Sanofi-Aventis, Bayer, Novartis, AstraZeneca, The Swedish Research Council, Euratrans Neurinox, CombiMS, Swedish Brain Foundation, AFA Foundation, Knut and Alice Wallenberg Foundation, Genzyme, EURATrans. R. Stocker served on the editorial board for Free Radical Biology & Medicine, Antioxidant Redox Signaling, Redox Report, Redox Biology, Archives of Biochemistry and Biophysics, received research support from AstraZeneca, National Health and Medical Research Council of Australia, Office of Health and Medical Research, NSW State Government, Australia. Go to Neurology.org/nn for full disclosure forms.
REFERENCES
- 1.Fischer MT, Sharma R, Lim JL, et al. NADPH oxidase expression in active multiple sclerosis lesions in relation to oxidative tissue damage and mitochondrial injury. Brain 2012;135:886–899. [DOI] [PMC free article] [PubMed] [Google Scholar]
- 2.Hultqvist M, Olofsson P, Holmberg J, Bäckström BT, Tordsson J, Holmdahl R. Enhanced autoimmunity, arthritis, and encephalomyelitis in mice with a reduced oxidative burst due to a mutation in the Ncf1 gene. Proc Natl Acad Sci USA 2004;101:12646–12651. [DOI] [PMC free article] [PubMed] [Google Scholar]
- 3.Holmdahl R, Sareila O, Pizzolla A, et al. Hydrogen peroxide as an immunological transmitter regulating autoreactive T cells. Antioxid Redox Signal 2013;18:1463–1474. [DOI] [PubMed] [Google Scholar]
- 4.Lassmann H, Bruck W, Lucchinetti CF. The immunopathology of multiple sclerosis: an overview. Brain Pathol 2007;17:210–218. [DOI] [PMC free article] [PubMed] [Google Scholar]
- 5.Ratzer R, Sondergaard HB, Christensen JR, et al. Gene expression analysis of relapsing-remitting, primary progressive and secondary progressive multiple sclerosis. Mult Scler 2013;19:1841–1848. [DOI] [PubMed] [Google Scholar]
- 6.Romme Christensen J, Bornsen L, Ratzer R, et al. Systemic inflammation in progressive multiple sclerosis involves follicular T-helper, Th17- and activated B-cells and correlates with progression. PLoS One 2013;8:e57820. [DOI] [PMC free article] [PubMed] [Google Scholar]
- 7.Kadiiska MB, Gladen BC, Baird DD, et al. Biomarkers of Oxidative Stress Study III. Effects of the nonsteroidal anti-inflammatory agents indomethacin and meclofenamic acid on measurements of oxidative products of lipids in CCl4 poisoning. Free Radic Biol Med 2005;38:711–718. [DOI] [PubMed] [Google Scholar]
- 8.van 't Erve TJ, Lih FB, Kadiiska MB, Deterding LJ, Eling TE, Mason RP. Reinterpreting the best biomarker of oxidative stress: the 8-iso-PGF2α/PGF2α ratio distinguishes chemical from enzymatic lipid peroxidation. Free Radic Biol Med 2015;83:245–251. [DOI] [PMC free article] [PubMed] [Google Scholar]
- 9.Polman CH, Reingold SC, Banwell B, et al. Diagnostic criteria for multiple sclerosis: 2010 revisions to the McDonald criteria. Ann Neurol 2011;69:292–302. [DOI] [PMC free article] [PubMed] [Google Scholar]
- 10.Romme Christensen J, Ratzer R, Börnsen L, et al. Natalizumab in progressive MS: results of an open-label, phase 2A, proof-of-concept trial. Neurology 2014;82:1499–1507. [DOI] [PubMed] [Google Scholar]
- 11.Ratzer R, Iversen P, Börnsen L, et al. Monthly oral methylprednisolone pulse treatment in progressive multiple sclerosis. Mult Scler 2016;22:926–934. [DOI] [PubMed] [Google Scholar]
- 12.Romme Christensen J, Börnsen L, Khademi M, et al. CSF inflammation and axonal damage are increased and correlate in progressive multiple sclerosis. Mult Scler 2013;19:877–884. [DOI] [PubMed] [Google Scholar]
- 13.Halliwell B, Lee CY. Using isoprostanes as biomarkers of oxidative stress: some rarely considered issues. Antioxid Redox Signal 2010;13:145–156. [DOI] [PubMed] [Google Scholar]
- 14.Lassmann H, van Horssen J, Mahad D. Progressive multiple sclerosis: pathology and pathogenesis. Nat Rev Neurol 2012;8:647–656. [DOI] [PubMed] [Google Scholar]
- 15.Rose JW, Hill KE, Watt HE, Carlson NG. Inflammatory cell expression of cyclooxygenase-2 in the multiple sclerosis lesion. J Neuroimmunol 2004;149:40–49. [DOI] [PubMed] [Google Scholar]
- 16.Carlson NG, Rojas MA, Redd JW, et al. Cyclooxygenase-2 expression in oligodendrocytes increases sensitivity to excitotoxic death. J Neuroinflamm 2010;7:25. [DOI] [PMC free article] [PubMed] [Google Scholar]
- 17.Dore-Duffy P, Donaldson JO, Koff T, Longo M, Perry W. Prostaglandin release in multiple sclerosis: correlation with disease activity. Neurology 1986;36:1587–1590. [DOI] [PubMed] [Google Scholar]
- 18.Kihara Y, Matsushita T, Kita Y, et al. Targeted lipidomics reveals mPGES-1-PGE2 as a therapeutic target for multiple sclerosis. Proc Natl Acad Sci USA 2009;106:21807–21812. [DOI] [PMC free article] [PubMed] [Google Scholar]
- 19.Palumbo S, Toscano CD, Parente L, Weigert R, Bosetti F. The cyclooxygenase-2 pathway via the PGE2 EP2 receptor contributes to oligodendrocytes apoptosis in cuprizone-induced demyelination. J Neurochem 2012;121:418–427. [DOI] [PMC free article] [PubMed] [Google Scholar]
- 20.Ueno N, Murakami M, Tanioka T, et al. Coupling between cyclooxygenase, terminal prostanoid synthase, and phospholipase A2. J Biol Chem 2001;276:34918–34927. [DOI] [PubMed] [Google Scholar]
- 21.Juni P, Nartey L, Reichenbach S, Sterchi R, Dieppe PA, Egger M. Risk of cardiovascular events and rofecoxib: cumulative meta-analysis. Lancet 2004;364:2021–2029. [DOI] [PubMed] [Google Scholar]
- 22.Ferretti G, Bacchetti T, Principi F, et al. Increased levels of lipid hydroperoxides in plasma of patients with multiple sclerosis: a relationship with paraoxonase activity. Mult Scler 2005;11:677–682. [DOI] [PubMed] [Google Scholar]
- 23.Fischer MT, Wimmer I, Hoftberger R, et al. Disease-specific molecular events in cortical multiple sclerosis lesions. Brain 2013;136:1799–1815. [DOI] [PMC free article] [PubMed] [Google Scholar]
- 24.Mattsson N, Haghighi S, Andersen O, et al. Elevated cerebrospinal fluid F2-isoprostane levels indicating oxidative stress in healthy siblings of multiple sclerosis patients. Neurosci Lett 2007;414:233–236. [DOI] [PubMed] [Google Scholar]
- 25.Teunissen CE, Sombekke M, van Winsen L, et al. Increased plasma 8, 12-iso-iPF2alpha-VI levels in relapsing multiple sclerosis patients are not predictive of disease progression. Mult Scler 2012;18:1092–1098. [DOI] [PubMed] [Google Scholar]
- 26.Greco A, Minghetti L, Sette G, Fieschi C, Levi G. Cerebrospinal fluid isoprostane shows oxidative stress in patients with multiple sclerosis. Neurology 1999;53:1876–1879. [DOI] [PubMed] [Google Scholar]
- 27.Mir F, Lee D, Ray H, Sadiq SA. CSF isoprostane levels are a biomarker of oxidative stress in multiple sclerosis. Neurol Neuroimmunol Neuroinflamm 2014;1:e21. doi: 10.1212/NXI.0000000000000021. [DOI] [PMC free article] [PubMed] [Google Scholar]
- 28.Sbardella E, Greco A, Stromillo ML, et al. Isoprostanes in clinically isolated syndrome and early multiple sclerosis as biomarkers of tissue damage and predictors of clinical course. Mult Scler 2013;19:411–417. [DOI] [PubMed] [Google Scholar]
- 29.Proudfoot J, Barden A, Mori TA, et al. Measurement of urinary F2-isoprostanes as markers of in vivo lipid peroxidation-A comparison of enzyme immunoassay with gas chromatography/mass spectrometry. Anal Biochem 1999;272:209–215. [DOI] [PubMed] [Google Scholar]
- 30.Haider L, Fischer MT, Frischer JM, et al. Oxidative damage in multiple sclerosis lesions. Brain 2011;134:1914–1924. [DOI] [PMC free article] [PubMed] [Google Scholar]
- 31.Ffrench-Constant C. Pathogenesis of multiple sclerosis. Lancet 1994;343:271–275. [DOI] [PubMed] [Google Scholar]
- 32.Engelhardt B. The role of alpha 4-integrin in T lymphocyte migration into the inflamed and noninflamed central nervous system. Curr Top Microbiol Immunol 1998;231:51–64. [DOI] [PubMed] [Google Scholar]
- 33.Bielekova B, Becker BL. Monoclonal antibodies in MS: mechanisms of action. Neurology 2010;74(suppl 1):S31–S40. [DOI] [PMC free article] [PubMed] [Google Scholar]
- 34.Schweingruber N, Reichardt SD, Luhder F, Reichardt HM. Mechanisms of glucocorticoids in the control of neuroinflammation. J Neuroendocrinol 2012;24:174–182. [DOI] [PubMed] [Google Scholar]
- 35.Goldyne ME. Prostaglandins and the modulation of immunological responses. Int J Dermatol 1977;16:701–712. [DOI] [PubMed] [Google Scholar]
- 36.Pelus LM, Strausser HR. Prostaglandins and the immune response. Life Sci 1977;20:903–913. [DOI] [PubMed] [Google Scholar]
- 37.Kauffman GL Jr, Whittle BJ. Gastric vascular actions of prostanoids and the dual effect of arachidonic acid. Am J Physiol 1982;242:G582–G587. [DOI] [PubMed] [Google Scholar]
Associated Data
This section collects any data citations, data availability statements, or supplementary materials included in this article.