Abstract
Maladaptive aggressive behavior is associated with a number of neuropsychiatric disorders1 and is thought to partly result from inappropriate activation of brain reward systems in response to aggressive or violent social stimuli2. Nuclei within the ventromedial hypothalamus3–5, extended amygdala6 and limbic7 circuits are known to encode initiation of aggression; however, little is known about the neural mechanisms that directly modulate the motivational component of aggressive behavior8. To address this, we established a mouse model to measure the valence of aggressive inter-male social interaction with a smaller subordinate intruder as reinforcement for the development of conditioned place preference (CPP). Aggressors (AGG) develop a CPP, while non-aggressors (NON) develop a conditioned place aversion (CPA), to the intruder-paired context. Further, we identify a functional GABAergic projection from the basal forebrain (BF) to the lateral habenula (lHb) that bi-directionally controls the valence of aggressive interactions. Circuit-specific silencing of GABAergic BF-lHb terminals of AGG with halorhodopsin (NpHR3.0) increases lHb neuronal firing and abolishes CPP to the intruder-paired context. Activation of GABAergic BF-lHb terminals of NON with channelrhodopsin (ChR2) decreases lHb neuronal firing and promotes CPP to the intruder-paired context. Lastly, we show that altering inhibitory transmission at BF-lHb terminals does not control the initiation of aggressive behavior. These results demonstrate that the BF-lHb circuit plays a critical role in regulating the valence of inter-male aggressive behavior and provide novel mechanistic insight into the neural circuits modulating aggression reward processing.
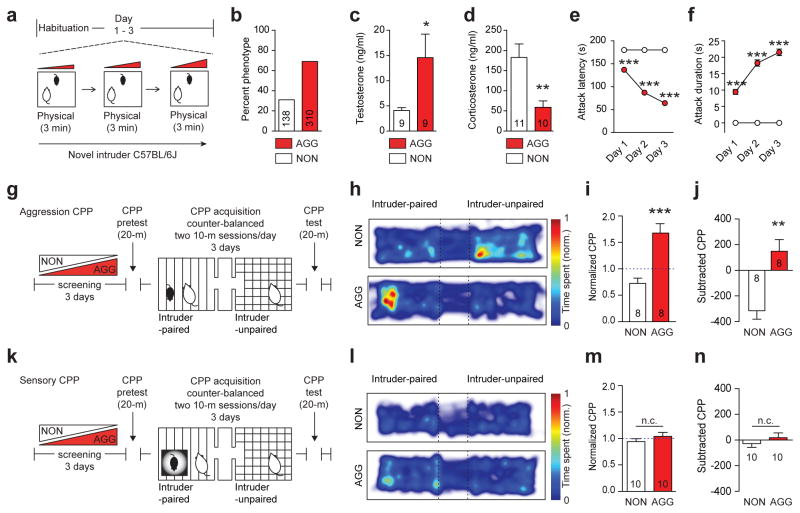
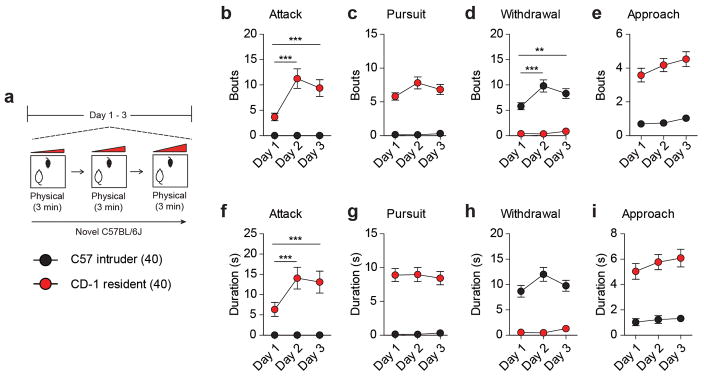
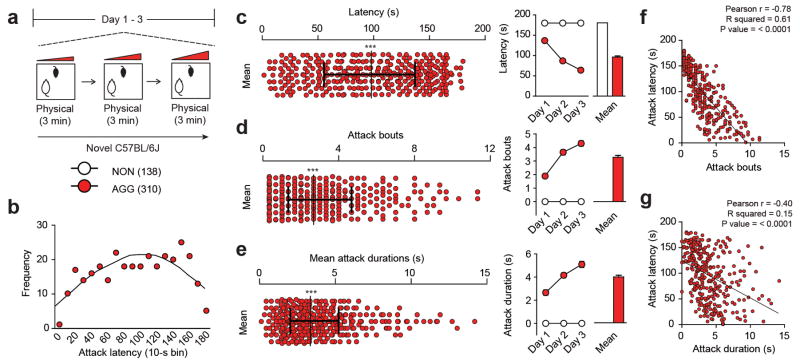
To study individual differences in aggression, we adapted the sensory contact model of social defeat for CD-1 mice9–11 that exhibit a wide spectrum of aggressive behaviors. In this procedure (Fig. 1a), a sexually experienced adult male CD-1 mouse is presented with a series of novel 6–8 week old subordinate male C57BL/6J intruder mice, who do not themselves exhibit any aggressive behaviors towards CD-1s (Extended Data Figure 1a–i). This procedure identifies individual differences in antagonist aggressive behaviors without producing lasting stress-related behavioral phenotypes (Extended Data Table 1). Ethological analysis revealed that approximately 70% (310/448) of mice exhibited aggressive behavior (termed aggressors, AGG) during at least one session, while approximately 30% (138/448) failed to initiate aggressive behavior (termed non-aggressors, NON) at any time (Fig. 1b).
Figure 1. Individual differences in aggression-related reward behavior.
(a) Aggression screening experimental schematic. (b) Percent mice exhibiting aggressive (AGG) versus non-aggressive (NON) behaviors. (c) Serum testosterone (t16 = 2.23, *P < 0.05; two-tailed unpaired t-test, n = 9/group) and (d) corticosterone (t19 = 3.231, **P < 0.01; two-tailed unpaired t-test, n = 10–11/group). Mean (e) latency to attack (F2,1338 = 49.37, two-way ANOVA P < 0.001; post hoc test, ***P < 0.001; n = 138–310) and (f) attack duration (F2,1338 = 22.35, two-way ANOVA P < 0.001; post hoc test, ***P < 0.001; n = 138–310). (g) Aggression conditioned place preference (CPP) schematic. (h) Representative heatmaps of aggression CPP. (i) Normalized (t14 = 4.706, ***P < 0.001; two-tailed unpaired t-test, n = 8/group) and (j) subtracted CPP score (t14 = 4.013, **P < 0.01; two-tailed unpaired t-test, n = 8/group). (k) Sensory CPP schematic. (l) Representative heatmaps of sensory CPP. (m) Normalized (t18 = 1.023, P > 0.05; two-tailed unpaired t-test, n = 10/group) and (n) subtracted CPP score (t18 = 0.961, P > 0.05; two-tailed unpaired t-test, n = 10/group). Summary data are represented as mean ± s.e.m. NON, non-aggressor; AGG, aggressor; n.c., no change.
Following repeated intruder interactions, AGG have elevated serum testosterone (Fig. 1c) and decreased corticosterone (Fig. 1d) levels relative to NON, suggesting that NON may be less dominant and experience forced intruder interactions as more stressful. Analysis of several common metrics for aggression revealed normalized distributions across AGG that increased between screening sessions (Fig. 1e–f, Extended Data Figure 2a–g). Importantly, the mean number of attack bouts (Extended Data Figure 2f) and mean duration of attack bouts (Extended Data Figure 2g) significantly correlate to mean attack latency. Therefore, attack latency provides a reliable index of aggression behaviors. Subsequently, we focused on AGG that exhibited attack latencies within the most aggressive quartile of the sample distribution. These data confirm that outbred CD-1 mice exhibit a wide spectrum of aggressive behavior and physiological responses to an intruder, leading us to hypothesize that there may be differences in the valence of intruder interactions among AGG and NON.
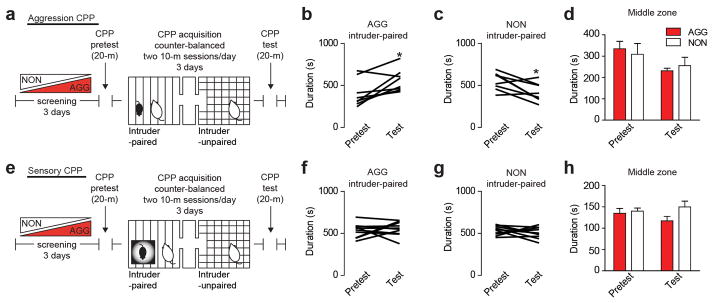
To assay the motivational state associated with intruder pairings, we developed an aggression-based conditioned place preference (CPP) procedure. In this model, CD-1 mice are screened for aggression phenotype and then conditioned for CPP (Fig. 1g) by receiving novel C57BL/6J intruder-paired or intruder-unpaired sessions twice a day for three days. AGG show a CPP for the intruder-paired context, while NON show a conditioned place aversion (CPA) (Fig 1h–j, Extended Data Figure 3a–d). CPA in NON does not appear to result from baseline differences in mood and anxiety or lack of interest in social targets (Extended Data Table 1 and 2). However, we found that the valence of intruder interactions in AGG and NON is dependent upon intruder mice being freely moving and physically accessible during conditioning. Using a sensory CPP procedure in which the intruder mouse is placed in a protective cage within the intruder-paired context, both CPP and CPA are abolished (Fig. 1 k–n, Extended Data Figure 3e–h). These data demonstrate individual differences in the positive or negative valence of intruder interactions in AGG versus NON.
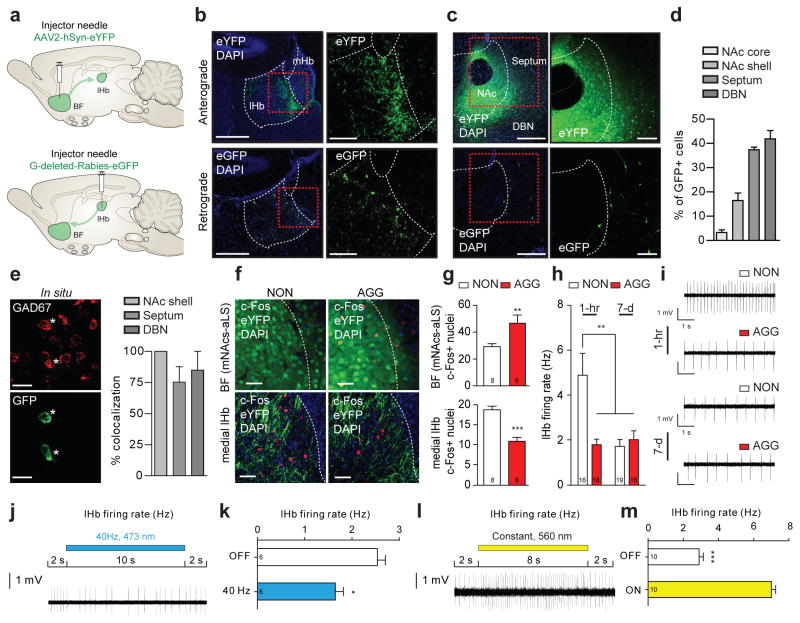
Clinical2,12 and pre-clinical8 studies have implicated basal forebrain (BF) structures, such as the nucleus accumbens (NAc), lateral septum (LS), and diagonal band nuclei (DBN), as potentially important brain regions controlling aggression-related behaviors. However, there has been limited functional evidence that the BF, or its projections, directly modulate the rewarding aspects of aggression. To define BF projections, we injected an adeno-associated virus (AAV) vector expressing enhanced yellow fluorescent protein (eYFP) under a neuronal-specific human synapsin (hSyn) promoter (AAV2-hSyn-eYFP) into the BF of CD-1 mice (Fig. 2a–c, top; Extended Data Figure 4a–c) targeted specifically to the more anterior septo-accumbal transition zone of the basal forebrain13 and observe a prominent axonal projection to the lHb (Fig. 2b, top).
Figure 2. GABAergic BF-lHb circuit is differentially activated by intruder interactions.
(a) Schematic of anterograde and retrograde tracing strategies. (b) Representative anterograde AAV2-hSyn-eYFP infections (top, terminals) or retrograde G-deleted-Rabies-eGFP infections (bottom, infection site) in lHb. Scale bars 500 μm, insets 150 μm. (c) Representative anterograde AAV2-hSyn-eYFP infections (top, infection site) or retrograde G-deleted-Rabies-eGFP infections (bottom, cell bodies) in the BF. Scale bars 400 μm, insets 200 μm. (d) Percent retrograde labeled eGFP+ neurons within subnuclei of the anterior BF (n = 3 mice, ~229 cells/mouse). (e) Representative in situ hybridization co-localized GAD67 and eGFP in DBN (left) and quantification (right) within the BF (n = 3 mice, 14 cells/mouse). Scale bars 20 μm. (f) Representative images of AAV2-hSyn-eYFP infection and c-Fos IR in medial NAc shell transition zone of the BF (top) and medial lHb terminals (bottom). Scale bars 30 μm. (g) Quantification of c-Fos IR in the medial NAc shell-septum transition zone (t8 = 2.655, *P < 0.05; two-tailed unpaired t-test, n = 6–8 mice/group, 3 slices/mouse) and medial lHb (t12 = 5.678, ***P < 0.001; two-tailed unpaired t-test, n = 6–8 mice/group, 3 slices/mouse). (h) Firing rate of lHb neurons in AGG and NON at 1-hr or 7 days post intruder interaction (F1,67 = 10.56, two-way ANOVA P < 0.05; post hoc test, **P < 0.01; n = 16–19 cells/group, 4–5 mice/group). (i) Representative traces of lHb in vitro cell-attached firing rates. (j) Representative traces of lHb in vitro cell-attached firing rates during ChR2BF→lHb photostimulation. (k) Average firing rates of lHb neurons during ChR2BF→lHb (t10 = 3.679, **P < 0.01; two-tailed unpaired t-test, n = 6 cells). (l) Representative traces of lHb in vitro cell-attached firing rates during NpHR3BF→lHb photostimulation. (m) Average firing rates of lHb neurons during NpHR3BF→lHb (t18 = 11.68, ***P < 0.0001; two-tailed unpaired t-test, n = 10 cells) photostimulation. Data represented as mean ± s.e.m. NON, non-aggressor; AGG, aggressor; lHb, lateral habenula; mHb, medial habenula; BF, basal forebrain; NAc, nucleus accumbens; DBN, diagonal band nuclei; DAPI, 4′,6-diamidino-2-phenylindole.
To further characterize BF-lHb projections, we injected the lHb (Fig. 2a–b, bottom) with a retrograde monosynaptic glycoprotein dead Rabies virus (G-deleted-Rabies-eGFP)14. Within the anterior BF that overlaps with our anterograde viral infection, we observed retrograde labeling in the septum (~45%), DBN (~35%) and the medial NAc shell (~15%) (Fig. 2c–d, bottom). Within retrogradely labeled BF slices, we performed in situ hybridization for GAD67, a marker of inhibitory GABAergic neurons, and observed co-localization within the septum (~75%), DBN (~80%) and medial NAc shell (100%) (Fig. 2e).
To identify whether BF and lHb neurons are differentially activated by intruder interactions in AGG and NON, we examined c-Fos immunoreactivity (IR) 1-hr following the final intruder screening. AGG exhibit elevated c-Fos IR in the septo-accumbal transition zone of the BF relative to NON (Fig. 2f–g). Within the eYFP positive BF terminal fields in the medial lHb, NON exhibit increased c-Fos IR nuclei relative to AGG (Fig. 2f–g). This finding was corroborated by slice electrophysiology, where NON exhibit an increase in lHb firing rates compared to AGG 1-hr after an intruder interaction that returns to baseline by 7-d following intruder interaction (Fig. 2h–i). Together, these data show that lHb neurons are differentially regulated by intruder interactions, possibly through inhibitory BF inputs.
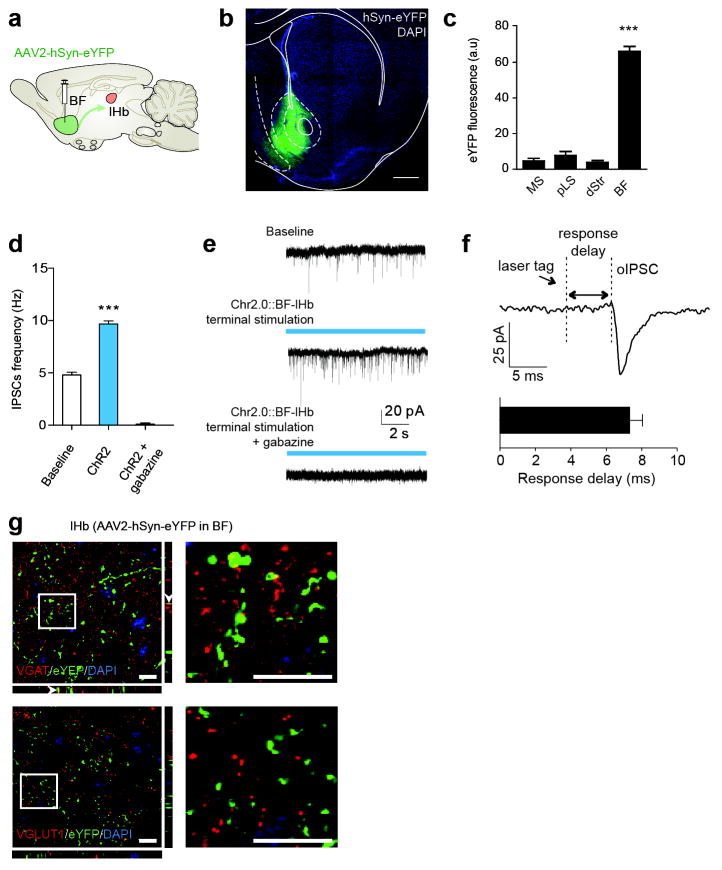
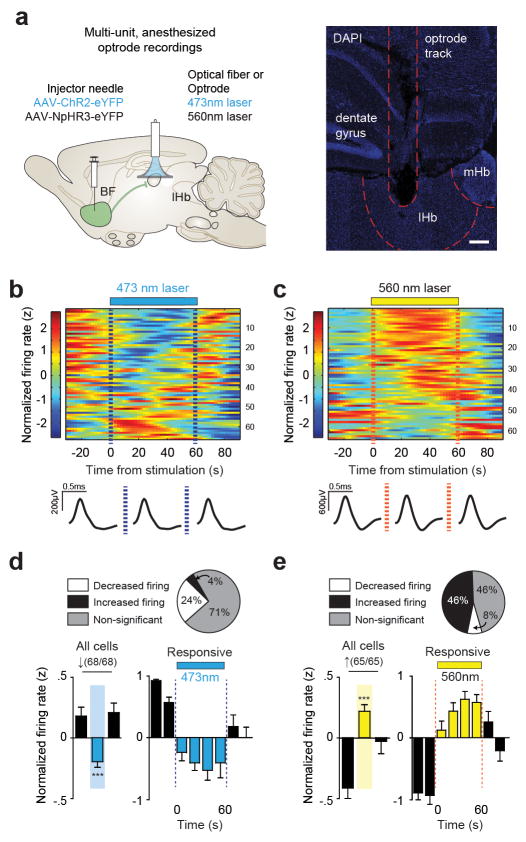
To determine the functional contribution of BF-lHb projections, we conducted optogenetic circuit-specific terminal photostimulation in combination with slice electrophysiology with channelrhodopsin (AAV2-hSyn-ChR2(H134R)-eYFP) or halorhodopsin (AAV2-hSyn-NpHR3.0-eYFP), identifying photostimulation parameters that produce robust transient lHb activation or inhibition without rebound neuronal firing. ChR2BF→lHb terminal photostimulation with 40 Hz resulted in significantly decreased lHb firing rates (Fig. 2j–k), while NpHR3BF→lHb (8-s on, 2-s off) terminal photostimulation resulted in a robust increase in postsynaptic lHb firing rates (Fig. 2l–m). Importantly, whole cell recordings from lHb neurons during ChR2BF→lHb terminal photostimulation showed a significant increase in inhibitory postsynaptic currents (IPSCs) that was completely blocked by the GABAA receptor antagonist, gabazine (Extended Data Figure 4d–e). Optically induced IPSCs exhibited a response delay of ~7 ms (Extended Data Figure 4f), which is in line with previously published response delays for ChR2 at monosynaptic circuits. Similarly, anterograde tracing of BF terminals in the lHb revealed that they were co-localized with vesicular GABA transporter (VGAT), but not vesicular glutamate transporter 1 (VGLUT1) (Extended Data Figure 4g). To validate these findings within an intact system, we utilized multi-electrode recording of postsynaptic lHb firing rates in anesthetized mice in combination with terminal photostimulation (Extended Data Figure 5a). Results show that activation (40 Hz ChR2BF→lHb), or inhibition (8-s on, 2-s off NpHR3BF→lHb) of presynaptic BF terminals in the lHb resulted in decreased or increased lHb postsynaptic neuronal firing, respectively (Extended Data Figure 5b–d). These functional in vitro and in vivo recordings of ChR2BF→lHb and NpHR3BF→lHb, confirm inhibitory GABAergic control over circuit activity and demonstrate reliable temporal control of lHb firing rates by optogenetic tools for in vivo behavioral analysis.
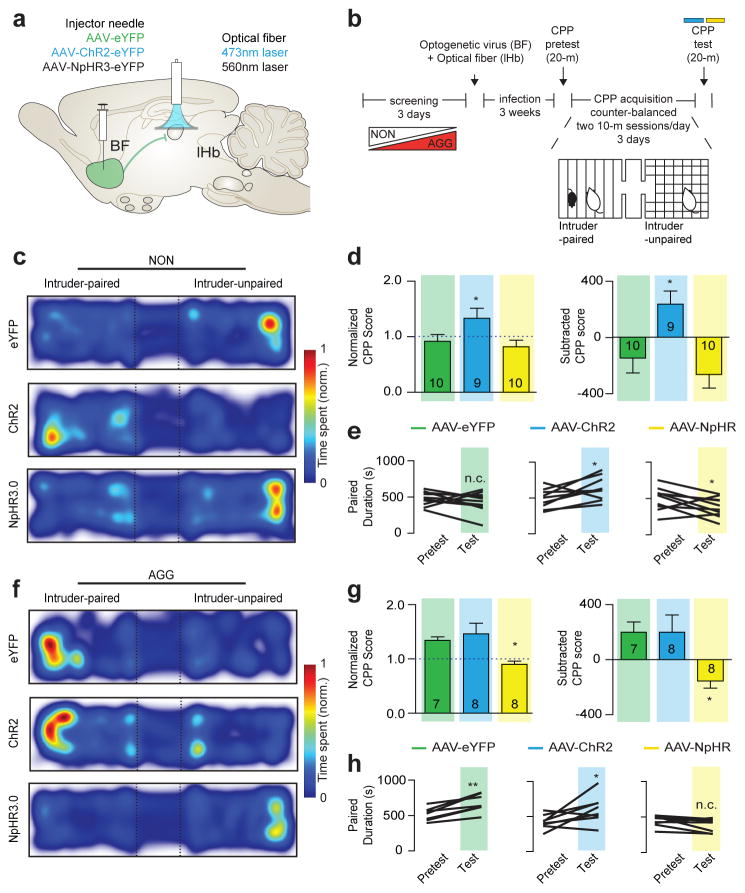
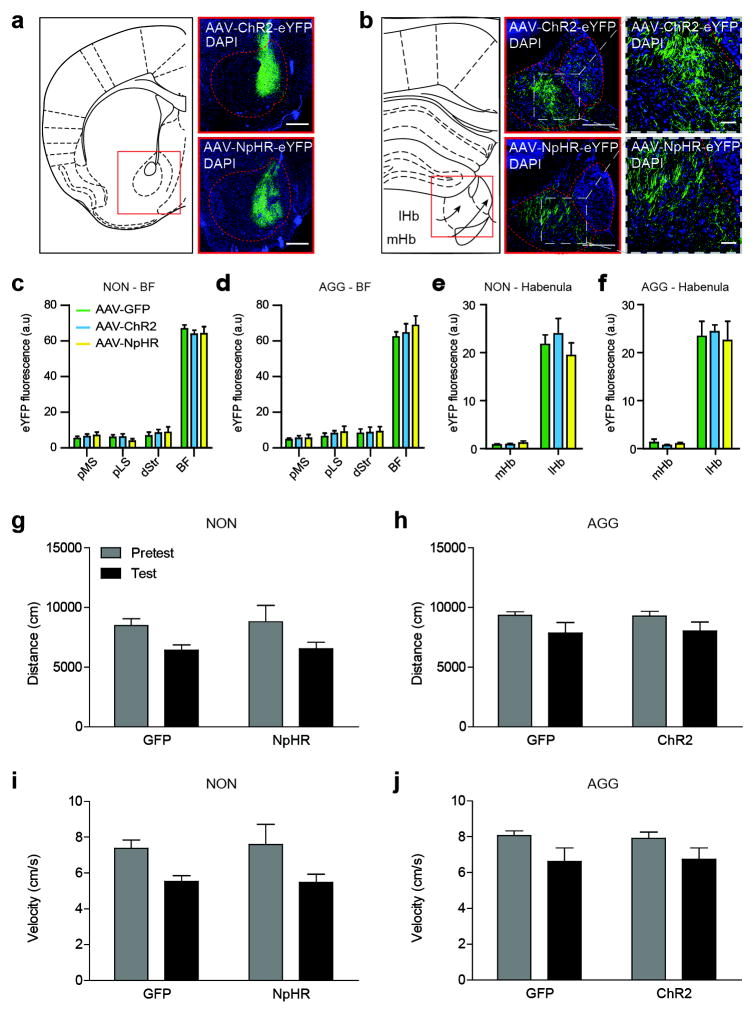
To investigate the functional consequences of BF-lHb neuronal firing on aggression reward, we paired photostimulation of ChR2BF→lHb and NpHR3BF→lHb in AGG and NON during the CPP test (Fig. 3a–b). NON::ChR2BF→lHb stimulation promoted CPP (Fig. 3c–e), mimicking responses observed in control AGG. Conversely, AGG::NpHR3BF→lHb stimulation induced CPA (Fig. 3f–h), mimicking responses observed in control NON. Neither NON::NpHR3BF→lHb or AGG::ChR2BF→lHb stimulation significantly affected the expression of CPP or CPA. Viral expression (Extended Data Figure 6a–f) and locomotor activity (Extended Data Figure 6g–j) was not different between conditions. These data confirm that BF-lHb circuitry modulates the rewarding component of aggressive behavior and is both necessary and sufficient for the expression of CPP in AGG and CPA in NON.
Figure 3. BF-lHb activity bi-directionally modulates aggression reward.
Schematic of (a) optogenetic viral infection strategy and (b) aggression CPP procedure. Representative CPP heatmaps for eYFPBF→lHb, ChR2BF→lHb and NpHR3BF→lHb between (c) NON and (f) AGG mice. (d) Normalized (F2,26 = 5.019, one-way ANOVA P < 0.05; post hoc test, *P < 0.05, n = 9–10/group) and subtracted CPP score (F2,26 = 6.666, one-way ANOVA P < 0.01; post hoc test, *P < 0.05, n = 9–10/group) in NON::eYFPBF→lHb, NON::ChR2BF→lHb and NON::NpHr3BF→lHb. (e) Individual duration in intruder-paired context for NON::eYFPBF→lHb mice (t9 = 0.9129, P > 0.05; two-tailed paired t-test, n = 10/group), NON::ChR2BF→lHb mice (t8 = 2.362, *P < 0.05; two-tailed paired t-test, n = 9/group), and NON::NpHRBF→lHb mice (t9 = 2.344, *P < 0.05; two-tailed paired t-test, n = 10/group) during the Pretest and Test sessions. (g) Normalized (F2,20 = 5.470, one-way ANOVA P < 0.05; post hoc test, *P < 0.05, n = 7–8/group) and subtracted CPP score (F2,20 = 4.964, one-way ANOVA P < 0.05; post hoc test, *P < 0.05, n = 7–8/group) for intruder-paired context in AGG::eYFPBF→lHb, AGG::ChR2BF→lHb and AGG::NpHr3BF→lHb. (h) Individual duration in intruder-paired context for AGG::eYFPBF→lHb mice (t6 = 5.070, **P < 0.01; two-tailed paired t-test, n = 7/group), AGG::ChR2BF→lHb mice (t7 = 2.394, *P < 0.05; two-tailed paired t-test, n = 8/group), and AGG::NpHRBF→lHb mice (t7 = 1.763, P > 0.05; two-tailed paired t-test, n = 8/group). Summary data are represented as mean ± s.e.m. NON, non-aggressor; AGG, aggressor; lHb, lateral habenula; BF, basal forebrain; n.c., no change.
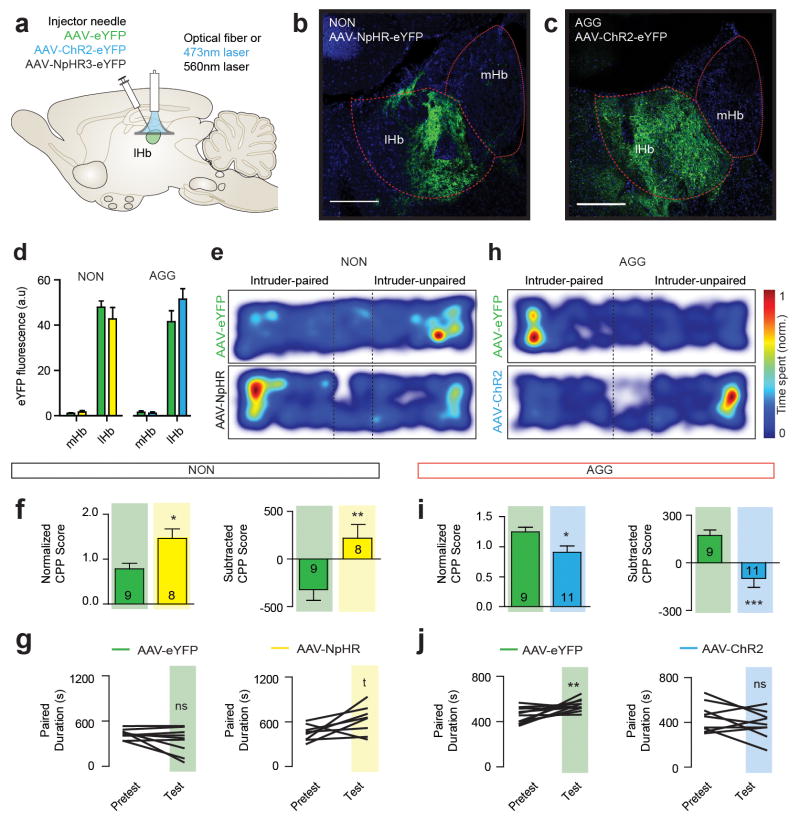
To determine if these circuit-specific effects could be recapitulated by direct lHb cell body manipulation, we injected the lHb with AAV2-hSyn-ChR2-eYFP or AAV-hSyn-NpHR3.0-eYFP (Extended Data Figure 7a–d) and directly stimulated lHb cell bodies using previously established optogenetic parameters for lHb15. NON::NpHR3.0lHb stimulation to decreases lHb firing promoted CPP to the intruder-paired side (Extended Data Figure 7e–g), whereas, AGG::ChR2lHb stimulation to increases lHb firing, induced CPA to the intruder-paired side (Extended Data Figure 7h–j). Taken together, these results implicate the lHb as a key modulator of aggression motivational state.
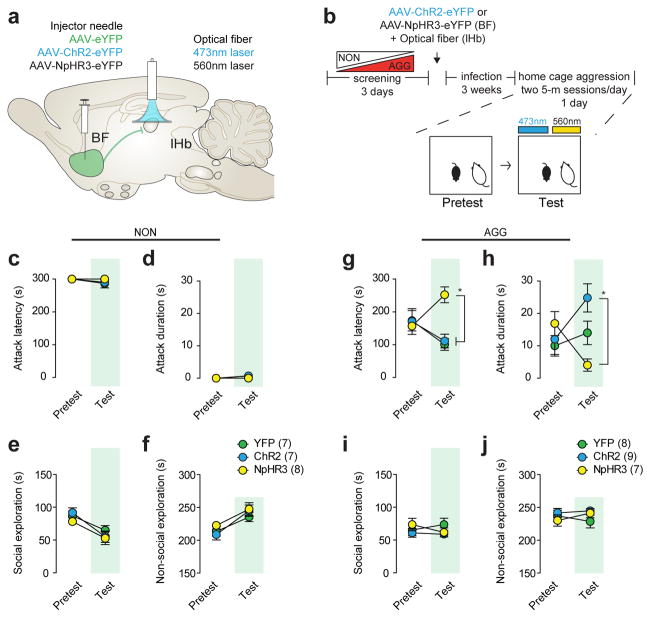
To determine if BF-lHb neuronal activity regulates the initiation or intensity of aggressive behavior, we utilized ChR2BF→lHb and NpHR3BF→lHb (Fig. 4a) in AGG and NON during home cage resident-intruder testing (Fig. 4b). Neither activation nor inhibition of BF-lHb terminals resulted in initiation of aggressive behavior (Fig. 4c–d), nor did it modulate social (Fig. 4e) and non-social (Fig. 4f) exploratory behaviors in NON mice. Similarly, AGG::ChR2BF→lHb stimulation failed to initiate immediate attack behavior, as indexed by no change in attack latency (Fig. 4g). However, AGG::ChR2BF→lHb and AGG::NpHR3BF→lHb stimulation bi-directionally modulated the severity of the aggressive behavior relative to each other, though a nonsignificant trend was observed when either were compared to AGG::GFPBF→lHb (Fig. 4h). As observed in NON, AGG::ChR2BF→lHb and AGG::NpHR3BF→lHb photostimulation failed to alter either social (Fig. 4i) or non-social (Fig. 4j) exploratory behaviors. These data indicate that the BF-lHb circuit is important in modulating the intensity of aggressive behavior; however, it is not a traditional attack initiation area.
Figure 4. BF-lHb does not initiate attack but modulates aggression severity.
(a) Schematic of optogenetic (a) viral infection strategy and (b) aggression procedure. NON (c) attack latency, (d) attack duration, (e) social exploration and (f) non-social exploration behaviors in pretest and test sessions (non-significant, n = 7–8/group). AGG (g) attack latency (F2,42 = 6.01, two-way ANOVA P <0.001, *P<0.05, n = 7–9/group), (h) attack duration (F2,42 = 5.666, two-way ANOVA P <0.001, *P<0.05, n = 7–9/group), (i) social exploration and (j) non-social exploration behaviors in pretest and test sessions. NON, non-aggressor; AGG, aggressor; lHb, lateral habenula; BF, basal forebrain.
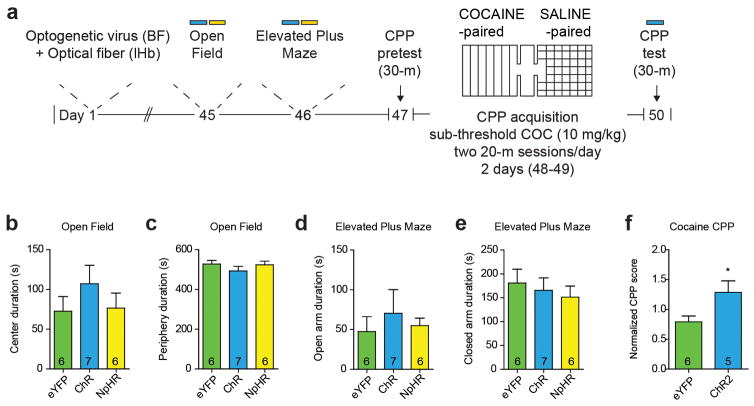
Based on this data, we hypothesized that the BF-lHb circuit acts in other affective behavioral domains. We performed a behavioral battery to measure non-social generalized anxiety states and reward in naive CD-1 mice (Extended Data Figure 8a). Both ChR2BF→lHb and NpHR3BF→lHb terminal photostimulation failed to modulate anxiety-like behaviors in the open field (Extended Data Figure 8b–c) and elevated plus maze tasks (Extended Data Figure 8d–e). However, ChR2BF→lHb stimulation potentiates the rewarding effects of cocaine by increasing the amount of time spent in the cocaine-paired chamber (Extended Data Figure 8f). Therefore, while the BF-lHb circuit does not influence a generalized anxiety phenotype in the absence of social context or other stimuli, it does generalize to non-social rewarding stimuli such as cocaine.
Our results show individual differences in the rewarding properties of aggressive social interaction that are mediated by the BF-lHb circuit. When exposed to an intruder, AGG exhibit increased activity of the BF and a concomitant reduction in lHb neuronal firing relative to NON, contributing to a behavioral preference for environmental contexts associated with the interaction. Importantly, this circuit is not sufficient to induce attack behavior. Although anatomical studies have identified this BF projection to the lHb in mice and rats16–18, and diffusion tensor imaging (DTI) suggests probabilistic tract connections between the BF and lHb in humans19, this is the first study to provide functional evidence that GABAergic BF projections produce inhibitory control of lHb neurons to regulate the valence of aggressive intruder-based interactions. Stimulation or inhibition of BF-lHb projections is both sufficient and necessary to alter the positive or negative valence of an intruder-paired context. Our findings advance the understanding of lHb function in a behaviorally relevant animal model of aggression motivation and provide further understanding into the physiology and neural circuitry of aggression and reward-related behaviors.
While numerous functions have been ascribed to lHb20 neuronal activity including anxiety21, addiction22, and depression23, there is a noticeable paucity of functional data addressing the role of lHb inputs, outside of those originating from the VTA region, within any of these behavioral domains. Indeed, anatomical tracing experiments have highlighted the complexity of lHb afferents24 and efferents25. With regard to the BF, the LS, DBN, and medial NAc shell, but not core, are known to send projections to the lHb24,26. Our current study implicates the septo-accumbal transition zone of BF as a critical source of GABAergic tone to the lHb within the context of motivated behavior. However, based on the fact that these BF GABAergic inputs to lHb exhibit high tonic activation in acute slice that can be rapidly inhibited by terminal inhibition with NpHR3 (Fig. 2l–m), it is unlikely that they are NAc medium spiny neurons. Lastly, based on both in vitro and in vivo electrophysiological studies, as well as anatomical tracing, we note that there may be a small subset of cells in the BF that either release an excitatory neurotransmitter or act indirectly on the lHb via di-synaptic inputs. It will be interesting in the future to determine what role these neurons play in reward processing.
Our results may provide important information to clinical studies identifying novel targets of deep brain stimulation (DBS) in the treatment of neuropsychiatric conditions that present with aggression co-morbidity such as substance abuse27 and depression28. DBS protocols within specific BF nuclei29 and lHb30 have been successfully used to treat intractable major depressive disorder (MDD), which is associated with symptoms of increased aggression in men28. Overall, our findings demonstrate a previously unidentified functional role for the lHb and its inputs from the BF in mediating the rewarding component of aggression, and suggest that targeting shared underlying deficits in motivational circuitry may provide useful information for the development of novel therapeutic strategies for treating aggression-related neuropsychiatric disorders.
Online/Supplemental Methods
Animals
Male CD-1 (ICR) mice (35–45 g, sexually experienced retired breeders; Charles River Laboratories) were obtained at 4 months of age. All breeders were confirmed by CRL to have had equal access, experience and success as breeders. Male C57BL/6J mice (20–30 g; The Jackson Laboratory) were obtained at 7–8 weeks of age and used as novel intruders. All mice were allowed 1 week of acclimation to the housing facilities before the start of experiments. CD-1 mice were single housed, and C57BL/6J mice were group housed. All mice were maintained on a 12-h light:dark cycle with ad libitum access to food and water. Procedures were performed in accordance with the NIH Guide for Care and Use of Laboratory Animals and the Icahn School of Medicine at Mount Sinai Institutional Animal Care and Use Committee.
Aggression screening and ethological analysis
Aggression screening was performed as previously described10. Following a minimum of 1 week habituation to home cages, experimental CD-1 mice were exposed to a novel C57BL/6J intruder for 3 minutes daily over 3 consecutive days. Each intruder presentation was performed in the home-cage of the CD-1 between 1–3 PM daily under white light conditions. During screening sessions the cage top along with feeding and water apparatus were replaced with a clear Plexiglass cover to allow unimpeded viewing and video-recording of screening sessions. The duration and number of screening sessions were selected to prevent induction of stress and anxiety-related behaviors in CD-1 mice (Extended Data Table 1, Extended Data Table 2), which has been shown to occur during extended antagonist encounters31. This allows for separation between aggression and stress-related states. All screening sessions were video recorded for later ethological analysis using a digital color video camera. Ethological analysis of aggression behavior was performed by 2 blinded observers, recording (i) latency to initial aggression, (ii) the number of aggressive bouts, (iii) the total duration of aggression, and (iv) the mean duration of aggressive bouts. Operational definitions for the above behaviors are defined as follows: Initiation of aggression is defined by the first clear physical antagonist interaction initiated by the CD-1, not including grooming or pursuit behavior. Aggressive bouts are defined by cycles of initiated aggression with continuous orientation by the CD-1 towards the intruder, and only defined as completed when the CD-1 has physically re-oriented away from the intruder. This definition allows for slight breaks (less than 5-s) in continuous physical interaction within an aggressive bout, assuming the CD-1 has remained oriented towards the intruder throughout. CD-1 mice were defined as AGG if they initiated aggression during any of the 3 screening sessions and NON were defined as those that showed no aggression during any screening sessions. All aggression screening was halted if an intruder showed any signs of injury in accordance with our previously published protocol10.
Aggression conditioned place preference (CPP) and behavioral analysis
The aggression CPP protocol, developed based on a previously published cocaine CPP protocol32, consisted of three phases: pre-test, acquisition, and test. Mice were acclimated to the testing facility for 1 hour prior to testing. All phases were conducted under red light and sound-attenuated conditions. The CPP apparatus (Med Associates) consisted of two unique conditioning chambers with a neutral middle zone that allowed for unbiased entry into either conditioning chamber at the initiation of each trial. All CPP sessions were video recorded using Noldus Ethovision 3.0 (Noldus Information Technology). During the pre-test phase, mice were placed into the middle chamber of the conditioning apparatus and allowed to freely explore the full extent of the CPP apparatus for 20 minutes. There were no group differences in bias for either chamber and conditioning groups were balanced in an unbiased fashion to account for start side preference. The acquisition phase consisted of 3 successive days with two conditioning trials each day for a total of 6 acquisition trials. Morning trials (between 8:00AM and 10:00AM) and afternoon trials (between 3:00PM and 5:00PM) consisted of CD-1 mice confined to one chamber for 10 minutes while in the presence or absence of a novel C57BL/6J intruder. All groups were counterbalanced for conditioning chamber. A total of 3 conditioning trials to the intruder-paired and intruder-unpaired context where performed. On the test day, CD-1 mice were placed into the middle arena of the CPP apparatus without an intruder and allowed to freely explore both chambers for 20 minutes. Analysis of duration spent within either context was used to identify a CPP or CPA to the intruder-paired context. For optogenetic experiments, stimulation was performed during the full duration of the test phase. Total locomotor responses were also assessed to ensure equal exploratory behavior between groups. Behavioral analysis of aggression CPP data was performed by assessing (i) normalized CPP (test phase duration spent in the intruder-paired chamber divided by the pre-test duration spent in the intruder-paired chamber, accounting for behavior during both sessions), (ii) subtracted CPP (test phase duration spent in the intruder-paired chamber minus test phase duration spent in the intruder-unpaired chamber, accounting for test session behavior only), and lastly (iii) group and individual durations in both pre-test and test sessions.
Sensory CPP
Sensory CPP was performed and analyzed identically to the aggression CPP procedure, with the exception that the intruder C57BL6/J was placed within a physical barrier to provide only sensory contact with the resident CD-1 mice.
Cocaine CPP
A previously published cocaine CPP protocol32 was used, which consisted of three phases: pre-test, acquisition, and test. Mice were acclimated to the testing facility for 1 hour prior to testing. All phases were conducted under red light and sound-attenuated conditions. The CPP apparatus (Med Associates) consisted of two unique conditioning chambers with a neutral middle zone that allowed for unbiased entry into either conditioning chamber at the initiation of each trial. All CPP sessions were video recorded using Noldus Ethovision 3.0 (Noldus Information Technology). During the pre-test phase, mice were placed into the middle chamber of the conditioning apparatus and allowed to freely explore the full extent of the CPP apparatus for 30 minutes. There were no group differences in bias for either chamber and conditioning groups were balanced in an unbiased fashion to account for start side preference. The acquisition phase consisted of 2 successive days with two conditioning trials each day for a total of 4 acquisition trials. Morning trials (between 8:00AM and 10:00AM) and afternoon trials (between 3:00PM and 5:00PM) consisted of CD-1 mice confined to one chamber for 20 minutes paired with an intraperitoneal injection of cocaine (10 mg/kg); afternoon sessions were paired with saline injections. All groups were counterbalanced for conditioning chamber. On the test day, CD-1 mice were placed into the middle arena of the CPP apparatus and allowed to freely explore both chambers for 30 minutes. Analysis of duration spent within either context was used to identify a CPP or CPA to the cocaine-paired context. For optogenetic experiments, stimulation was performed during the full duration of the test phase. Total locomotor responses were also assessed to ensure equal exploratory behavior between groups.
Sucrose preference
Sucrose preference was performed as previously described33. 1 week after the final screening session, AGG and NON mice had their standard water bottle removed and replaced with two 50-ml conical tubes with sipper tops filled with water. After a 24-h habituation period, water from one 50-ml conical tube was replaced with 1% sucrose. All tubes were weighed, and mice were allowed 24 h to drink. Tubes were then reweighed, and their locations in the wire tops were switched before a second 24-h period of drinking. At the end of the second day of sucrose testing, preference was calculated as the total amount of sucrose consumption divided by the total amount of fluid consumed over the 2 d of sucrose availability.
Elevated plus maze
Elevated plus maze was performed as previously described34. 1 week after the final screening session AGG and NON mice were acclimated to the testing facility for 1 hour prior to testing and then placed in the elevated plus maze under red light conditions for 5 minutes. Each arm of the maze measured 12 × 50 cm. The Plexiglas cross-shaped maze consisted of two open arms with no walls and two closed arms (40 cm high walls) and was on a pedestal 1 m above floor level. Behavior was tracked using an automated system (Noldus Ethovision; Noldus Interactive technologies). Behavior was measured as total time in open and closed arms.
Open field and locomotor measures
Open field was performed as previously described34. 1 week after the final screening session, AGG and NON mice were acclimated to the testing facility for 1 hour prior to testing. Open-field testing was performed in black Plexiglass arenas (42 × 42 × 42 cm; Nationwide Plastics) under red light conditions. Testing sessions were 10 minutes long. Behavior was tracked using an automated system (Noldus Ethovision; Noldus Interactive technologies) to record the total distance moved and time spent in the total arena and a delineated “center zone” (24cm × 24cm).
Forced-swim test
Forced-swim test was performed as previously described34. 1 week after the final screening session, AGG and NON mice were placed in the test room for an hour before behavioral testing for habituation. Mice were tested in a 4L Pyrex glass beaker, containing 2L of water at 25±1°C for 6 minutes. Behavior was videotaped (Noldus Ethovision; Noldus Interactive technologies) and analyzed for duration immobile, duration mobile and total movement.
Social interaction (approach)
Social approach testing was performed as previously described10. 1 week after the final screening session, AGG and NON mice were acclimated to the testing facility for 1 hour prior to testing, and all testing was performed under red light conditions. Mice were placed in an open field black Plexiglas arena (42 × 42 × 42 cm; Nationwide Plastics) with a small animal cage placed at one end. Their movements were then automatically monitored and recorded (Ethovision 3.0; Noldus Information Technology) for 2.5 minutes in the absence (target absent phase) of a social target. This phase is used to determine baseline exploratory behavior. We then immediately measure 2.5 minutes of exploratory behavior in the presence of a caged novel CD–1 or C57BL/6J mouse (target present phase), again recording total distance travelled and duration of time spent in the interaction and corner zones. Social interaction behavior is determined by the total time spent in each zone.
Novel object versus social target preference
The novel object vs. social target test consisted of two phases: pre-test and test on consecutive days as previously described35. 1 week after the final screening session, AGG and NON mice were acclimated to the testing facility for 1 hour prior to both sessions. All phases were run under red-light and sound-attenuated conditions. The testing apparatus (Med Associates) consisted of two identical chambers, with a neutral middle zone that allowed for unbiased entry into either chamber at the initiation of each trial. All sessions were video recorded from above (Noldus Ethovision 3.0, Noldus Information Technology) for later behavioral analysis. Briefly, during the pre-test phase, mice were placed into the middle chamber of the apparatus and allowed to freely explore all zones for 5 minutes. There were no group differences in pretest preference for either chamber. Conditioning groups were then balanced in an unbiased way to account for individual animals’ preference. On the test day, mice were placed back into the apparatus in the presence of both a novel object (an upside-down steel-bar pencil holder) on one side and a social target (identical pencil holder containing either a novel CD-1 or a C57BL/6J mouse) on the other. Test mice were allowed to freely explore the apparatus for 5 minutes. The time spent in each chamber was recorded and used for analysis. The subtracted social score is derived by subtracting time in social-paired chamber from time in novel object-paired chamber during the test phase. Normalized social score is the ratio of time spent in the chamber of interest (social target or novel object) during the test phase over the pretest phase.
Blood sampling and testosterone/corticosterone ELISA
Submandibular vein bleeds were taken from mice 4–24 hours following the final screening session as previously described36. Serum testosterone (RND Systems, Testosterone Parameter Assay Kit) and corticosterone (Immunodiagnostic Systems, IDS Corticosterone EIA Kit) levels were assessed via ELISA according to manufacture specifications. Briefly, blood was collected in a serum separator tube, allowed to clot for 30 minutes at room temperature, and centrifuged at 1000xg for 15 min and stored frozen (−20° C) until analysis. The sensitivity of the testosterone assay (minimum detectable dose ranging from 0.012–0.041 ng/ml) falls well below the ranges detected experimentally within our cohort (lowest serum testosterone concentration of 2.58 ng/ml).
Perfusion and brain tissue processing
For IHC and histology, mice were given a euthanizing dose of 15% chloral hydrate and transcardially perfused with cold 1% paraformaldehyde in phosphate buffered saline (PBS; pH 7.4) followed by fixation with cold 4% paraformaldehyde in PBS. Brains were dissected and post-fixed for 18 h in the same fixative. Coronal sections were prepared on a vibratome (Leica) at 50 μm to assess viral placement and immunohistochemistry. For in situ hybridization, mice brains were rapidly removed and flash frozen in −30°C isopentane for 60 seconds and then kept at −80°C until sectioning.
Immunohistochemistry, in situ hybridization and confocal microscopy
For c-fos experiments, sections were incubated overnight in blocking solution (3% normal donkey serum, 0.3% Triton X-100 in PBS), washed in PBS for 2 hours, then incubated for 48 hrs in primary antibody [Rabbit anti-c-Fos (Santa Cruz Biotechnology, SC-42) 1:2,000]. Slices were then washed in PBS for 2 hrs, incubated in secondary for 2 hrs [Donkey anti-rabbit Cy2 1:200 (Jackson ImmunoResearch)], then washed in PBS for 30 min before staining with 1 μg/ml DAPI (Sigma) for 20 minutes. Sections were then mounted, air-dried overnight and cover-slipped with hardset Vectashield (Jackson ImmunoResearch). All slices were images using a Zeiss LSM 780. For c-Fos analysis, all images were taken at 20x magnification for both the BF and lHb, using the tile-scan function to span the entire region of interest. Analysis of c-Fos positive nuclei was performed using NIH ImageJ in conjunction with the “analyze particle” function on single images. For representative images demonstrating the areas of viral infection, images were acquired at 10x magnification using the tile-scan function.
For all other IHC, coronal sections (50 μm) were used for all immunofluorescence experiments. Sections were incubated in blocking solution (3% normal donkey serum, 0.3% Triton X-100 in PBS) for 1 hour. Sections were then incubated in primary antibody overnight at 4°C [VGAT 1:500 (Synaptic Systems); VGLUT1 (Millipore) 1:5,000; 1:250; GFP (Aves) 1:1,000]. Next sections were washed in PBS for 60 min and then incubated in secondary antibody for 2 hours [Donkey anti-guinea pig Cy5 1:400; Donkey anti-goat Cy5 1:400; Donkey anti-chicken Cy2 1:400 (Jackson ImmunoResearch)], then washed with PBS for 60 min, stained with 1 μg/ml DAPI (Sigma) for 20 minutes, mounted and air-dried overnight. Slides were quickly washed in ethanol 70%, 95%, 100% and Citrosolv (Fisher), and cover-slipped with DPX mounting medium (Electron Microscopy Sciences). All slices were images using a Zeiss LSM 780. For puncta imaging, 1-um z-stacks were taken at 100x magnification for both the BF and lHb. Deconvolution was performed on all z-stacks with AutoQuant X (MediaCybernetics). For representative image demonstrating the area of viral infection, images were acquired at 100x magnification using the tile-scan function.
For in situ hybridization, RNAScope Multiplex Flourescent Kits (Advanced Cell Diagnostics) were used with the company provided procedure. Briefly, fresh frozen brains were slide mounted at 16 μm thickness, fixed for 15 minutes in cold 4% PFA, serially dehydrated with increasing ETOH concentration washes (50%, 75% 100% EtOH for 2 minutes each), and pre-treated with protease reagent (Protease IV, RNAscope) for 20 minutes. Proprietary probes (Advanced Cell Diagnostics) for eGFP (Channel 1) or GAD67 (Channel 2) were hybridized at 40°C for 2 hours, and then subjected to a series of amplification steps at 40°C (1-FL: 30 minutes; 2-FL: 15 minutes; 3-FL: 30 minutes, 4-FL: 15 minutes). For the 4th amplification step, Reagent Alt-A was used, corresponding with Channel 1 visualization at 488nm and Channel 2 at 550nm. Lastly slides were treated for 2 minutes with DAPI, an immediately cover-slipped with EcoMount.
In vitro electrophysiology
All recordings were performed blind to experimental condition, and performed in both NON and AGG CD-1 mice. For optogenetic slice electrophysiology, mice were anesthetized with isoflurane, and perfused with cold artificial cerebrospinal fluid (aCSF) composed of (in mM): 128 NaCl, 3 KCl, 1.25 NaH2PO4, 10 D-glucose, 24 NaHCO3, 2 CaCl2, and 2 MgCl2 (oxygenated with 95% O2 and 5% CO2, pH 7.35, 295–305 mOsm) as described in our previous work37,38. Briefly, acute brain slices containing the lHb were cut using a microslicer (DTK-1000, Ted Pella) in 95% O2 and 5% CO2 saturated sucrose-aCSF, which was derived by fully replacing NaCl with 254 mM sucrose. Slices were maintained in the holding chamber containing aCSF for 1 h at 37°C. Slices were then transferred into a recording chamber fitted with a constant flow rate of aCSF equilibrated with 95%/5% O2/CO2 (2.5 ml/min) maintained at 35 °C. Cell-attached recording mode was used to measure the firing rates of lHb neurons. In these recording experiments, glass recording pipettes (7–10 MΩ) were filled with an internal solution composed of (in mM): 115 potassium gluconate, 20 KCl, 1.5 MgCl2, 10 phosphocreatine, 10 HEPES, 2 magnesium ATP, and 0.5 GTP (pH 7.2, 285 mOsm). For the experiments to measure inhibitory postsynaptic currents, whole-cell recordings were performed under voltage-clamp mode (holding at −70 mV) in presence of kynurenic acid (1 mM) with or without gabazine (2 μM) in aCSF. Glass recording pipettes (3–4 MΩ) for these whole-cell studies were filled with the internal solution composed of (mM): 120 CsCl, 10 phosphocreatine-Na, 10 HEPES, 10 EGTA, 2 ATP-Mg, 0.3 GTP-Tris (pH 7.2, 285 mOsm). Data acquisition was conducted using a Digidata 1440A digitizer and pClamp 10.2 (Axon Instruments).
Stereotaxic surgery and viral gene transfer
All surgeries were performed under aseptic conditions using anesthetic. Briefly, mice were anesthetized with a mixture of ketamine (100 mg per kg body weight) and xylazine (10 mg per kg body weight) and positioned in a small-animal stereotaxic instrument (David Kopf Instruments) and the skull surface was exposed. Thirty-three–gauge syringe needles (Hamilton Co.) were used to bilaterally infuse either 0.5 μl (BF) or 0.4 μl (lHb) of virus over a 5 minute period and the needle removed after 5 minutes. NAc shell/septum transition zone BF stereotaxic coordinates taken from bregma (anteroposterior +1.5 mm; mediolateral, +1.6 mm; dorsoventral, −4.4 mm; angle 10°). lHb stereotaxic coordinates taken from bregma (anteroposterior, −1.7 mm; mediolateral, +0.4 mm; dorsoventral, −2.5 mm; angle 0°). For lHb optogenetic experiments, animals were implanted with an optical fiber at the same time as viral injection (dorsoventral, −2.0 mm). For secure fixture of the implantable fiber to the skull, the skull was dried and then industrial-strength dental cement (Grip cement; Dentsply) was added between the base of the implantable fiber and the skull. For non-conditional axonal tract tracing, 0.5 μl AAV2-hSyn-eYFP (1.5 × 10^11–13 infectious units/ml, UNC Vector Core) was injected bilaterally into the BF. For retrograde tracing, 0.4ul μl G-deleted-Rabies-eGFP (1.33x 10^8 infectious units/ml, Salk Gene Transfer Targeting and Therapeutics Core) was injected into the lHb. For behavioral optogenetic experiments, 0.5 μl of non-conditional AAV2-hSyn-eYFP, AAV2-hSyn-hChR2(H134R)-eYFP or AAV-hSyn-eNpHR3.0-eYFP (1.5 × 10^11–13 infectious units/ml, UNC Vector Core) were injected into the BF (terminal stimulation) or lHb (cell body stimulation). All non-rabies AAV injections were performed between 4–6 weeks prior to tracing or behavioral experiments; rabies infected brains were collected 7 days after injection.
Blue light stimulation
Optical fibers (Thor Labs, BFL37-200) were connected using an FC/PC adaptor to a 473-nm blue laser diode (Crystal Laser, BCL-473-050-M) and a stimulator (Agilent Technologies, no. 33220A) was used to generate blue light pulses. For all in vivo behavioral experiments and optrode recordings, mice were given 40 Hz 5 ms light stimulations. Intensity of light delivered to ferrule was ~10 mW. These parameters are consistent with previously validated and published protocols for NAc MSNs39,40 and lHb neurons15,41.
Yellow light stimulation
Optical fibers (Thor Labs, SFS200/220Y) were connected using an FC/PC adaptor to a 561-nm yellow laser diode (Crystal Laser, CL561-050-L), and a stimulator (Agilent Technologies, no. 33220A) was used to generate yellow light pulses. For in vivo optrode recordings we tested a protocol of 8 s of yellow light on followed by 2 s of light off. Intensity of light delivered to ferrule was ~10 mW. These parameters are consistent with previously validated and published protocols for NAc MSNs and lHb neurons42,43.
In vivo recordings
Optrode construction and implantation
An optrode was constructed by gluing four tetrodes to an optical fiber. Four tetrodes spun of 12.7 μm diameter nichrome wire (California Fine Wire) were glued to a 200 μm diameter optical fiber (Thor Labs, SFS200/220Y) and cut so that they extended between 750 and 250 μm beyond the end of the fiber. The tetrodes were pinned into an electrode interface board (EIB; Neuralynx) and the tips were plated by passing 0.2 μA current pulses through the individual wires and a gold solution until the impedance reached 150–200 kOhm. The optrode was mounted on a stereotax arm (Kopf Instruments) and then lowered into the brain during surgery. Two small holes were drilled anterior and posterior to the recording site to serve as sites for ground screws. The ground screws were constructed by soldering stainless steel self-tapping screws to 3 mm stainless steel wire secured to the EIB. Screws were inserted far enough to come in contact with dura.
Recording
Recordings were carried out using a Digital Lynx 16SX recording system and Cheetah data acquisition software (Neuralynx). Signals from the tetrodes were bandpass filtered between 600 and 9000 Hz and digitized at 32 kHz. Spike detection was performed in real time using a thresholding procedure: when the filtered signal reached threshold amplitude on any wire, a sweep including 8 data points before the crossing and 24 points after (32 points, or 1 ms) were saved as a putative spike event. Spike sorting and noise filtering was performed offline. The laser intensity was adjusted to ~5 mW at the tip of the optrode prior to implantation. The optrode was lowered using the stereotax arm until the tetrode tips reached the dorsal extent of the lHb. Once the tissue and recordings stabilized, the optrode was slowly advanced until spikes were observed on at least one of the tetrodes. Spike amplitude and firing rate were allowed to stabilize and observed for several minutes prior to recording. For all trials a 30 second baseline recording was acquired, followed by 1 minute of stimulation and ending with a 30 second post-stimulation baseline. The optrode was then stepped forward and this procedure repeated until the inferior extent of the lHb was reached.
Analysis
Data were analyzed using custom scripts written in Matlab (MathWorks). A first round of preliminary spike sorting was carried out using spike waveforms as parameters in KlustaKwik44. The output from KlustaKwik was then imported into Matlab and clusters were manually edited using custom spike sorting software. Clearly separated clusters of spikes were assigned to functional units and entered into further analysis; noise spikes (e.g. from spurious threshold crossings) and units that fired fewer than 100 spikes during recording were discarded. Spike rates were calculated in 2-second non-overlapping bins across the baseline and stimulation epochs. The resulting functions were smoothed using a Gaussian window with a standard deviation of 10 seconds. The rate function for each unit was then z-scored across all three epochs. For statistical analyses, rates were calculated in either 15 second bins or bins encompassing the entire baseline and stimulation periods. No smoothing was applied. The rate functions for each unit were z-scored across all three epochs and the z-scored rate functions were used to assess statistical significance.
Statistical analysis
All t-tests, one-way ANOVAs, two-way ANOVAs and chi-square tests were performed using Graph Pad Prism software (Graphpad software Inc, CA). Bonferroni was used as a post-hoc when appropriate for one-way and two-way ANOVAs. Normality was determined by D’Agostino-Pearson, Shapiro-Wilk and Kolmogorov-Smirnov normality tests. Statistical significance was set a p < 0.05.
Extended Data
Extended Data Figure 1. Social behaviors exhibited by resident CD-1 and intruder C57 mice during aggression screening.
(a) Experimental schematic of aggression screening procedure used in a subset (40 residents and 40 intruders) of mice to quantify social behaviors. Bouts of (b) attacks (F2,156 = 13.10, two-way ANOVA ***P < 0.0001; post hoc test ***P < 0.001; n = 40/group), (c) pursuits, (d) withdrawals (F2,156 = 5.745, two-way repeated measures ANOVA **P < 0.001; post hoc test ***P < 0.001; n = 40/group) and (e) non-aggressive social approaches. Duration of (f) attacks (F2,156 = 7.069, two-way repeated measures ANOVA **P < 0.001; post hoc test ***P < 0.001; n = 40/group), (g) pursuits, (h) withdrawals and (e) non-aggressive social approaches. All data are presented as mean ± SEM.
Extended Data Figure 2. Detailed ethological analysis of AGG aggression-related behaviors.
(a) Experimental schematic of aggression screening procedure used in a sample (448 mice total; 138 NON and 310 AGG) of mice. (b) Histogram of attack latency frequency using 10-s bins. Mean distribution across screening sessions (left) and individual screening sessions (right) for (c) latency to aggression (F2,1338 = 49.37, two-way repeated measures ANOVA P < 0.001; post hoc test, *P < 0.001; n = 138–310), (d) number of attack bouts (F2,1338 = 21.03, two-way repeated measures ANOVA P < 0.001; post hoc test, *P < 0.001; n = 138–310) and (e) mean attack duration (F2,1338 = 11.96, two-way repeated measures ANOVA P < 0.001; post hoc test, *P < 0.001; n = 138–310). Correlation of mean latency to initial aggression with (f) mean attack bouts (r = −0.78, P < 0.0001) and (g) mean duration of attack bouts (r = −0.40, P < 0.0001). Distribution plots are presented as the median with interquartile range and normality determined by D’Agostino-Pearson, Shapiro-Wilk and Kolmogorov-Smirnov normality tests (P < 0.0001). Summary data are represented as mean ± s.e.m.
Extended Data Figure 3. Aggression CPP behavior.
(a) Experimental schematic of aggression CPP procedure. Individual duration spent in the intruder-paired context for (b) AGG (t7 = 3.106, *P < 0.05; two-tailed paired t-test, n = 8/group) and (c) NON (t7 = 2.918, *P < 0.05; two-tailed paired t-test, n = 8/group). (d) Duration spent in the middle neutral chamber during pretest and test sessions. (e) Experimental schematic of sensory CPP procedure. Individual duration spent in the intruder-paired context for (f) AGG and (g) NON. (h) Duration spent in the middle neutral chamber during pretest and test sessions. Summary data are represented as mean ± s.e.m.
Extended Data Figure 4. BF-lHb circuit tracing and GABAergic cell-type specificity.
(a) Schematic of viral tracing strategy. Representative BF viral infection with (b) AAV2-hSyn-eYFP, scale bar 500 μm. Histological analysis of viral infection with (c) AAV2-hSyn-eYFP (F3,11 = 223.0, one-way ANOVA ***P < 0.0001, post hoc test, ***P < 0.0001; n = 3 mice, 3 slices/mouse) across adjacent anatomical regions. (d) Whole-cell electrophysiological recordings and (e) representative traces of lHb neurons photostimulated with AAV2-hSyn-ChR2.0 in the absence or presence of bath applied GABAA receptor antagonist gabazine (4 μm; F2,7 = 220, one-way ANOVA P < 0.05; post hoc test, ***P < 0.001, n =4,2,2 cells from 2 mice). (f) Optically evoked IPSC response delay (n= 21 oIPSC events, 2 mice). (g) Representative images of eYFPBF→lHb terminal co-localization between vesicular GABA transporter (top), and not vesicular glutamate transporter 1 (bottom). Scale bar is 10 μm in all panels; white arrows indicate colocalization within insets. VGAT, vesicular GABA transporter; VGLUT, vesicular glutamate transporter 1; DAPI, 4′,6-diamidino-2-phenylindole; BF, basal forebrain; lHb, lateral habenula; pLS, posterior lateral septum; MS, medial septum. Summary data are represented as mean ± s.e.m.
Extended Data Figure 5. Multiunit anesthetized optrode recordings.
(a) Schematic of in vivo anesthetized multi-unit optrode recording procedure (left) and representative optrode placement in lHb (right; scale bar = 200 μm). Heatmaps of normalized firing rates for lHb neurons in response to BF terminal stimulation with (b) ChR2BF→lHb or (c) NpHR3BF→lHb and averaged spike wave-form shown below for pre-stimulation, stimulation and post-stimulation epochs. (e) Percent of cells by firing response (top) and average normalized lHb firing rate (bottom) after BF-lHb terminal stimulation with ChR2BF→lHb for all identified cells (F2,134 = 8.249, one-way repeated-measure ANOVA P < 0.001; post hoc test, *P < 0.05; n = 68 cells from 3 mice) and cells that significantly decreased firing during the stimulation epoch (F7,105 = 8.868, one-way repeated-measure ANOVA P < 0.0001; post hoc test, *P < 0.05; n = 16/68 cells from 3 mice). (f) Percent of cells by firing response (top) and average normalized lHb firing rate (bottom) after BF-lHb terminal stimulation with NpHR3BF→lHb for all identified cells (F2,128 = 10.32, one-way repeated-measure ANOVA P < 0.0001; post hoc test, *P < 0.05; n = 65/65 cells from 3 mice) and cells that significantly increased firing during the stimulation epoch (F7,203 = 17.58, one-way repeated-measure ANOVA P < 0.0001; post hoc test, *P < 0.05; n = 30/65 cells from 3 mice). BF, basal forebrain; lHb, lateral habenula; mHb, medial habenula; DAPI, 4′,6-diamidino-2-phenylindole. Summary data are represented as mean ± s.e.m.
Extended Data Figure 6. BF-lHb AAV infection and CPP locomotor behavior.
(a) Schematic of BF coronal slice (left), alongside representative AAV-ChR2-eYFP (top) and AAV-NpHR3.0-eYFP (bottom) infections. Scale bar 500 μm. (b) Schematic of lHb coronal slice (left), alongside representative images of BF terminal infection by AAV-ChR2-eYFP (middle top) and AAV-NpHR3.0-eYFP (middle bottom) within the lHb, scale bar 200 μm. Representative close-ups of terminal regions shown in insets on right, scale bar 50 μm. All representative images counterstained with DAPI. Histological analysis of BF infection in (c) NON and (d) AGG mice. Histological analysis of habenular viral infection in (e) NON and (f) AGG mice. (g,h) Total distance travelled and (I,j) mean velocity between NON and AGG during the CPP pretest and test phase. All data are presented as mean ± SEM, and are not significant as determined by two-way ANOVA, P<0.05. NON, non-aggressor; AGG, aggressor; lHb, lateral habenula; mHb, medial habenula; BF, basal forebrain; dStr, dorsal striatum; pLS, posterior lateral septum; MS, medial septum; DAPI, 4′,6-diamidino-2-phenylindole.
Extended Data Figure 7. Direct lHb stimulation bi-directionally modulates aggression reward.
(a) Schematic of viral infection strategy. Representative images of lHb cell body infection in (b) NON and (c) AGG, scale bar 200 μm. (d) Histological analysis of lHb viral infection. (e) Representative CPP traces of NON. NON::NpHRlHb cell body infection mimics the physiological effect of NON::ChR2BF→lHb terminal stimulation. (f) Normalized CPP score (t15 = 2.834, *P < 0.05; two-tailed unpaired t-test, n = 8–9/group) and subtracted CPP score (t15 = 3.058, **P < 0.01; two-tailed unpaired t-test, n = 8–9/group) in NON::eYFPlHb and NON::NpHRlHb. (g) Individual duration spent in the intruder-paired context for NON::eYFPlHb (t9 = 0.9129, P > 0.05; two-tailed paired t-test, n = 10/group) and NON::NpHRlHb (t9 = 2.344, *P < 0.05; two-tailed paired t-test, n = 10/group). (h) Representative CPP traces of AGG::eYFPlHb and AGG::ChR2lHb. (i) Normalized CPP score (t18 = 2.692, *P < 0.05; two-tailed unpaired t-test, n = 9–11/group) and subtracted CPP score (t18 = 4.203, ***P < 0.01; two-tailed unpaired t-test, n = 9–11/group) for the intruder-paired context in AGG::eYFPlHb and AGG::ChR2lHb. (j) Individual duration spent in the intruder-paired context for AGG::eYFPlHb mice (t10 = 3.212, **P < 0.01; two-tailed paired t-test, n = 9/group) and AGG::ChR2lHb mice (t8 = 1.348, P < 0.05; two-tailed paired t-test, n = 11/group). Summary data are represented as mean ± s.e.m. NON, non-aggressor; AGG, aggressor; lHb, lateral habenula; mHb, medial habenula; BF, basal forebrain; dStr, dorsal striatum.
Extended Data Figure 8. BF-lHb stimulation modulates cocaine CPP.
(a) Experimental timeline of general anxiety and cocaine CPP testing. BF-lHb stimulation during (b–c) open field testing and (d–e) elevated plus maze testing. (f) Subthreshold cocaine (10 mg/kg, i.p.) CPP procedure with BF-lHb stimulation during CPP test (t9 = 2.403, P < 0.05; two-tailed unpaired t-test, n = 5–6/group).
Extended Data Table 1. Stress and anxiety behaviors in NON and AGG.
| Elevated plus maze
| |||||||
|---|---|---|---|---|---|---|---|
| Duration in (s) | Latency to enter (s) | Distance (cm) | Velocity (cm/s) | ||||
| Closed arms | Open arms | Closed arms | Open arms | ||||
|
| |||||||
| NON | Mean | 136.53 | 58.85 | 13.51 | 9.06 | 2412.14 | 8.16 |
| SEM | 11.71 | 8.55 | 9.22 | 2.37 | 114.19 | 0.38 | |
| AGG | Mean | 137.39 | 65.07 | 5.11 | 5.50 | 2515.77 | 8.67 |
| SEM | 6.51 | 10.48 | 2.21 | 1.79 | 136.55 | 0.46 | |
| P value | 0.95 | 0.65 | 0.39 | 0.24 | 0.57 | 0.40 | |
| n | 12 | 12 | 12 | 12 | 12 | 12 | |
| Open field and locomotion
| |||||||
|---|---|---|---|---|---|---|---|
| Duration in (s) | Latency (s) | Distance (cm) | Velocity (cm/s) | ||||
| Center | Middle | Periphery | Center | ||||
|
| |||||||
| NON | Mean | 18.80 | 126.63 | 373.76 | 24.35 | 4909.51 | 8.77 |
| SEM | 3.28 | 28.87 | 58.22 | 7.78 | 374.32 | 0.59 | |
| AGG | Mean | 15.59 | 138.70 | 445.82 | 31.31 | 4335.25 | 8.90 |
| SEM | 1.77 | 11.63 | 12.20 | 7.22 | 211.61 | 0.36 | |
| P value | 0.36 | 0.82 | 0.48 | 0.53 | 0.73 | 0.84 | |
| n | 7–11 | 7–11 | 7–11 | 7–11 | 7–11 | 7–11 | |
| Forced-swim test
| ||||||
|---|---|---|---|---|---|---|
| Duration (s) | Distance (cm) | Velocity (cm/s) | Percent immobile | |||
| Mobile | Immobile | |||||
|
| ||||||
| NON | Mean | 260.96 | 175.76 | 2041.17 | 11.40 | 0.40 |
| SEM | 7.78 | 8.21 | 101.09 | 0.58 | 0.02 | |
| AGG | Mean | 275.40 | 164.19 | 2076.95 | 11.57 | 0.37 |
| SEM | 8.20 | 8.92 | 70.68 | 0.39 | 0.02 | |
| P value | 0.22 | 0.35 | 0.78 | 0.81 | 0.29 | |
| n | 10 | 10 | 10 | 10 | 10 | |
| Sucrose preference
| ||||||||||
|---|---|---|---|---|---|---|---|---|---|---|
| Volume consumed (ml) | Sucrose preference | |||||||||
| Day 1 | Day 2 | Day 1 + Day 2 | Sucrose/(Sucrose + Water) | |||||||
| Water | Sucrose | Water | Sucrose | Water | Sucrose | Day 1 | Day 2 | Day 1 + Day 2 | ||
|
| ||||||||||
| NON | Mean | 2.44 | 5.74 | 1.54 | 5.74 | 3.98 | 11.48 | 0.71 | 0.76 | 0.75 |
| SEM | 0.65 | 0.66 | 0.26 | 0.69 | 0.79 | 0.86 | 0.07 | 0.05 | 0.04 | |
| AGG | Mean | 2.39 | 5.15 | 2.03 | 7.50 | 4.42 | 12.65 | 0.69 | 0.78 | 0.74 |
| SEM | 0.58 | 0.58 | 0.59 | 0.77 | 0.70 | 1.05 | 0.06 | 0.06 | 0.04 | |
| P value | 0.95 | 0.51 | 0.47 | 0.11 | 0.68 | 0.41 | 0.82 | 0.77 | 0.84 | |
| n | 10–11 | 10–11 | 10–11 | 10–11 | 10–11 | 10–11 | 10–11 | 10–11 | 10–11 | |
The behavioral data are shown as mean ± SEM and analyzed by unpaired Student’s t-test. Significance at
P<0.05.
NON, non-aggressor; AGG, aggressor.
Extended Data Table 2. Social approach behaviors in NON and AGG.
| Social interaction test
| |||||||||||
|---|---|---|---|---|---|---|---|---|---|---|---|
| Approach | No target interaction zone (s) | Target interaction zone (s) | No target corner zone (s) | Target corner zone (s) | |||||||
| CD-1 | C57 | CD-1 | C57 | CD-1 | C57 | CD-1 | C57 | ||||
|
|
|||||||||||
| NON | Mean | 56.62 | 51.55 | 77.49 | 76.42 | 34.77 | 32.53 | 21.54 | 25.03 | ||
| SEM | 7.20 | 7.66 | 5.25 | 6.71 | 5.64 | 6.23 | 4.76 | 2.80 | |||
| AGG | Mean | 55.71 | 54.17 | 82.44 | 79.37 | 28.24 | 29.83 | 20.79 | 23.20 | ||
| SEM | 4.67 | 6.07 | 6.13 | 8.91 | 2.52 | 5.71 | 2.84 | 4.95 | |||
| P value | 0.67 | 0.80 | 0.53 | 0.85 | 0.56 | 0.55 | 0.81 | 0.82 | |||
| n | 6–7 | 6–7 | 6–7 | 6–7 | 6–7 | 6–7 | 6–7 | 6–7 | |||
|
| |||||||||||
| Locomotion | No target distance (cm) | Target distance (cm) | No target velocity (cm/s) | Target velocity (cm/s) | |||||||
| CD-1 | C57 | CD-1 | C57 | CD-1 | C57 | CD-1 | C57 | ||||
|
|
|||||||||||
| NON | Mean | 1501.64 | 1715.50 | 1343.64 | 1447.93 | 10.01 | 11.44 | 8.96 | 9.65 | ||
| SEM | 198.09 | 83.30 | 153.22 | 89.24 | 1.32 | 0.56 | 1.02 | 0.59 | |||
| AGG | Mean | 1544.73 | 1699.40 | 1284.39 | 1474.84 | 10.31 | 11.39 | 8.57 | 9.87 | ||
| SEM | 31.04 | 121.71 | 41.37 | 97.81 | 0.20 | 0.83 | 0.28 | 0.63 | |||
| P value | 0.83 | 0.92 | 0.72 | 0.84 | 0.82 | 0.96 | 0.72 | 0.81 | |||
| n | 6–7 | 6–7 | 6–7 | 6–7 | 6–7 | 6–7 | 6–7 | 6–7 | |||
| Social vs. novel object test
| |||||||||||
|---|---|---|---|---|---|---|---|---|---|---|---|
| Pretest phase | CD-1 Target | C57BL6/J Target | |||||||||
| Duration (s) | Normalized social score | Subtracted social score | Duration (s) | Normalized social score | Subtracted social score | ||||||
| Social | Novel | Social | Novel | Social | Novel | Social | Novel | ||||
|
|
|
||||||||||
| NON | Mean | 114.42 | 94.84 | - | - | 19.59 | 114.91 | 95.51 | - | - | 19.40 |
| SEM | 5.30 | 8.12 | - | - | 11.78 | 7.96 | 7.70 | - | - | 15.22 | |
| AGG | Mean | 121.48 | 97.66 | - | - | 23.82 | 106.41 | 95.02 | - | - | 11.38 |
| SEM | 6.40 | 8.34 | - | - | 12.70 | 10.22 | 10.81 | - | - | 18.66 | |
| P value | 0.41 | 0.81 | - | - | 0.81 | 0.52 | 0.97 | - | - | 0.74 | |
| n | 7–8 | 7–8 | - | - | 7–8 | 8 | 8 | - | - | 8 | |
|
| |||||||||||
| Test phase | CD-1 Target | C57BL6/J Target | |||||||||
| Duration (s) | Normalized social score | Subtracted social score | Duration (s) | Normalized social score | Subtracted social score | ||||||
| Social | Novel | Social | Novel | Social | Novel | Social | Novel | ||||
|
|
|
||||||||||
| NON | Mean | 166.49 | 93.31 | 1.50 | 1.08 | 73.17 | 153.47 | 95.64 | 1.41 | 1.04 | 57.83 |
| SEM | 12.49 | 10.70 | 0.16 | 0.19 | 22.88 | 6.41 | 4.87 | 0.16 | 0.09 | 9.14 | |
| AGG | Mean | 154.89 | 100.56 | 1.30 | 1.08 | 54.33 | 148.77 | 98.80 | 1.50 | 1.13 | 49.97 |
| SEM | 5.03 | 7.04 | 0.09 | 0.12 | 10.61 | 7.60 | 8.42 | 0.16 | 0.14 | 14.21 | |
| P value | 0.41 | 0.59 | 0.32 | 0.98 | 0.49 | 0.55 | 0.48 | 0.85 | 0.32 | 0.83 | |
| n | 7–8 | 7–8 | 7–8 | 7–8 | 7–8 | 8 | 8 | 8 | 8 | 8 | |
The behavioral data are shown as mean ± SEM and analyzed by unpaired Student’s t-test. Significance at
P<0.05.
NON, non-aggressor; AGG, aggressor. The subtracted social score was derived by subtracting time in social-paired chamber from the novel object-paired chamber during the test phase. Normalized social score is the ratio of time spent in the chamber of interest (social target or novel object) during the test phase over the pretest phase.
Acknowledgments
We would like to thank Drs. Klaus Miczek and Yavin Shaham for their input on these projects.
This research was supported by US National Institute of Health grants R01 MH090264, P50 MH096890 and P50 AT008661-01 (SJR), R01 MH092306 (MHH), T32 MH087004 (MLP, MH and MF), T32 MH096678 (MLP), F30 MH100835 (MH), F31 MH105217 (MLP), NIGMS 1FI2GM117583-01 (SAG) and NSFC 81200862 (HZ).
Footnotes
Contributions:
SAG and SJR designed and wrote the manuscript. SAG, DJC, MH, CM, JJW, MLP, HA, GEH, MF, DF, DB, LK, JT, BK collected behavioral and IHC data and aided in data analysis. HZ, MH, DC, MHH, KG and MLS designed, carried out and analyzed electrophysiological experiments.
Competing financial interests
The authors wish to declare no competing financial interests.
References
- 1.Anderson DJ. Optogenetics, sex, and violence in the brain: implications for psychiatry. Biol Psychiatry. 71:1081–1089. doi: 10.1016/j.biopsych.2011.11.012. [DOI] [PMC free article] [PubMed] [Google Scholar]
- 2.Decety J, Michalska KJ, Akitsuki Y, Lahey BB. Atypical empathic responses in adolescents with aggressive conduct disorder: a functional MRI investigation. Biological psychology. 2009;80:203–211. doi: 10.1016/j.biopsycho.2008.09.004. [DOI] [PMC free article] [PubMed] [Google Scholar]
- 3.Yang CF, et al. Sexually dimorphic neurons in the ventromedial hypothalamus govern mating in both sexes and aggression in males. Cell. 2013;153:896–909. doi: 10.1016/j.cell.2013.04.017. [DOI] [PMC free article] [PubMed] [Google Scholar]
- 4.Wasman M, Flynn JP. Directed attack elicited from hypothalamus. Arch Neurol. 1962;6:220–227. doi: 10.1001/archneur.1962.00450210048005. [DOI] [PubMed] [Google Scholar]
- 5.Lin D, et al. Functional identification of an aggression locus in the mouse hypothalamus. Nature. 2011;470:221–226. doi: 10.1038/nature09736. [DOI] [PMC free article] [PubMed] [Google Scholar]
- 6.Unger EK, et al. Medial amygdalar aromatase neurons regulate aggression in both sexes. Cell reports. 2015;10:453–462. doi: 10.1016/j.celrep.2014.12.040. [DOI] [PMC free article] [PubMed] [Google Scholar]
- 7.Yu Q, et al. Optogenetic stimulation of DAergic VTA neurons increases aggression. Molecular psychiatry. 2014;19:635. doi: 10.1038/mp.2014.45. [DOI] [PubMed] [Google Scholar]
- 8.Takahashi A, Miczek KA. Neurogenetics of Aggressive Behavior: Studies in Rodents. Curr Top Behav Neurosci. 2013 doi: 10.1007/7854_2013_263. [DOI] [PMC free article] [PubMed] [Google Scholar]
- 9.Kudryavtseva NN, Bakshtanovskaya IV, Koryakina LA. Social model of depression in mice of C57BL/6J strain. Pharmacol Biochem Behav. 1991;38:315–320. doi: 10.1016/0091-3057(91)90284-9. 0091-3057(91)90284-9 [pii] [DOI] [PubMed] [Google Scholar]
- 10.Golden SA, Covington HE, 3rd, Berton O, Russo SJ. A standardized protocol for repeated social defeat stress in mice. Nat Protoc. 6:1183–1191. doi: 10.1038/nprot.2011.361. [DOI] [PMC free article] [PubMed] [Google Scholar]
- 11.Miczek KA, DeBold JF, Thompson ML. Pharmacological, hormonal, and behavioral manipulations in analysis of aggressive behavior. Prog Clin Biol Res. 1984;167:1–26. [PubMed] [Google Scholar]
- 12.Glenn AL, Yang Y. The potential role of the striatum in antisocial behavior and psychopathy. Biol Psychiatry. 72:817–822. doi: 10.1016/j.biopsych.2012.04.027. [DOI] [PubMed] [Google Scholar]
- 13.Zahm DS, Parsley KP, Schwartz ZM, Cheng AY. On lateral septum-like characteristics of outputs from the accumbal hedonic “hotspot” of Pecina and Berridge with commentary on the transitional nature of basal forebrain “boundaries”. J Comp Neurol. 2013;521:50–68. doi: 10.1002/cne.23157. [DOI] [PMC free article] [PubMed] [Google Scholar]
- 14.Callaway EM, Luo L. Monosynaptic Circuit Tracing with Glycoprotein-Deleted Rabies Viruses. J Neurosci. 2015;35:8979–8985. doi: 10.1523/JNEUROSCI.0409-15.2015. [DOI] [PMC free article] [PubMed] [Google Scholar]
- 15.Lammel S, et al. Input-specific control of reward and aversion in the ventral tegmental area. Nature. 491:212–217. doi: 10.1038/nature11527. [DOI] [PMC free article] [PubMed] [Google Scholar]
- 16.Herkenham M, Nauta WJ. Afferent connections of the habenular nuclei in the rat. A horseradish peroxidase study, with a note on the fiber-of-passage problem. J Comp Neurol. 1977;173:123–146. doi: 10.1002/cne.901730107. [DOI] [PubMed] [Google Scholar]
- 17.Sutherland RJ. The dorsal diencephalic conduction system: a review of the anatomy and functions of the habenular complex. Neurosci Biobehav Rev. 1982;6:1–13. doi: 10.1016/0149-7634(82)90003-3. 0149-7634(82)90003-3 [pii] [DOI] [PubMed] [Google Scholar]
- 18.Lecca S, Meye FJ, Mameli M. The lateral habenula in addiction and depression: an anatomical, synaptic and behavioral overview. Eur J Neurosci. 2014;39:1170–1178. doi: 10.1111/ejn.12480. [DOI] [PubMed] [Google Scholar]
- 19.Shelton L, et al. Mapping pain activation and connectivity of the human habenula. Journal of neurophysiology. 2012;107:2633–2648. doi: 10.1152/jn.00012.2012. [DOI] [PMC free article] [PubMed] [Google Scholar]
- 20.Hikosaka O. The habenula: from stress evasion to value-based decision-making. Nature reviews. Neuroscience. 2010;11:503–513. doi: 10.1038/nrn2866. [DOI] [PMC free article] [PubMed] [Google Scholar]
- 21.Lee EH, Huang SL. Role of lateral habenula in the regulation of exploratory behavior and its relationship to stress in rats. Behav Brain Res. 1988;30:265–271. doi: 10.1016/0166-4328(88)90169-6. 0166-4328(88)90169-6 [pii] [DOI] [PubMed] [Google Scholar]
- 22.Maroteaux M, Mameli M. Cocaine evokes projection-specific synaptic plasticity of lateral habenula neurons. J Neurosci. 32:12641–12646. doi: 10.1523/JNEUROSCI.2405-12.2012. [DOI] [PMC free article] [PubMed] [Google Scholar]
- 23.Li B, et al. Synaptic potentiation onto habenula neurons in the learned helplessness model of depression. Nature. 470:535–539. doi: 10.1038/nature09742. [DOI] [PMC free article] [PubMed] [Google Scholar]
- 24.Yetnikoff L, Cheng AY, Lavezzi HN, Parsley KP, Zahm DS. Sources of input to the rostromedial tegmental nucleus, ventral tegmental area, and lateral habenula compared: A study in rat. J Comp Neurol. 2015;523:2426–2456. doi: 10.1002/cne.23797. [DOI] [PMC free article] [PubMed] [Google Scholar]
- 25.Quina LA, et al. Efferent pathways of the mouse lateral habenula. J Comp Neurol. 2015;523:32–60. doi: 10.1002/cne.23662. [DOI] [PMC free article] [PubMed] [Google Scholar]
- 26.Felton TM, Linton L, Rosenblatt JS, Morell JI. First and second order maternal behavior related afferents of the lateral habenula. Neuroreport. 1999;10:883–887. doi: 10.1097/00001756-199903170-00039. [DOI] [PubMed] [Google Scholar]
- 27.Beck A, Heinz AJ, Heinz A. Translational clinical neuroscience perspectives on the cognitive and neurobiological mechanisms underlying alcohol-related aggression. Curr Top Behav Neurosci. 2014;17:443–474. doi: 10.1007/7854_2013_258. [DOI] [PubMed] [Google Scholar]
- 28.Martin LA, Neighbors HW, Griffith DM. The experience of symptoms of depression in men vs women: analysis of the National Comorbidity Survey Replication. JAMA psychiatry. 2013;70:1100–1106. doi: 10.1001/jamapsychiatry.2013.1985. [DOI] [PubMed] [Google Scholar]
- 29.Bewernick BH, Kayser S, Sturm V, Schlaepfer TE. Long-term effects of nucleus accumbens deep brain stimulation in treatment-resistant depression: evidence for sustained efficacy. Neuropsychopharmacology. 37:1975–1985. doi: 10.1038/npp.2012.44. [DOI] [PMC free article] [PubMed] [Google Scholar]
- 30.Sartorius A, Henn FA. Deep brain stimulation of the lateral habenula in treatment resistant major depression. Med Hypotheses. 69:1305–1308. doi: 10.1016/j.mehy.2007.03.021. S0306-9877(07)00247-2 [pii] [DOI] [PubMed] [Google Scholar]
- 31.Kudryavtseva NN, Bondar NP, Avgustinovich DF. Association between experience of aggression and anxiety in male mice. Behav Brain Res. 2002;133:83–93. doi: 10.1016/s0166-4328(01)00443-0. S0166432801004430 [pii] [DOI] [PubMed] [Google Scholar]
- 32.Russo SJ, et al. Nuclear factor kappa B signaling regulates neuronal morphology and cocaine reward. J Neurosci. 29:3529–3537. doi: 10.1523/JNEUROSCI.6173-08.2009. [DOI] [PMC free article] [PubMed] [Google Scholar]
- 33.Golden SA, et al. Epigenetic regulation of RAC1 induces synaptic remodeling in stress disorders and depression. Nature medicine. 2013;19:337–344. doi: 10.1038/nm.3090. [DOI] [PMC free article] [PubMed] [Google Scholar]
- 34.Krishnan V, et al. Molecular adaptations underlying susceptibility and resistance to social defeat in brain reward regions. Cell. 131:391–404. doi: 10.1016/j.cell.2007.09.018. S0092-8674(07)01206-8. [DOI] [PubMed] [Google Scholar]
- 35.Yang M, Silverman JL, Crawley JN. Automated three-chambered social approach task for mice. Curr Protoc Neurosci. 2011;Chapter 8(Unit 8):26. doi: 10.1002/0471142301.ns0826s56. [DOI] [PMC free article] [PubMed] [Google Scholar]
- 36.Golde WT, Gollobin P, Rodriguez LL. A rapid, simple, and humane method for submandibular bleeding of mice using a lancet. Lab Anim (NY) 34:39–43. doi: 10.1038/laban1005-39. laban1005-39 [pii] [DOI] [PubMed] [Google Scholar]
- 37.Chaudhury D, et al. Rapid regulation of depression-related behaviours by control of midbrain dopamine neurons. Nature. 2013;493:532–536. doi: 10.1038/nature11713. [DOI] [PMC free article] [PubMed] [Google Scholar]
- 38.Friedman AK, et al. Enhancing depression mechanisms in midbrain dopamine neurons achieves homeostatic resilience. Science. 2014;344:313–319. doi: 10.1126/science.1249240. [DOI] [PMC free article] [PubMed] [Google Scholar]
- 39.Lobo MK, et al. DeltaFosB induction in striatal medium spiny neuron subtypes in response to chronic pharmacological, emotional, and optogenetic stimuli. J Neurosci. 33:18381–18395. doi: 10.1523/JNEUROSCI.1875-13.2013. [DOI] [PMC free article] [PubMed] [Google Scholar]
- 40.Lobo MK, et al. Cell type-specific loss of BDNF signaling mimics optogenetic control of cocaine reward. Science. 2010;330:385–390. doi: 10.1126/science.1188472. [DOI] [PMC free article] [PubMed] [Google Scholar]
- 41.Stamatakis AM, Stuber GD. Activation of lateral habenula inputs to the ventral midbrain promotes behavioral avoidance. Nat Neurosci. 15:1105–1107. doi: 10.1038/nn.3145. [DOI] [PMC free article] [PubMed] [Google Scholar]
- 42.Chandra R, et al. Optogenetic inhibition of D1R containing nucleus accumbens neurons alters cocaine-mediated regulation of Tiam1. Front Mol Neurosci. 2013;6:13. doi: 10.3389/fnmol.2013.00013. [DOI] [PMC free article] [PubMed] [Google Scholar]
- 43.Aquili L, Liu AW, Shindou M, Shindou T, Wickens JR. Behavioral flexibility is increased by optogenetic inhibition of neurons in the nucleus accumbens shell during specific time segments. Learn Mem. 21:223–231. doi: 10.1101/lm.034199.113. [DOI] [PMC free article] [PubMed] [Google Scholar]
- 44.Kadir SN, Goodman DFM, Harris KD. High-dimensional cluster analysis with the Masked EM Algorithm. 2013 doi: 10.1162/NECO_a_00661. eprint arXiv:1309.2848. [DOI] [PMC free article] [PubMed] [Google Scholar]


