Abstract
When developing a causal probabilistic model, i.e. a Bayesian network (BN), it is common to incorporate expert knowledge of factors that are important for decision analysis but where historical data are unavailable or difficult to obtain. This paper focuses on the problem whereby the distribution of some continuous variable in a BN is known from data, but where we wish to explicitly model the impact of some additional expert variable (for which there is expert judgment but no data). Because the statistical outcomes are already influenced by the causes an expert might identify as variables missing from the dataset, the incentive here is to add the expert factor to the model in such a way that the distribution of the data variable is preserved when the expert factor remains unobserved. We provide a method for eliciting expert judgment that ensures the expected values of a data variable are preserved under all the known conditions. We show that it is generally neither possible, nor realistic, to preserve the variance of the data variable, but we provide a method towards determining the accuracy of expertise in terms of the extent to which the variability of the revised empirical distribution is minimised. We also describe how to incorporate the assessment of extremely rare or previously unobserved events.
Keywords: Bayesian networks, belief networks, causal inference, expert knowledge, knowledge elicitation, probabilistic graphical models
1. Introduction and Motivation
Causal probabilistic networks, also known as Bayesian networks (BNs), are a well established graphical formalism for encoding conditional probabilistic relationships among uncertain variables. The nodes of a BN represent variables and the arcs represent causal or influential relationships between them. BNs are based on sound foundations of causality and probability theory; namely Bayesian probability (Pearl, 2009).
It has been argued that developing an effective BN requires a combination of expert knowledge and data (Fenton & Neil, 2012). Yet, rather than combining both sources of information, in practice many BN models have been ‘learnt’ purely from data, while others have been built solely on expert knowledge. Apart from lack of data, one possible explanation for this phenomenon is that in order to be able to combine knowledge with data researchers typically require a strong background in both data mining and expert systems, as well as to have access to, and time for, the actual domain expert elicitation.
Irrespective of the method used, building a BN involves the following two main steps:
-
Determining the structure of the network: Many of the real-world application models that have been constructed solely based on expert elicitation are in areas where humans have a good understanding of the underlying causal factors. These include medicine, project management, sports, forensics, marketing and investment decision making (Heckerman et al., 1992a; 1992b; Andreassen et al., 1999; Lucas et al., 2000; van der Gaag, 2002; Fenton & Neil, 2012; Constantinou et al., 2012; 2015b; Yet et al., 2013; 2015; Kendrick, 2015).
In other applications such as bioinformatics, image processing and natural language processing, the task of determining the causal structure is generally too complex for humans. With the advent of big-data, much of the current research on BN development assumes that sufficient data are available to learn the underlying BN structure (Spirtes & Glymour, 1991; Verma & Pearl, 1991; Spirtes et al, 1993; Friedman et al., 1997; 2000; Jaakkola et al., 2010; Nassif et al., 2012; 2013; Petitjean et al., 2013), hence assuming the expert’s input is minimal or even redundant. Recent relevant research does relax this impression and allows for some expert input to be incorporated in the form of constraints (de Campos & Ji, 2011; Zhou et al., 2014a). It is, however, increasingly widely understood that incorporating expert knowledge can result in significant model improvements (Spiegelhalter et al., 2004; Rebonato, 2010; Pearl, 2009; Fenton & Neil, 2012; Constantinou et al., 2012; 2013; Zhou et al., 2014b), and this becomes even more obvious when dealing with interventions and counterfactuals (Constantinou et al., 2015a).
-
Determining the conditional probabilities (CPTs) for each node (also referred to as the parameters of the model): If the structure of the BN is learnt purely from data, then it is usual also for the parameter learning to be performed during that process. On the other hand, if expert knowledge is incorporated into a BN then parameter learning is, most typically, performed (or finalised) after the network structure has been determined.
The parameters can be learnt from data and/or expert judgments. If the data has missing values, then parameter learning is usually performed by the use of the Expectation Maximisation algorithm (Lauritzen, 1995), or other variations of this algorithm (Jamshidian & Jennrich, 1997; Jordan, 1999; Matsuyama, 2003; Hunter & Lange, 2004; Jiangtao et al., 2012), which represent a likelihood-based iterative method for approximating the parameters of a BN. Other, much less popular methods, include restricting the parameter learning process only to cases with complete data, or using imputation-based approaches to fill the missing data points with the most probable values (Enders, 2006).
When developing BNs for practical applications, it is common to incorporate expert knowledge of factors that are important for decision analysis but where historical data is unavailable or difficult to obtain. That is the context for this paper. Previous related research in expert elicitation extensively covers:
Accuracy in eliciting experts’ beliefs: It is often unrealistic to expect precise probability values to be provided by the expert. It is shown that participants with mathematical (or relevant) background tend to provide more accurate quantitative descriptions of their beliefs (Murphy & Winkler, 1977; Wallsten & Budescu, 1983). However, only few experts have sufficient mathematical experience and as a result, various probability elicitation methods have been proposed. These include probability scales with verbal and/or numerical anchors (Kuipers et al., 1988; van der Gaag et al., 1999; van der Gaag et al., 2002; Renooij, 2001), iterative processes which combine whatever the expert is willing to state (Druzdzel & van der Gaag, 1995), use of frequencies such as “1 in 10” in situations where events are believed to be based on extreme probabilities (Gigerenzer & Hoffrage, 1995), visual aids (Korb & Nicholson, 2011), as well as estimating the probabilities based on the lower and upper extremes of the experts’ belief (Hughes, 1991).
Biases in experts’ beliefs: It has been demonstrated that limited knowledge of probability and statistics threatens the validity and reliability of expert judgments, leading to a number of biases (Johnson et al., 2010a). Various techniques for dealing with potential biases have been proposed. According to (Johnson et al., 2010b), these include provision of an example (Bergus et al., 1995; Evans et al., 1985; Evans et al., 2002; White et al., 2005), training exercises (Van der Fels-Klerx, 2002), use of clear instructions (Li & Krantz, 2005) or a standardized script (Chaloner, 1996), avoidance of scenarios or summaries of data, provision of feedback, verification, and opportunity for revision (O’Hagan, 1998; Normand, 2002), and a statement of the baseline rate or outcome in untreated patients (Evans et al., 2002). Further general guidelines in terms of how to reliably elicit expert judgments and minimise potential biases are provided in (Druzdzel & van der Gaag, 1995; O’Hagan et al., 2006; Johnson et al., 2010b).
While the above previous relevant research deals extensively with the process by which expert judgments are elicited, it does so under the assumption that any resulting CPTs will solely be based on expert knowledge as elicited. This paper tackles a problem which does not seem to have been addressed previously. Specifically, we are interested in preserving some aspects of a pure data-driven model when incorporating expert knowledge.
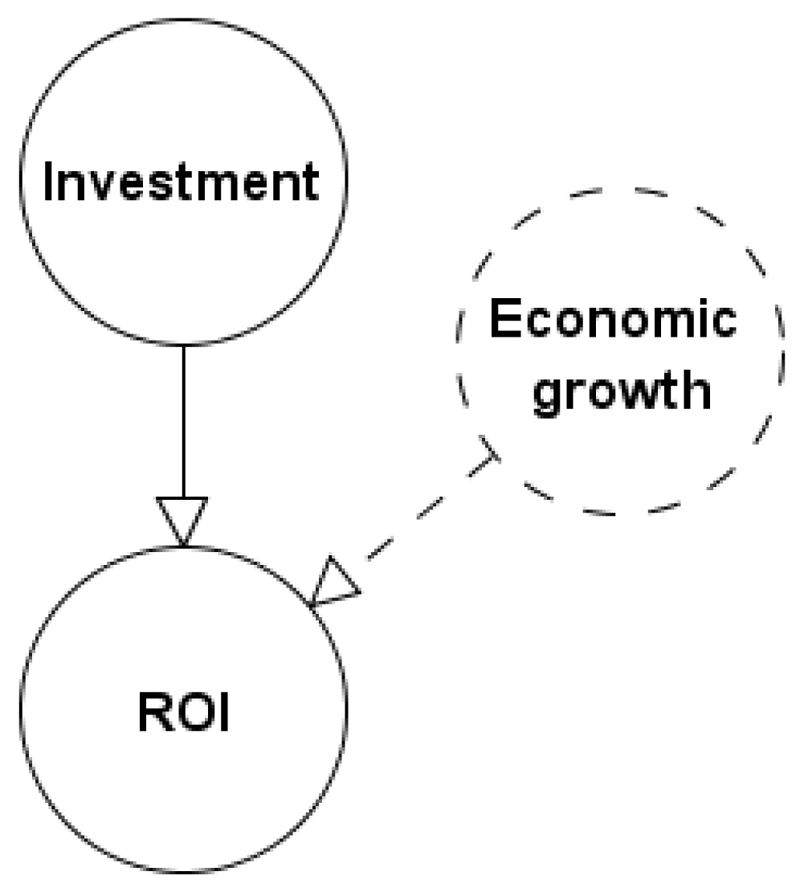
For example, we may have extensive historical data about Return on Investment (ROI) (we will call this the dependent data node) given different types of investment (such as properties, bonds, shares), as captured in the very simple BN model shown in Figure 1.
Figure 1.
Purely data-driven BN model M of the investment problem.
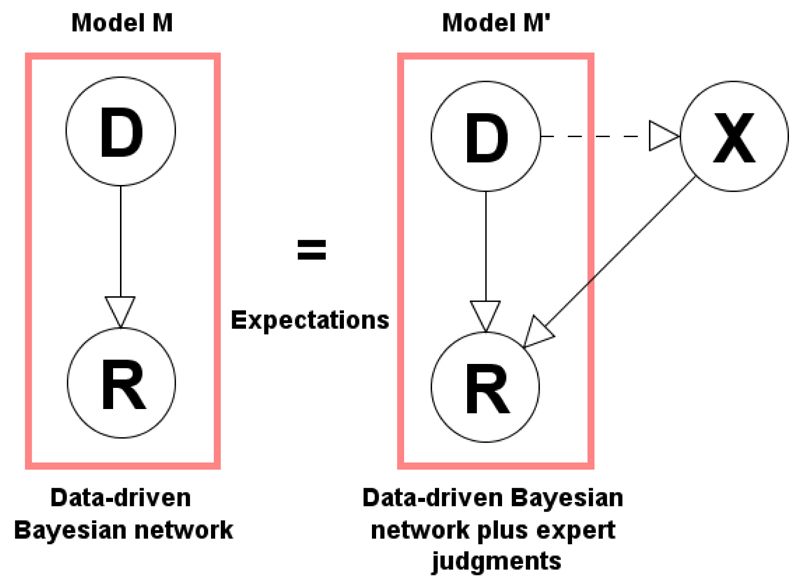
If the data-driven ROI distribution given Investment is based on rich and accurate data that is fully representative of the context and is without bias, then we can be confident that the resulting marginal ROI distribution represents the true distribution. However, this distribution actually incorporates multiple dependent factors other than Investment type. If there is available expert knowledge about such factors such as, for example, Economic growth, then it is desirable to be able to incorporate such factors into an extended version of the BN as show in Figure 2.
Figure 2.
Extending model M from Figure 1 to model M′ to include expert knowledge about economic growth.
A logical and reasonable requirement is to preserve in M′ as much as possible of the marginal distribution for the dependent data node (ROI in the example) when the expert variables (Economic growth in the example) remain unobserved. The paper describes a method to do this. In fact, for reasons explained in Section 2, it turns out that while it is possible to preserve the expected values of the marginal distribution under each of the known dependent scenarios, it is infeasible and unrealistic to preserve the variance. In Section 3, which describes the generic problem, we provide a method showing how to preserve the expectations. Section 4 demonstrates worked examples of the method. Section 5 addresses the issues of variance of the data node and provides a method for validating the expert judgments in terms of ‘realism’. Section 6 demonstrates the applicability of the method to problems that, even though they are based on rich data, may still fail to capture extremely rare or previously unobserved events. Section 7 discusses limitations and extensions of the method, Section 8 discusses the scalability and practicality of the method for real-world applications, and we provide our concluding remarks in Section 9.
2. Why it is Reasonable to Preserve the Expected Value but not the Variance
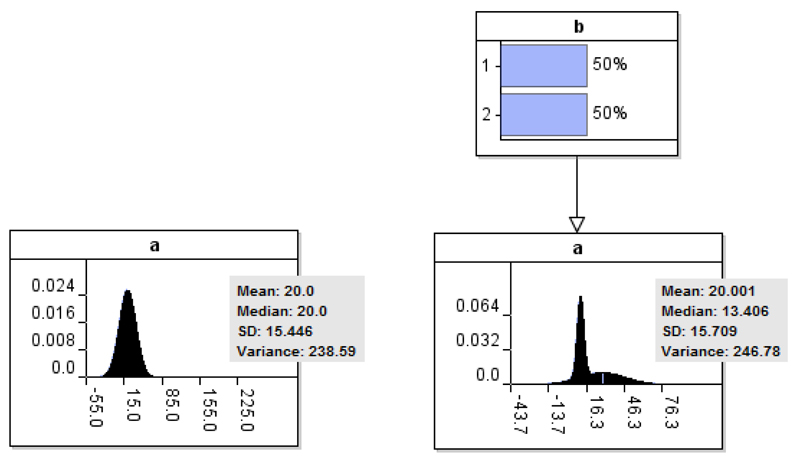
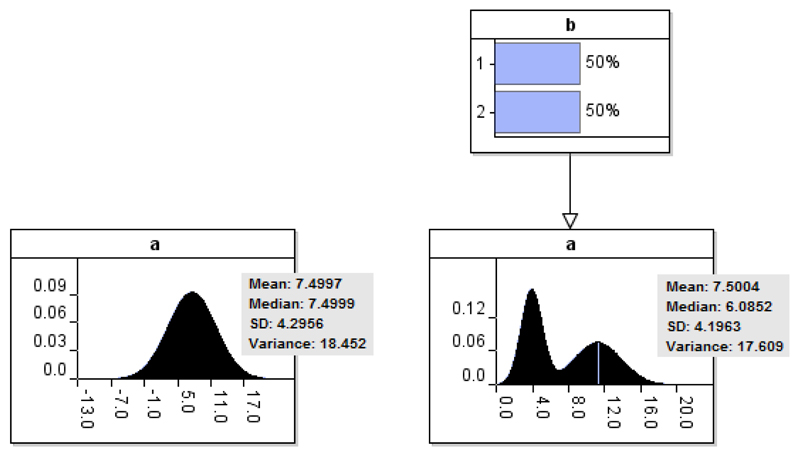
The statistical expectations of the dependent data node are already influenced by the causes the expert might identify as missing variables and it makes sense to preserve these expected values. However, the same is not true of the shape and variance of the distribution To see why, Figure 3 presents two BN models, model A (left) and model B (right). Suppose that in this case, the variable b incorporated into model B is also based on data, rather than on expert judgments. The data taken into consideration for learning the models is presented in Table 1. Note that,
The expected value of distribution a is preserved in model B;
The shape of distribution a is subject to amendments in model B, even though both models consider identical data with regards to the outputs of a;
The variance of distribution a increases in model B.
Figure 3.
The outputs of two data-driven BNs (Models A and B left and right respectively) based on the data presented in Table 1.
Table 1.
The data considered by the BNs presented in Figure 3.
| Model A | Model B | ||
|---|---|---|---|
| a | a|b1 | a|b2 | |
| 34 | 34 | 12 | |
| 5 | 5 | 13 | |
| 56 | 56 | 10 | |
| 34 | 34 | 9 | |
| 12 | 12 | 8 | |
| 32 | 32 | 15 | |
| 12 | - | - | |
| 13 | - | - | |
| 10 | - | - | |
| 9 | - | - | |
| 8 | - | - | |
| 15 | - | - | |
| Mean | 20 | 28.83 | 11.17 |
| Variance | 238.55 | 330.56 | 6.97 |
Figure A.1 and Table A.1 in Appendix A replicate this example with different values to simply demonstrate that the variance of distribution a in model B can also decrease.
Table 8.
The CPT for node ROI given Investment, assuming Grexit=Yes, and based on the model presented in Figure 11.
| D | Properties | Bonds | Shares |
|---|---|---|---|
| X | Yes | Yes | Yes |
| R | N(-10, 100) | N (0, 1) | N (-40,1000) |
From this we conclude that,
The expected value of a data-driven distribution in model A is already influenced by the causes that might be missing and hence, the expected value is preserved between models A and B;
The variance and the shape of a data-driven distribution in model A is not fully influenced by the causes that might be missing and hence, both the variance and the shape of the distribution are subject to amendments between models A and B (as stated earlier, this is simply because the number of mixture distributions taken into consideration by variable a changes between models).
As a result, we focus only on preserving the expected value of a data-driven distribution, when incorporating expert judgments into the model. This leads to the following generic challenge:
How do we introduce expert variables in a data-driven Bayesian network to improve decision analysis, but which will not affect the data-driven expectations of the model when these expert variables remain unobserved.
Formally this is equivalent to saying that the marginal expectations of the outcome variable should be the same before and after the introduction of the expert variable(s).
With regards to the variance of the data-driven distribution, while there is no incentive to fully preserve it, we are still interested in preserving some aspects of it. More specifically, we do not want the revised distribution in model M′ (i.e. which incorporates expert judgments) to have significant discrepancies, in terms of variability, from the respective distribution of model M.
3. Generic Description of the Problem and the Method
3.1. Description of the problem
The problem we are interested in solving is the general case where a discrete expert variable is inserted into a BN model as a parent of a discrete/continuous data variable. Note that while the description of the method provided below is based on the simplest form of a BN model, and based on the assumption that the data variable is continuous, the method is applicable to any BN structure. However, when the data variable is discrete some limitations apply, and which we discuss in section 7.
Suppose we have a BN model fragment M as shown in Figure 4a, comprising two variables for which we have extensive data. This represents the simplest form of a BN mode. We assume that D is a discrete variable with states d1, …, dn, and R is a continuous variable. The model M represents empirically observed data about the influence of D on R.
Figure 4.
Graphical representation illustrating the concept of the method, where Model M, with data variables D and R, is extended to alternative Model M′ which incorporates expert variable X (the dashed arc is optional, indicating that expectations are preserved even if X is dependent on another data variable).
In the example in Section 1, the states of D are the investment options {bonds, shares, properties} and R is the ROI, expressed as an observed distribution of values for each different investment option.
We assume that, from relevant data:
-
a)
P(Di) = di is known1 for each i = 1, …, n
-
b)
f(R|Di) is a known distribution for each i = 1, …, n
Hence, these are the parameters of the model M. Let the expected value E(f(R|Di)) = ri for each i = 1, …, n. For simplicity, we write this as E(R|Di) = ri. Hence, in model M the expected value of R is:
| (Eq. 1) |
Now consider the revised BN model M′, as shown in Figure 4b. Here X is an expert supplied variable with m states X1, …, Xm. We assume the expert provides the prior probabilities for X, i.e. P(Xj|Di) = pij for each i = 1, …, n and for each j = 1, …, m. When D and X are not linked, then instead of n × m priors we only need m priors P(Xj) = pj for each j = 1, …, m.
The challenge for the expert is to complete the conditional probability table (CPT) for R in M′ in such a way as to preserve all of the conditional expected values of R given D in the original model M, and also preserve the marginal expectation. Specifically, we require:
| (Eq. 2) |
Note that, if we can establish Equation 2, then it follows from Equation 1 that:
Specifically, Equation 2 is also sufficient to prove that the unconditional expected value2 of R is preserved in M’.
3.2. The method
The general form of the CPT for R in M′ can be written as a function fij, whose expected value is rij for each i = 1, …, n and j = 1, …, m, as shown in Table 2. Specifically,
Since each Xj is conditioned on Di we can use marginalisation to compute:
| (Eq. 3) |
Since by Equation 2 we require:
it, therefore, follows from Equation 3 that we require:
| (Eq. 4) |
Table 2.
The CPT for R in M′
| D | D1 | … | Di | … | …Dn | ||||||||||||
|---|---|---|---|---|---|---|---|---|---|---|---|---|---|---|---|---|---|
| X | X1 | X2 | … | Xm−1 | Xm | … | X1 | X2 | … | Xm−1 | Xm | … | X1 | X2 | … | Xm−1 | Xm |
| R | f11 | f12 | … | f1m−1 | f1m | fi1 | fi2 | … | fim−1 | fim | fn1 | fn2 | … | fnm−1 | fnm | ||
Equation 4 thus expresses the necessary constraints on the expert elicited values for rij.
We can use Equation 4 as a consistency check on the expert elicited values if the user wishes to provide them all. However, in practice we would expect the user to provide a subset of the values and so use Equation 4 to solve for the missing values. There is a unique solution in the case when the expert is able to provide m − 1 of the required m values
To prove this, without loss of generality suppose that rim is the ‘missing value’. Then we can compute the value of rim necessary to satisfy Equation 4. We know, by Equation 4, that:
so:
thus:
| (Eq. 5) |
For each i = 1, …, n Equation 5 thus provides the formula for computing the missing CPT values necessary to preserve in the model M′ all of the conditional expected values of R given D in the original model M.
4. Worked Example of the Method
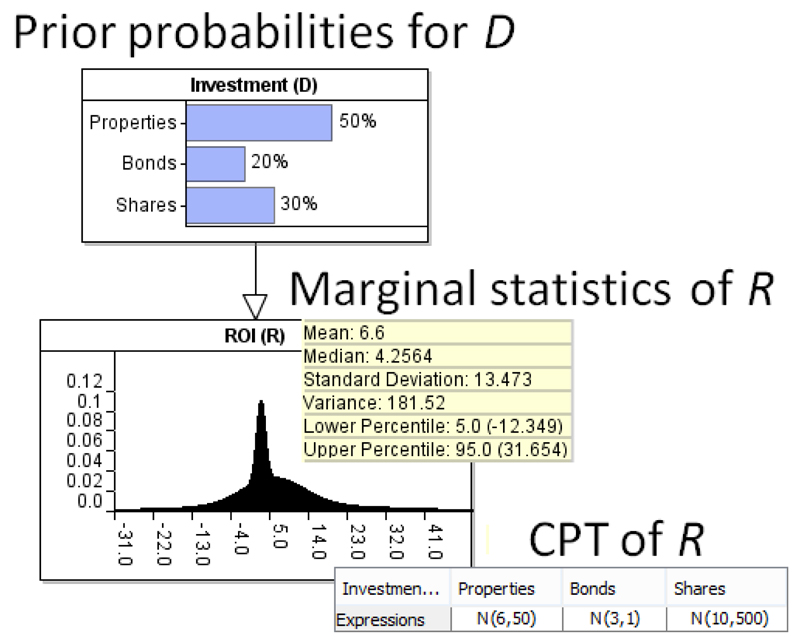
Again using the ROI example introduced in Section 1, Figure 5, shows the BN model M and with the data-driven priors for the investment type (D) and the conditional distribution for ROI (R). We assume an investment firm provides this information to Peter – an expert investor. So R is represented by a mixture set of three Gaussian distributions N(μi, σi2) for i=1,..,3.
Figure 5.
The data-driven BN model M for the example with conditional and marginal probabilities superimposed.
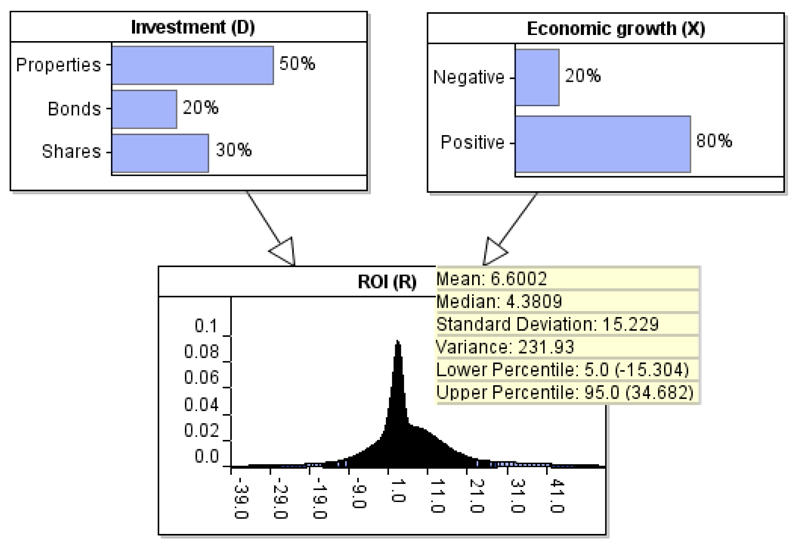
From this model we know, for example, that historically properties have been the most popular investment (50%) but the best investment option, in terms of maximising ROI, would be Shares. Running the BN model3 in Figure 5 based on these priors indicates that the average investor has received a ROI (R) of 6.6%, on an annual basis.
4.1. Case 1: Incorporating expert node X that is independent from node D
Peter would like to incorporate an expert variable into the model - Economic growth, which is only available in the database to those who pay a fee. Instead of ignoring this important factor, however, Peter decides to use his own knowledge (as an experienced investor) to produce reasonable estimates with regards to the impact of economic growth on these potential investments. He remembers that over the past 10 years economic growth has been negative twice, and positive eight times. He, therefore, uses this information as the prior for node Economic growth (X) as shown in Figure 6.
Figure 6.
Extending model M of Figure 5 into model M′ presented in this figure, by incorporating expert knowledge for node Economic growth.
Peter knows from experience that when economic growth is negative, ROI is, for each of the respective investment options; properties, bonds and shares, approximately 1%, 1.5%, and -15%. He, therefore, uses those suggestions to complete part of the CPT in Table 3, assuming Normality and as defined by data given D. Peter need not provide any suggestions with regards to how ROI is expected to change under a positive economic growth, since this is determined by the method of Section 2 and, in particular, Equation 5.
Table 3.
The CPT for node ROI based on the model presented in Figure 6 and Peter’s expert judgments under negative economic growth.
| D | Properties | Bonds | Shares | |||
|---|---|---|---|---|---|---|
| X | Neg. | Pos. | Neg. | Pos. | Neg. | Pos. |
| R | N(1, 50) | ? | N(1.5, 1) | ? | N(-15, 500) | ? |
Specifically, Equation 5 determines the missing parameters of Table 3 in such a way as to ensure the model preserves the data-driven expectations when Economic growth remains unobserved. Namely, not only the prior expectations of ROI (i.e. 6.6%), but also the posterior expectations of ROI under each investment option (i.e. 6%, 3% and 10%).
Using the notation of Section 2, in this example, the probability values of X are simplified from pij to pi since X is independent from D. Accordingly, and based on Equation 5:
We have now determined the impact on ROI under positive economic growth, given Peter’s judgments with respect to negative economic growth. Table 4 presents the completed CPT for node ROI after the method is applied to learn the missing values indicated in Table 3. As shown in Figure 6, the revised CPT of node ROI incorporates Peter’s judgments and successfully preserves the expected value of the distribution (i.e. 6.6%).
Table 4.
The CPT for node ROI based on the model presented in Figure 6.
| D | Properties | Bonds | Shares | |||
|---|---|---|---|---|---|---|
| X | Neg. | Pos. | Neg. | Pos. | Neg. | Pos. |
| R | N(1,50) | N(7.25,50) | N(1.5,1) | N(3.375,1) | N(-15,500) | N(16.25,500) |
4.2. Case 2: The expert variable X is dependent on D
Now suppose that Peter were to incorporate the expert variable Tax allowances claimed, conditioned on the type of investment, for ROI assessment. Any type of investment may have some tax deductible allowances associated with them. For instance, the tax allowances associated with property investments are nowadays lower and more complex than those associated with certain types of share investment. Further, a person who invests in shares may be more likely to claim any full tax allowance than a person who invests in properties. Given that it is the investor’s responsibility to apply for the appropriate tax relief, there will be variations in the amount claimed even for the same type of investment due to people having different incentives about whether to bother applying for tax allowances.
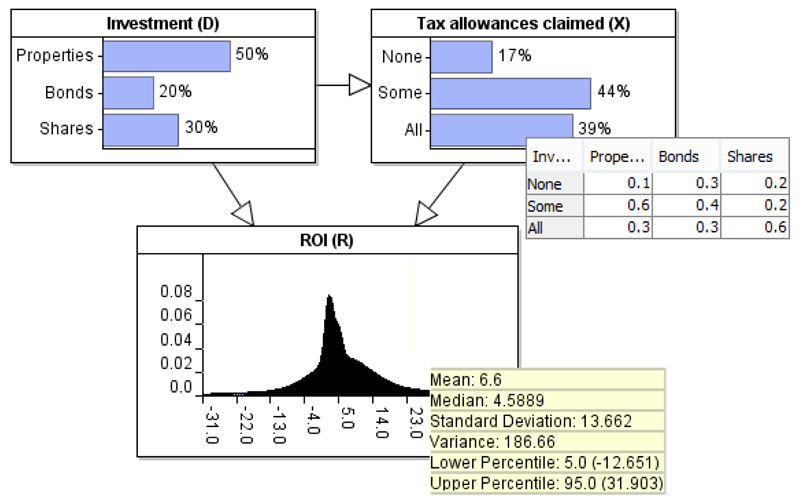
Peter, therefore, introduces an arc from Investment to Tax allowances claimed4. As a result, in this example, X becomes dependent on D as shown in Figure 7. Once again, Peter makes use of his knowledge to inform the model with regards to how ROI is expected to be amended under all of the expertly defined states of Tax allowances claimed, except one, as shown in Table 5.
Figure 7.
Modifying the investment example such that X becomes dependent on D.
Table 5.
The CPT for node ROI based on the model presented in Figure 7 and Peter’s expert judgments under None (N) and Some (S) tax allowance claimed.
| D | Properties | Bonds | Shares | ||||||
|---|---|---|---|---|---|---|---|---|---|
| X | N | S | A | N | S | A | N | S | A |
| R | N(4,50) | N(5,50) | ? | N(2,1) | N(2.5,1) | ? | N(5,500) | N(7,500) | ? |
In order to preserve the data-driven expectations of M in M’, we must now account for the posterior marginal probabilities of X given D. The same method (i.e. Equation 5) can be used to learn the missing values of Table 5. Thus,
Table 6 presents the revised CPT for node ROI, based on the modified model of Figure 7, and after using the method to learn the missing values of Table 5. Figure 7 confirms that the revised CPT of node ROI, which incorporates Peter’s latest judgments, successfully preserves the expected value of the distribution (i.e. 6.6%).
Table 6.
The CPT for node ROI based on the model presented in Figure 7.
| D | Properties | Bonds | Shares | ||||||
|---|---|---|---|---|---|---|---|---|---|
| X | N | S | A | N | S | A | N | S | A |
| R | N(4,50) | N(5,50) | N(8.66,50) | N(2,1) | N(2.5,1) | N(4.66,1) | N(5,500) | N(7,500) | N(12.66,500) |
5. Assessing Expert Judgments for Realism
While the method is capable of preserving the data-driven expectations independent from expert judgments (i.e. a preservation will be achieved however the expert judgments are proposed), we still need to ensure judgments are ‘realistic’. In other words we require a consistency check between the shape and variance of a data-driven distribution in model M, and that of its revised version in model M′.
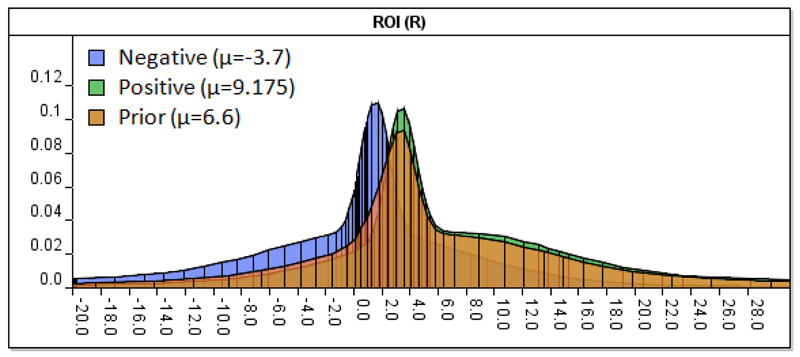
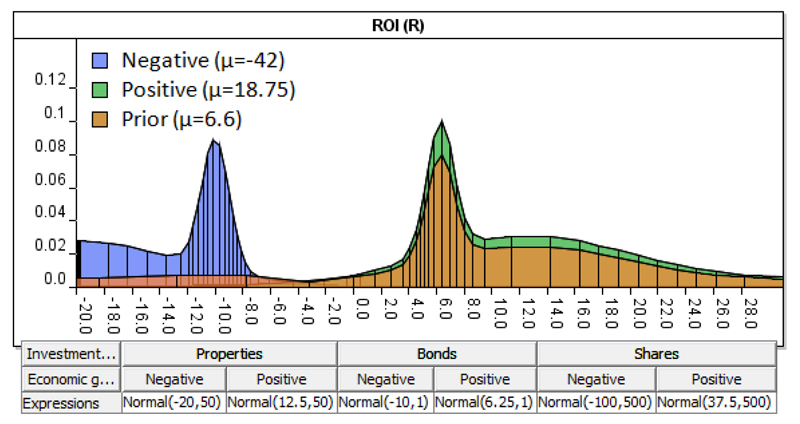
Consider the earlier model presented in Figure 6. The summary statistics of node ROI indicate that at the 5th percentile the value of the distribution is -15.3, and at the 95th percentile the respective value is 34.7. With this level of variability in mind, we could argue that the expert judgments provided in Table 4 under Negative economic growth, as well as the values learnt under Positive economic growth, are realistic. To assess whether this is the case, we plot the distributions of R generated under each state of X (as defined in Table 4) and examine their distance from the prior data mixture distribution, as shown in Figure 8. Figure 9 demonstrates an alternative scenario whereby the distributions of R generated under each state of X are based on expert judgments that could be described as being unrealistic (see the superimposed CPT in Figure 9).
Figure 8.
The distributions under Negative and Positive economic growth, superimposed against the prior data distribution, based on the Model of Figure 6.
Figure 9.
The distributions under Negative and Positive economic growth, superimposed against the prior distribution, based on the Model of Figure 6, and by taking into consideration the new hypothetical CPT (which also preserves data expectations) presented below the figure.
Comparing Figure 8 to Figure 9, it is apparent that one of the expert weighted distributions of Figure 9 falls well outside of the variability of the prior data mixture distribution. More specifically, the expert judgment provided for state Negative of variable X seems to have been exaggerated towards higher losses. Measures such as the KL-divergence (Kullback & Leibler, 1951; Kullback, 1959) can be used for measuring the distance between distributions. For two discrete probability distributions P and Q, the KL divergence expectation is defined as:
and which represents the expectation of the logarithmic difference between probabilities P and Q. Note that the KL divergence is non-symmetric and hence, the divergence expectation as defined above is based on probabilities P; i.e. the divergence from P to Q is not equivalent to the divergence of Q to P. For continuous distributions P and Q the divergence score is (Bishop, 2006):
where p and q are the densities of P and Q.
For example, from Figure 8, the KL divergence expectations between the Prior distribution and the Negative and Positive distributions are KL(Prior‖Negative) = 1.3 and KL(Prior‖Positive) = 9.22 respectively, and under the assumption that they fit a Normal distribution. On the other hand, KL(Prior‖Negative) = 23.58 from Figure 9.
The divergence expectation is highly sensitive to variance and distributional assumptions and hence, the ‘acceptable threshold’ for divergence between distributions should be agreed in advance and may well be dependent on the type of information the expert variable represents. In the case whereby the distance between the distributions is assessed as being unrealistic, then the method has also helped in identifying expert judgments that are either erroneous or biased. It is advisable that, under such circumstances, the expert judgments are revised in terms of impact. If the initial judgments are erroneous, then the same expert should be able to reassess them and provide improved estimates. If subsequent estimates do not improve, it might be the case that the judgments are based on biased beliefs, and it would be reasonable to seek judgments from additional expert/s. Eventually, all of the expert weighted distributions should have an acceptable distance from the overall prior data distribution. In a recent study where we have applied the method (see Section 8), we considered divergence threshold 10 as the point by which we seek to reassess the expert judgments incorporated, and which influence the shape of the particular distribution.
Note that what has been discussed in this subsection is trivial for states of X which are not captured by data, either because they represent extremely rare and/or previously unobserved events. This scenario is discussed in Section 6.
6. Application to Problems with Rare And/Or Previously Unobserved Events
In this section we discuss an entirely different concept in terms of how the method can be used. This involves the common problem whereby the application domain incorporates events that are extremely rare and/or previously unseen. Under such a scenario, even ‘big data’ may be insufficient to approximate the impact of these kinds of events, and which are typically overlooked. We demonstrate how the method can be exploited to provide improved assessments of uncertainty under circumstances of such events not captured by data.
Suppose the expert node X now includes states u1, …, uk, (where k ≥ 1) that have never (or only extremely rarely) been observed. In this case the problem is that, instead of having to preserve the expected value such that:
we only have to ensure that:
So Equation 5 needs only to preserve the data-driven network in model M′ under the states of X for which the expert assumes that they are indirectly captured by data and hence, ignore any u1, …, uk. This implies that the states u1, …, uk of X, which are assumed not to have been captured by data, will now have added impact on R.
Suppose, for example, that Peter lives in a country within the Eurozone and fears that a possible Grexit5 will have a significant impact on his investment. He would like to incorporate this possibility into his calculations. However, he acknowledges that Grexit represents a previously unobserved event and hence, there is no relevant historical data available for him to consider for analysis in terms of its impact on his investments.
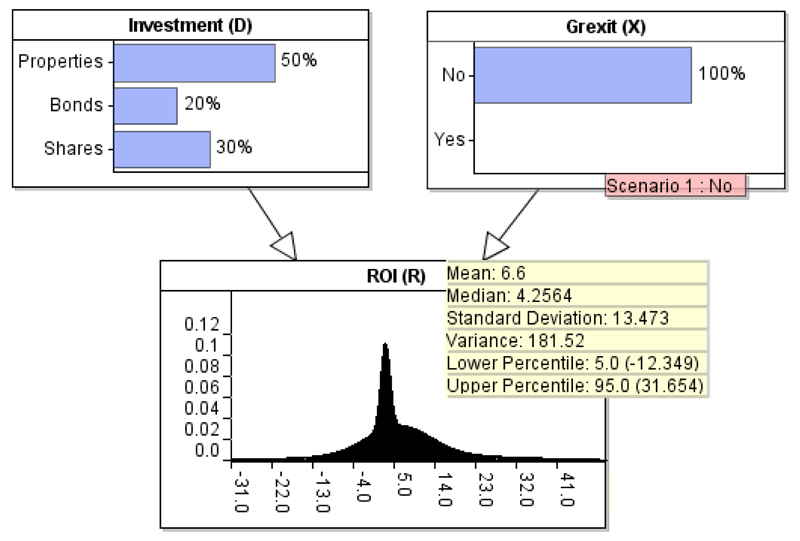
However, by knowing that Grexit represents a previously unseen event, Peter realises this implies that the historical records of ROI assume Grexit=No. He models the expert knowledge for node Grexit, making sure that the data-driven expectations of the model are preserved when Grexit=No, as shown in Figure 10 and Table 7.
Figure 10.
Replacing the expert node of Figure 6 with the expert node Grexit, which represents a previously unobserved event. The model preserves the data-driven expectations when the previously unobserved event is set to No (i.e. Grexit=No).
Table 7.
The CPT for node ROI given Grexit=No, and based on the model presented in Figure 10.
| D | Properties | Bonds | Shares |
|---|---|---|---|
| X | No | No | No |
| R | N (6, 50) | N (3, 1) | N (10, 500) |
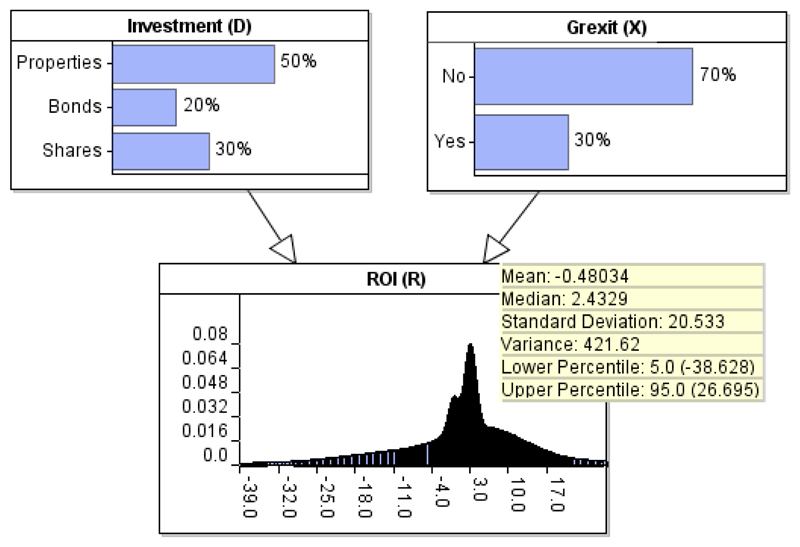
Peter now has to incorporate into the model the impact on ROI under Grexit=Yes. He updates the CPT for node ROI given Grexit=Yes according to his beliefs, as shown in Table 8. The CPT of Table 8 shows that, in addition to providing a revised expected value for each of the possible investment scenarios under Grexit=Yes, Peter also assumes that his estimates are highly uncertain and hence, the values provided for each σ2 are increased according to his lack of confidence. Figure 11 demonstrates the impact Grexit is expected to have on Profit, when Grexit is unknown, and as defined by Peter’s assumptions. The prior expectation of ROI declines from 6.6% to −0.48%. Therefore, the method provides decision makers with the ability to better manage and assess the impact of rare or previously unseen events which are not captured by data.
Figure 11.
The expectations of the model of Figure 10 when the observation of Grexit=No is removed.
7. Limitations and Possible Extensions
In the previous sections we have described the method as well as demonstrated how to apply it. We have also illustrated a number of scenarios under which the method provides additional benefits that go beyond the preservation of expected values. In this section we discuss a number of limitations which arise under specific circumstances, as well as possible extensions for future research.
Expert judgments for the CPTs: The method we have described defines the constraints required for the CPT entries. If, for any given state of the node D and state of the node X, the expert is able to supply all of the entries of the CPT then the method provides a consistency check for the expert values. If the expert can supply all but one of the values then Equation 5 provides a unique solution for the missing entry. However, when there is more than one missing entry the solution to Equation 4 is not unique.
Discrete nodes: The method assumed the empirical data node R is continuous. The method is applicable to discrete nodes, but there is a limitation in this case. Since the expected values at each discrete state represent probabilities rather than utility values (as in the case of continuous nodes like ROI), the expert elicited entries have to satisfy not only the constraint of Equation 4 but the additional constraints that each must lie within the boundary [0,1]. This means, for example, that we cannot assume that the method will provide the ‘missing value’ once the expert supplies all but one of the expert CPT entries, since these may be inconsistent with all the constraints.
-
Ranked nodes: In describing the method in Section 2, we have shown how the solution works when the expert provides judgments for states up to and excluding Xm of the required m values for each set of states in R given Di. However, when the expert node follows a ranked/ordinal distribution (e.g. from Very low to Very high (Fenton et al., 2007)) there is a risk that the learnt value Xm will fail to respect the ordinal nature of the ranked distribution, in terms of impact on R, depending on what judgments the expert provides for Xm−1 states.
As in the general discrete case this is not strictly a limitation of the method. When this occurs, it may simply imply that the expert judgments are inadequate in terms of accuracy. We would advise that decision makers be mindful of this possibility and, when it occurs, they should revise their judgments to respect the ordinal nature from X1 to Xm in terms of impact on R.
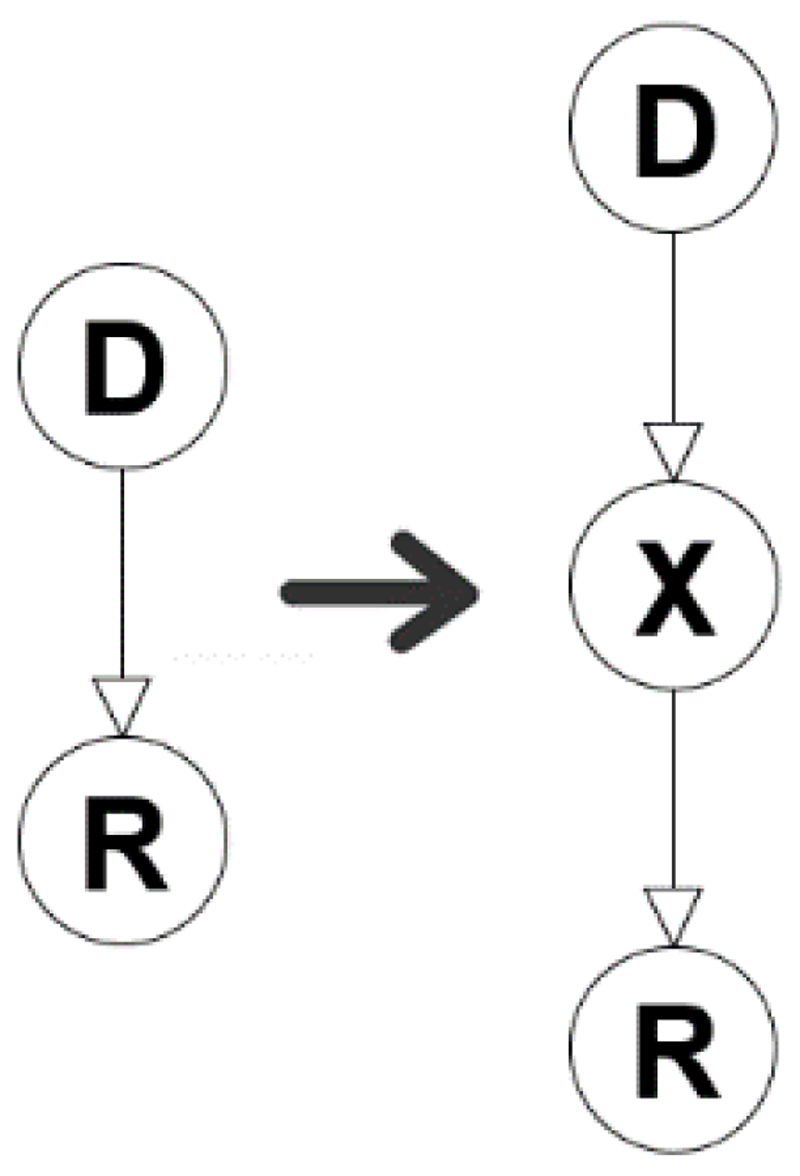
Amending the BN structure: The type of models we are interested in this paper are those where the supplementary expert variable is a concomitant cause. In other cases, however, an expert variable that is inserted into a model will amend the data-driven structure. Figure 12 demonstrates such a simple example where the expert variable X is inserted between the data variables D and R. Under such scenarios, the method presented in this paper is not supposed to be applicable since the data-driven network is amended and hence, there is no data-driven network to preserve. However, in large scale BN models some data-driven model fragments might remain unaffected and hence, the method can still be applied to those fragments.
-
Preserving Variability: While the expectations of the empirical data node are preserved6 using the method we have described, the variance and/or the shape of the revised data node distribution are subject to amendments as discussed in Section 5.
Without detailed data on the factors that the expert might identify as missing, it is not possible to know whether model uncertainty is supposed to increase or decrease. Since the model’s dimensionality is increased, one could argue that model uncertainty increases with it. However, in some cases there could be an argument against increasing the variance. As a result, such undesirable effects will have to be managed subjectively.
We explained in Section 2 why there is no incentive in preserving the variance of the data variables between models M and M’. However, in Section 5, we have proposed ways towards ensuring that the variability between distributions of the same data variable are reasonably correlated. In general, this is a problem that poses major challenges for future research.
Figure 12.
The case where the expert variable X is incorporated into the data-driven model in a way that amends the data-driven structure.
8. Applying the Method to Real-World Models
In this section we aim to clarify under what scenarios the method presented in this paper becomes useful for real-world BN models.
8.1. Scalability of the method
There are a number of factors which determine the scalability of the method. Specifically :
Type of the model: Since the method is proposed for the purpose of preserving some features of a data-driven model when incorporating expert judgments, this implies that the method is useful only for models which incorporate both data and expert information. This method is not relevant for models that only rely on one of the two types of information; data or expert knowledge.
Size of the model: The method is independent of the size of the model. What is important is how the expert variable is introduced within the network. Linking an expert variable with three data-driven variables in a network consisting of just three variables represents a more challenging task than linking an expert variable with two data-driven variables in a network consisting of thousands of variables. The same applies to the number of expert variables introduced; incorporating n expert variables in a simple network is more complex than incorporating n − 1 variables in a large-scale network, under the assumption that the variables are incorporated in the same way.
Number of child nodes: The expert variable can influence any number of child nodes. In the case where the expert variable does not have any child nodes (i.e. only has parent nodes), then there is no need to make use of the method presented in this paper. This is because such a BN model already preserves its data-driven expectations, as long as the expert variable remains unobserved. The method becomes useful as long as the expert variable introduced is linked to at least one data-driven child node.
Number of parent nodes: Any number of data-variables can serve as parent nodes of the expert variable. Without parent nodes, the solution is simplified as demonstrated in Section 4.1. With n parent nodes, we must account for the posterior marginal probabilities of the expert variable given all of the parent nodes, as demonstrated in Section 4.2.
Number of states: The solution works for any number of states incorporated into the expert variable.
Type of nodes: Some restrictions apply when it comes to the type of variables being used by the method. Specifically, while any parent and child nodes of the expert variable can be represented by either a continuous or a discrete distribution, the expert variable itself must be discrete (so that one of its states can serve as state m to solve for preservation of the expected value of the child node).
8.2. Practicality of the method
The process can also be automated using equation 5. But this requires a number of expert inputs. Assuming that the data-driven network is already learnt, the process of incorporating an expert variable is as follows:
Incorporate the expert variable and link it to the child and (optional) parent nodes;
Parameterise the CPT of the expert node with expert judgments;
Parameterise the CPT of each child node with expert judgments for states up to m − 1 (i.e. entry m stays empty);
Use equation 5 to learn the probabilities or utility values/distributions for each state m of the data-driven variables serving as child nodes of the expert variable. The model should now preserve the expected values of the data-driven variables.
8.3. Real-world examples
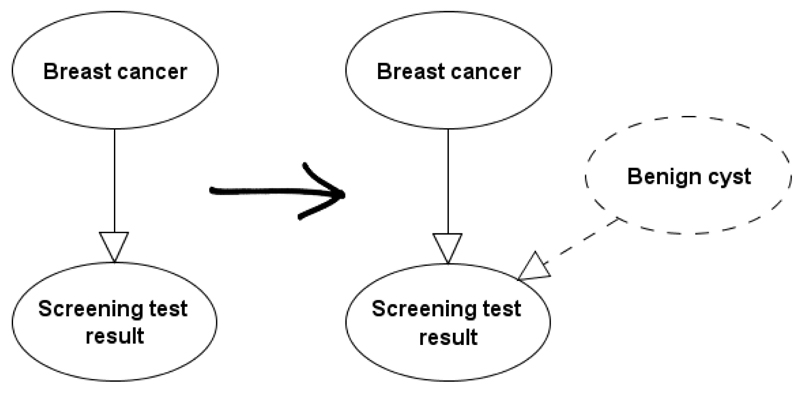
The proposed method is especially useful for adding explanatory power to medical diagnostic models, such as those that incorporate a diagnostic test result. For example, extensive data are available on mammographic screening test results given the presence of breast cancer (Hofvind et al., 2012). But, as in the ROI example of Section 2, these data hide influential factors which can be exploited by expert knowledge, such as the impact of benign cysts driving up the false positive rate (see Figure 13).
Figure 13.
Adding expert knowledge Benign cyst to breast screening, while preserving data expectations.
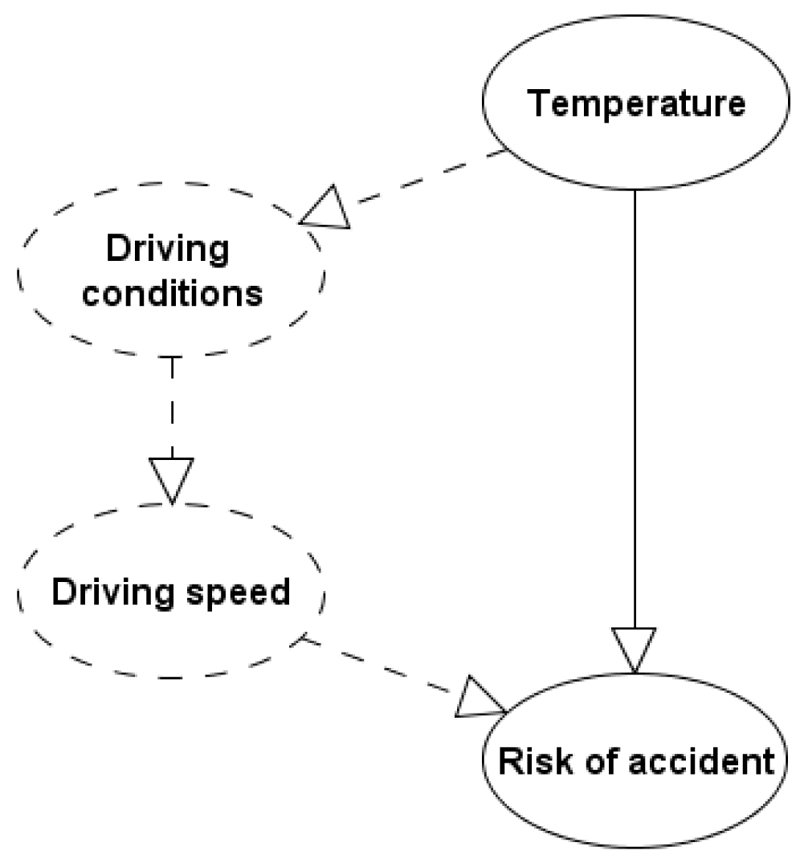
Another typical real-world example where the method is useful is that in (Fenton & Neil, 2012) where the authors consider data from the US department of transport, that shows (counter-intuitively) that fatalities in car accidents is strongly negatively correlated with temperatures. The authors recognise that, in the absence of relevant explanatory variables, we run the risk of having models proposing it is safer to drive during the winter when the weather is worst. Incorporating the expert variables proposed in (Fenton & Neil, 2012), in conjunction with the method presented in this paper, we can preserve the expectation relating to the risk of an accident and at the same time explain the observations based on additional expert explanatory variables such as Driving conditions and Driving speed as illustrated in Figure 14.
Figure 14.
Adding expert knowledge Driving conditions and Driving speed to the fatal car crashes problem (Fenton & Neil, 2012), while preserving data expectations.
8.3.1. Applying the method to another study
We have already made use of the method in a real-world setting. This involves a dynamic time-series BN model used to assess football teams in terms of fluctuations in team strength (Constantinou & Fenton, 2016). The assessment is based on events that occur between seasons (e.g. player transfers) as well as events that occur during the season (e.g. injuries) and which may influence the actual strength of the team. The whole model consists of 34 variables, both discrete and continuous.
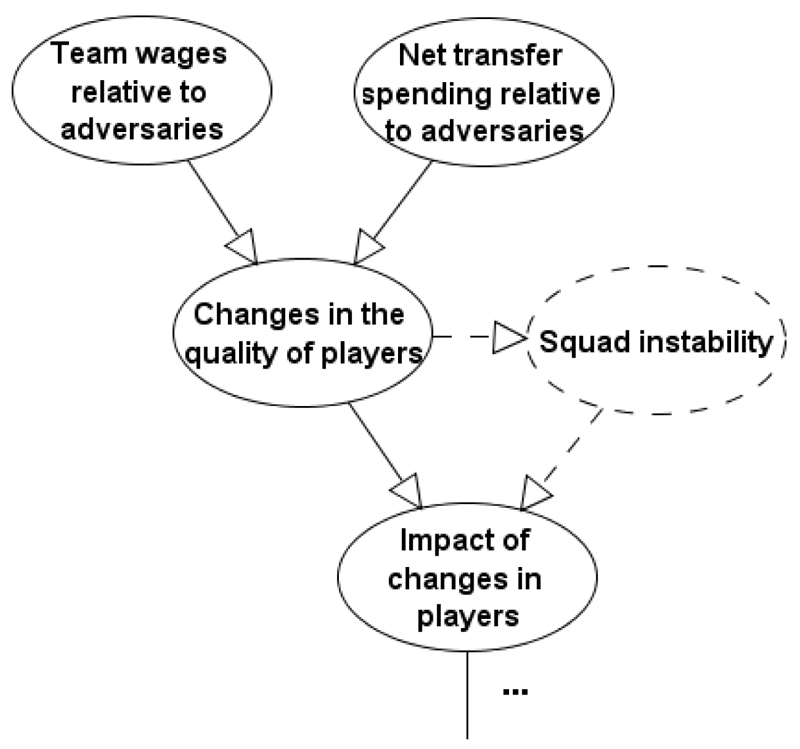
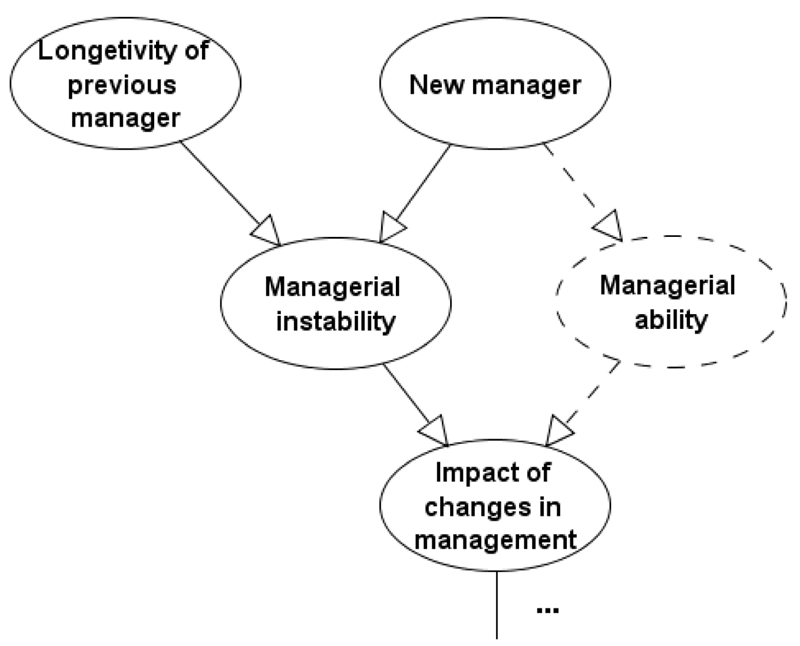
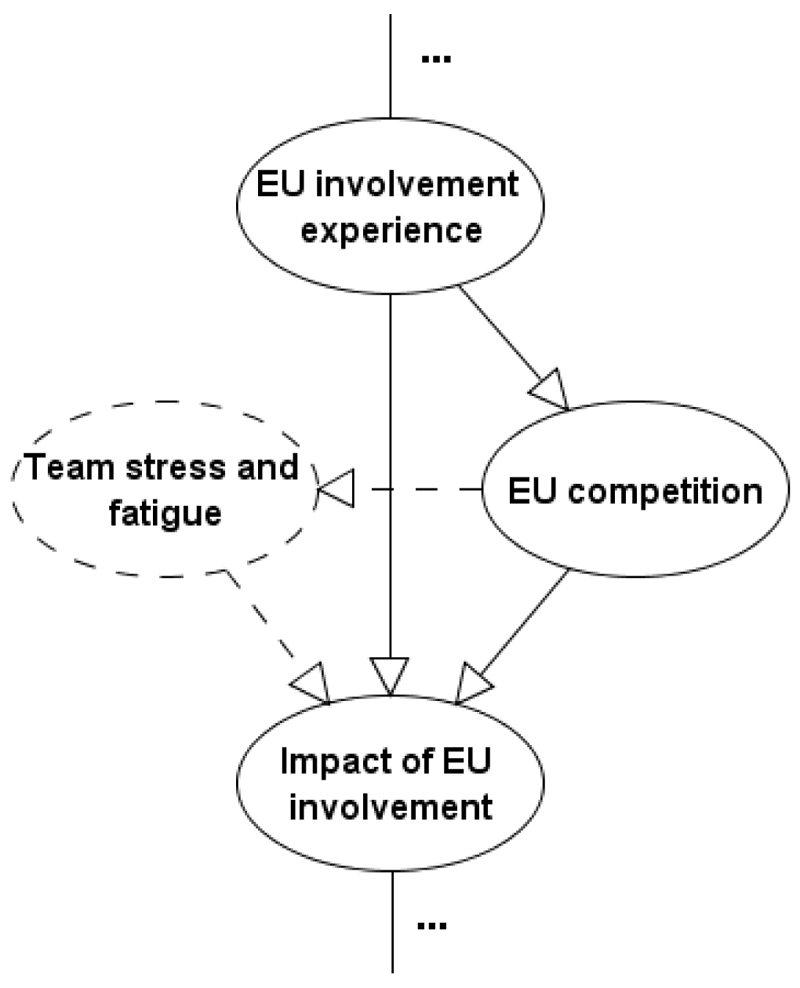
Figures 15, 16, and 17 present fragments of this real-world BN which incorporate expert variables. The expert variables, along with arcs introduced as a result of the expert variables, are indicated by dashed lines. All of the expert variables have been incorporated following the method presented in this paper, hence preserving the expected values of the data-variables, as long as the expert variables remain unobserved. In brief,
Squad instability: Figure 15 illustrates the process by which the impact of changes in players is measured. Historical data indicates that increasing net transfer spending and increasing team wages (higher relative to other teams) generally result in improved team strength. However, sometimes the scale of such changes in a short period of time results in instability within the team and reduced team performance immediately after the changes occur. This scenario is not captured by available data, hence the incorporation of Squad instability as demonstrated in Figure 15.
Managerial ability: Figure 16 illustrates the process by which the impact of changes in management is measured. In this case, we were able to assess managerial instability from data. However, the data fails to capture whether the arriving manager is superior or inferior to the departing manager, in terms of managerial skills. As a result, the expert variable Managerial ability is incorporated, to deal with this important missing factor subjectively, as illustrated in Figure 16.
Team stress and fatigue: Figure 17 illustrates the process by which the model assesses the impact of European (EU) match involvement has on team performance in the league. While historical data indicates that, overall, involvement in EU competitions negatively influences league performance, this is not true for all of the teams (especially for the high performing teams). One hypothesis is that teams experience the effect of EU competition with different levels of stress and fatigue, and this may also depend on the type of EU competition (e.g. some teams send their reserves to travel around Europe when participating in the Europa league). Figure 17 illustrates how this hypothesis is captured subjectively by incorporating the expert variable Team stress and fatigue.
Figure 15.
The BN fragment which incorporates the expert variable Squad instability (Constantinou & Fenton, 2016).
Figure 16.
The BN fragment which incorporates the expert variable Managerial ability (Constantinou & Fenton, 2016).
Figure 17.
The BN fragment which incorporates the expert variable Team stress and fatigue (Constantinou & Fenton, 2016).
The expert explanatory variables incorporated into the BN of (Constantinou & Fenton, 2006), and which are based on the method presented in this paper, form part of the Smart-Data method which seeks to improve predictive accuracy and resulting decision making that goes beyond the capabilities of what Big-Data can provide. This is achieved using BN models that have two subsystems: a) a knowledge-based intervention for informing the model about real-world time-series facts, and b) a knowledge-based intervention for data-management purposes to ensure data adheres to the structure of the model.
9. Concluding Remarks
We have described a method that allows us to incorporate expert variables in a data-driven Bayesian network without affecting the model’s expectations, as generated from data, as long as the expert variables remain unobserved. The method assumes that:
the data variables are based on sufficiently rich and accurate data and thus represent a good approximation of the true distribution (hence, the desire to preserve the expectations);
the expert variables are factors that are important for decision analysis but which historical data fails to capture (hence, the desire to incorporate these variables into the model as supplementary expert judgments, but which will not affect the model as long as they remain unobserved).
In addition to meeting this main objective we have demonstrated that the benefits of the method extend to answering questions about accuracy of expertise and how the assessment of extremely rare or previously unobserved events can be addressed:
-
a)
Realism of expert judgments: We have shown the method can be used along with variability to validate the expert judgments in terms or ‘realism’. More specifically, to assess whether the expert judgments provided for newly incorporated states within the model satisfactorily fall within reasonable boundaries as defined by the variability in the data driven model. Section 5 demonstrates this case with examples.
-
b)
Handling rare or previously unobserved events: The method allows for better management of problems for which big-data is available, but which still fails to capture rare or previously unseen events. Under such circumstances, this is achieved by preserving the data-driven expectations of the model under the assumption that these known rare or unobserved events are set to false within the model. Section 6 demonstrates this case with examples.
It is important to note that the method is not proposed as a solution to any probabilistic network which incorporates expert knowledge along with data. Namely, if a data variable is believed not to capture the true distribution with sufficiently high accuracy, either because of limited or poor-quality data, then there is no incentive to use this method and preserve its expectations. Nevertheless, while the method might not be useful for every single data variable, it will still be useful for every single model that incorporates at least one data variable for which decision makers would like to preserve its expectations.
Acknowledgements
We acknowledge the financial support by the European Research Council (ERC) for funding this research project, ERC-2013-AdG339182-BAYES_KNOWLEDGE, and Agena Ltd for software support.
Appendix A: The problem with preserving the variance of a data-driven distribution.
Figure A.1.
The outputs of the data-driven BNs (Models A and B left and right respectively) based on the data presented in Table A.1.
Table A.1.
The data considered by the BNs presented in Figure A.1
| Model A | Model B | ||
|---|---|---|---|
| a | a|b1 | a|b2 | |
| 3 | 3 | 12 | |
| 4 | 4 | 13 | |
| 5 | 5 | 10 | |
| 2 | 2 | 9 | |
| 5 | 5 | 8 | |
| 4 | 4 | 15 | |
| 12 | - | ||
| 13 | - | ||
| 10 | - | ||
| 9 | - | ||
| 8 | - | ||
| 15 | - | ||
| Mean | 7.5 | 3.83 | 11.17 |
| Variance | 18.45 | 1.37 | 6.97 |
Footnotes
Is known in the sense of being based on reliable relevant data.
The expected value of R when D is unobserved.
The model is run here in AgenaRisk which handles continuous nodes efficiently and accurately using the dynamic discretisation algorithm (Neil et al., 2007). The fully functional free version of AgenaRisk can be downloaded from agenarisk.com
It is crucial to note that the expert node is Tax allowances claimed and not Tax allowances. The former is something that the investor decides on and is influenced by the investment type (as well as other factors but which are not included for simplicity). On the other hand, Tax allowances influence Investment. If, for example, there are much more generous tax allowances for property investments then people are much more likely to invest in properties.
The withdrawal of Greece from Eurozone.
Note that the expected values are preserved however the variance is defined.
References
- Andreassen S, Riekehr C, Kristensen B, Schønheyder HC, Leibovici L. Using probabilistic and decision theoretic methods in treatment and prognosis modelling. Artificial Intelligence in Medicine. 1999;15:121–34. doi: 10.1016/s0933-3657(98)00048-7. [DOI] [PubMed] [Google Scholar]
- Bergus GR, Chapman GB, Gjerde C, Elstein AS. Clinical reasoning about new symptoms despite pre-existing disease: sources of error and order effects. Family Medicine Journal. 1995;27:314–320. [PubMed] [Google Scholar]
- Bishop C. Pattern Recognition and Machine Learning. Springer; 2006. [Google Scholar]
- Chaloner K. Elicitation of prior distributions. In: Berry DA, Stangl DK, editors. Bayesian biostatistics. New York: Marcel Dekker Inc; 1996. pp. 141–156. [Google Scholar]
- Constantinou AC, Fenton Norman E, Neil M. pi-football: A Bayesian network model for forecasting Association Football match outcomes. Knowledge-Based Systems. 2012;36:322–339. [Google Scholar]
- Constantinou AC, Fenton Norman E, Neil Martin. Profiting from an inefficient Association Football gambling market: Prediction, Risk and Uncertainty using Bayesian networks. Knowledge-Based Systems. 2013;50:60–86. [Google Scholar]
- Constantinou A, Yet B, Fenton N, Neil M, Marsh W. Value of Information Analysis for Interventional and Counterfactual Bayesian networks in Forensic Medical Sciences. To appear in Artificial Intelligence in Medicine. 2015a doi: 10.1016/j.artmed.2015.09.002. [DOI] [PubMed] [Google Scholar]
- Constantinou AC, Freestone M, Marsh W, Fenton N, Coid JW. Risk assessment and risk management of violent reoffending among prisoners. Expert Systems with Applications. 2015b;42(21):7511–7529. [Google Scholar]
- Constantinou A, Fenton N. Improving predictive accuracy using Smart-Data rather than Big-Data: A case study of football teams’ evolving performance. Under review. 2016 [Google Scholar]
- de Campos C, Ji C. Efficient structure learning of Bayesian networks using constraints. Journal of Machine Learning Research. 2011;12:663–689. [Google Scholar]
- Druzdzel MJ, van der Gaag LC. Elicitation of probabilities for belief networks: Combining qualitative and quantitative information. Proceedings of the Eleventh conference on Uncertainty in Artificial Intelligence. 1995:141–148. [Google Scholar]
- Enders CK. A primer on the use of modern missing-data methods in psychosomatic medicine research. Psychosomatic Medicine. 2006;68:427–36. doi: 10.1097/01.psy.0000221275.75056.d8. [DOI] [PubMed] [Google Scholar]
- Evans JS, Brooks P, Pollard P. Prior beliefs and statistical inference. British Journal of Psychiatry. 1985;76:469–477. [Google Scholar]
- Evans JS, Handley SJ, Over DE, Perham N. Background beliefs in Bayesian inference. Memory & Cognition. 2002;30:179–190. doi: 10.3758/bf03195279. [DOI] [PubMed] [Google Scholar]
- Fenton N, Neil M. Risk assessment and decision analysis with Bayesian networks. CRC Press; London: 2012. [Google Scholar]
- Fenton N, Neil M, Caballero JG. Using Ranked nodes to model qualitative judgments in Bayesian Networks. IEEE Transactions on Knowledge and Data Engineering. 2007;19(10):1420–1432. [Google Scholar]
- Friedman N, Geiger D, Goldszmidt M. Bayesian Network Classifiers. Machine Learning. 1997;29(2-3):131–163. [Google Scholar]
- Friedman N, Linial M, Nachman I, Pe'er D. Using Bayesian Networks to Analyze Expression Data. Journal of Computational Biology. 2000;7(3-4):601–620. doi: 10.1089/106652700750050961. [DOI] [PubMed] [Google Scholar]
- Gigerenzer G, Hoffrage U. How to improve Bayesian reasoning without instruction: Frequency formats. Psychological Review. 1995;102:684–704. [Google Scholar]
- Hofvind S, Ponti A, Patnick J, Ascunce N, Njor S, et al. False-positive results in mammographic screening for breast cancer in Europe: a literature review and servey of service screening programmes. Journal of Medical Screening. 2012;19:57–66. doi: 10.1258/jms.2012.012083. [DOI] [PubMed] [Google Scholar]
- Hughes MD. Practical reporting of Bayesian analyses of clinical trials. Drug Inf J. 1991;25:381–393. [Google Scholar]
- Jaakkola T, Sontag D, Globerson A, Meila M. Learning Bayesian Network Structure using LP Relaxations. In Proceedings of the 13th International Conference on Artificial Intelligence and Statistics, AISTATS’10. 2010:358–365. [Google Scholar]
- Jamshidian M, Jennrich R. Acceleration of the EM Algorithm by using Quasi-Newton Methods. Journal of the Royal Statistical Society, Series B. 1997;59(2):569–587. [Google Scholar]
- Jiangtao Y, Yanfeng Z, Lixin G. Accelerating Expectation- Maximization Algorithms with Frequent Updates. Proceedings of the IEEE International Conference on Cluster Computing. 2012 [Google Scholar]
- Johnson SR, Tomlinson GA, Hawker GA, Granton JT, Feldman BM. Methods to elicit beliefs for Bayesian priors: a systematic review. Journal of Clinical Epidemiology. 2010a;63:355–369. doi: 10.1016/j.jclinepi.2009.06.003. [DOI] [PubMed] [Google Scholar]
- Johnson SR, Tomlinson GA, Hawker GA, Granton JT, Grosbein HA, Feldman BM. A valid and reliable belief elicitation method for Bayesian priors. Journal of Clinical Epidemiology. 2010b;63(4):370–383. doi: 10.1016/j.jclinepi.2009.08.005. [DOI] [PubMed] [Google Scholar]
- Jordan M. Learning in Graphical Models. Cambridge, MA: MIT Press; 1999. [Google Scholar]
- Heckerman DE, Horvitz EJ, Nathwani BN. Towards normative expert systems. I. The Pathfinder project. Methods of Information in Medicine. 1992a;31:90–105. [PubMed] [Google Scholar]
- Heckerman DE, Nathwani BN. Towards normative expert systems. II. Probability-based representations for efficient knowledge acquisition and inference. Methods of Information in Medicine. 1992b;31:106–16. [PubMed] [Google Scholar]
- Hogarth RM. Cognitive processes and the assessment of subjective probability distributions. Journal of the American Statistical Association. 1975;70:271–294. [Google Scholar]
- Hunter DR, Lange K. A Tutorial on MM Algorithms. The American Statistician. 2004;58:30–37. [Google Scholar]
- Kendrick M. Doctoring Data: How to sort out medical advice from medical nonsense. Columbus Publishing Ltd; 2015. [Google Scholar]
- Korb KB, Nicholson AE. Bayesian Artificial Intelligence (Second Edition) London: Chapman & Hall/CRC; 2011. [Google Scholar]
- Kuipers B, Moskowitz AJ, Kassirer JP. Critical decisions under uncertainty: Representation and structure. Cognitive Science. 1988;12:177–210. [Google Scholar]
- Kullback S, Leibler RA. On information and sufficiency. Annals of Mathematical Statistics. 1951;22(1):79–86. [Google Scholar]
- Kullback S. Information Theory and Statistics. John Wiley & Sons; New York: 1959. [Google Scholar]
- Lauritzen SL. The EM algorithm for graphical association models with missing data. Computational Statistics & Data Analysis. 1995;19:191–201. [Google Scholar]
- Li Y, Krantz DH. Experimental tests of subjective Bayesian methods. The Psychological Record. 2005;55:251–277. [Google Scholar]
- Lucas PJF, De Bruijn NC, Schurink K, Hoepelman IM. A probabilistic and decision-theoretic approach to the management of infectious disease at the ICU. Artificial Intelligence in Medicine. 2009;19(3):251–79. doi: 10.1016/s0933-3657(00)00048-8. [DOI] [PubMed] [Google Scholar]
- Matsuyama Y. The α-EM algorithm: Surrogate likelihood maximization using α-logarithmic information measures. IEEE Transactions on Information Theory. 2003;49(3):692–706. [Google Scholar]
- Murphy AH, Winkler RL. Reliability of subjective probability forecasts of precipitation and temperature. Journal of Applied Statistics. 1977;26:41–47. [Google Scholar]
- Nassif H, Wu Y, Page D, Burnside E. Logical Differential Prediction Bayes Net, Improving Breast Cancer Diagnosis for Older Women. American Medical Informatics Association Symposium (AMIA’12); Chicago. 2012. pp. 1330–1339. [PMC free article] [PubMed] [Google Scholar]
- Nassif H, Kuusisto F, Burnside ES, Page D, Shavlik J, Santos Costa V. Score As You Lift (SAYL): A Statistical Relational Learning Approach to Uplift Modeling. European Conference on Machine Learning (ECML’13); Prague: 2013. pp. 595–611. [DOI] [PMC free article] [PubMed] [Google Scholar]
- Neil M, Tailor M, Marquez D. Inference in hybrid Bayesian networks using dynamic discretization. Stat Comput. 2007;17(3):219–33. [Google Scholar]
- Normand SL, Frank RG, McGuire TG. Using elicitation techniques to estimate the value of ambulatory treatments for major depression. Medical Decision Making. 2002;22:245–261. doi: 10.1177/0272989X0202200313. [DOI] [PubMed] [Google Scholar]
- O’Hagan A. Eliciting expert beliefs in substantial practical application. Statistician. 1998;47:21–35. [Google Scholar]
- O’Hagan A, Buck CE, Daneshkhah A, Eiser JR, Garthwaite PH, Jenkinson DJ, Oakley JE, Rakow T. Uncertain Judgments: Eliciting Experts’ Probabilities. England: John Wiley & Sons; 2006. [Google Scholar]
- Pearl J. Causality: Models, Reasoning and Inference. 2nd edition. Cambridge University Press; 2009. [Google Scholar]
- Petitjean F, Webb GI, Nicholson AE. Scaling log-linear analysis to high-dimensional data. International Conference on Data Mining; Dallas, TX, USA: IEEE; 2013. [Google Scholar]
- Rebonato R. Coherent Stress Testing: A Bayesian Approach to the Analysis of Financial Stress. John Wiley and Sons; UK: 2010. [Google Scholar]
- Renooij S. Probability elicitation for belief networks: issues to consider. Knowledge Engineering Review. 2001;16(3):255–69. [Google Scholar]
- Spiegelhalter DJ, Abrams KR, Myles JP. Bayesian Approaches to Clinical Trials and Health-care Evaluation. John Wiley and Sons; UK: 2004. [Google Scholar]
- Spirtes P, Glymour C. An algorithm for fast recovery of sparse causal graphs. Social Science Computer Review. 1991;9(1):62–72. [Google Scholar]
- Spirtes P, Glymour C, Scheines R. Causation, Prediction, and Search. 1st ed. Springer-Verlag; 1993. ISBN 978-0-387-97979-3. [Google Scholar]
- Van der Fels-Klerx IH, Goossens LH, Saatkamp HW, Horst SH. Elicitation of quantitative data from a heterogeneous expert panel: formal process and application in animal health. Risk Analysis. 2002;22:67–81. doi: 10.1111/0272-4332.t01-1-00007. [DOI] [PubMed] [Google Scholar]
- van der Gaag LC, Renooij S, Witteman CLM, Aleman B, Taal BG. How to elicit many probabilities. Proceedings of the 15th International Conference on Uncertainty in Artificial Intelligence; San Francisco, CA: Morgan Kaufmann; 1999. pp. 647–54. [Google Scholar]
- van der Gaag LC, Renooij S, Witteman CL, Aleman BM, Taal BG. Probabilities for a probabilistic network: a case study in oesophageal cancer. Artificial Intelligence in Medicine. 2002;25:123–148. doi: 10.1016/s0933-3657(02)00012-x. [DOI] [PubMed] [Google Scholar]
- Verma T, Pearl J. Equivalence and synthesis of causal models. In: Bonissone P, Henrion M, Kanal LN, Lemmer JF, editors. UAI ‘90 Proceedings of the Sixth Annual Conference on Uncertainty in Artificial Intelligence. Elsevier; 1991. pp. 255–270. [Google Scholar]
- Wallsten TS, Budescu DV. Encoding subjective probabilities: a psychological and psychometric review. Management Science. 1983;29:151–173. [Google Scholar]
- White IR, Pocock SJ, Wang D. Eliciting and using expert opinions about influence of patient characteristics on treatment effects: a Bayesian analysis of the CHARM trials. Statistics in Medicine. 2005;24:3805–3821. doi: 10.1002/sim.2420. [DOI] [PubMed] [Google Scholar]
- Yet B, Bastani K, Raharjo H, Lifvergren S, Marsh DWR, Bergman B. Decision Support System for Warfarin Therapy Management using Bayesian Networks. Decision Support Systems. 2013;55(2):488–498. [Google Scholar]
- Yet B, Constantinou AC, Fenton N, Neil M, Luedeling E, Shepherd K. Project Cost, Benefit and Risk Analysis using Bayesian Networks. 2015 Under review. [Google Scholar]
- Zhou Y, Fenton N, Neil M. Bayesian network approach to multinomial parameter learning using data and expert judgments. International Journal of Approximate Reasoning. 2014a;55(5):1252–1268. [Google Scholar]
- Zhou Y, Fenton NE, Neil M. An Extended MPL-C Model for Bayesian Network Parameter Learning with Exterior Constraints. In: van der Gaag L, Feelders AJ, editors. Probabilistic Graphical Models: 7th European Workshop. PGM 2014; September 17-19, 2014; Utrecht. The Netherlands: 2014b. pp. 581–596. Springer Lecture Notes in AI 8754. [Google Scholar]


