Abstract
Studies of nematode assemblages in natural ecosystems can contribute to better understanding of the occurrence, relevance, and ecology of plant-parasitic and other soil nematodes. Nematode assemblages and environmental parameters (organic matter, water content (WC), bulk density (BD), total porosity (Po), soil respiration, and soil texture) were investigated in two seasons (rainy and dry) in two forest areas of the Zona da Mata, Pernambuco State. The aim of our research was to evaluate the heterogeneity between two locations and seasons in the Brazilian Atlantic Forest. Structure and composition of the nematode assemblages differed between areas and across time. Rhabditidae dominated the rainy season in both forest soils. Rarefaction curves (RC) suggest that sampling to detect more nematode taxa should be more intensive in the rainy season. The forest soils have complex, stable soil food webs with high connectance and decomposition channels dominated by bacteria. The predator–prey relationships were not affected by changes in soil properties that fluctuate with time.
Keywords: ecological indices, ecology, metabolic footprints, predator–prey interactions, soil physical properties
Nematodes are particularly important in soil ecosystem functions, playing key roles through decomposition and nutrient mineralization processes (Bongers and Ferris, 1999; Ferris, 2010b). In contrast, ecological investigations have particularly neglected the whole nematode assemblages, focusing primarily on plant-parasitic nematodes, their distribution, abundance, intrinsic properties, and interactions with biotic and abiotic factors (Neher, 2010). Therefore, it is essential to understand the patterns and drivers that govern the abundance and diversity of nematodes in natural soils.
The dynamics of tropical rainforest are influenced by both abiotic and biotic factors (e.g., climate and interactions between soil organisms). Tropical forests contain many smaller life forms, including nematodes, which have an important role in forest dynamics (Stork, 1996). In this context, the tropical rainforest of the Atlantic coast of Brazil is known for its diverse biota and is considered to be one of the world’s biological diversity hotspots (Myers et al., 2000; Mittermeier et al., 2011). In spite of this diversity, the nematode fauna from tropical rainforests is still little studied (Powers et al., 2009; Porazinska et al., 2012).
Soil properties influence biological activity and play a critical role in the functioning of soil food webs (Jordan et al., 2003). However, their specific effects on functioning and nematode diversity remain relevant questions. In this study, soil properties including organic matter, WC, BD, Po, soil respiration (C-CO2 evolution rate), and soil texture were selected to infer soil functioning and to relate it to soil nematode diversity.
The soil food web indices, based on the abundances of nematode functional guilds (colonizer-persister [c-p] scale integrating with food sources), have been utilized to examine the effect of pollution, management, and vegetation on agroecosystems (Liang et al., 2005; Stirling and Lodge, 2005; Culman et al., 2010). Thus, in this survey, faunal and metabolic footprint analyses were used to profile the soil condition in the studied forest areas based on soil nematodes. In addition, predator–prey interactions were also investigated, since understanding of these relationships can be explored more thoroughly in undisturbed systems.
We hypothesized that (i) nematode taxa have distribution characteristics that are influenced by season and soil attributes; (ii) forest soils have food webs with high structure and low enrichment, and are conducive to fungal decomposition; and (iii) low prey abundance relates to high predator abundance. Thus, this study aimed to evaluate the heterogeneity between two locations and seasons in the Brazilian Atlantic Forest.
Materials and Methods
Study sites:
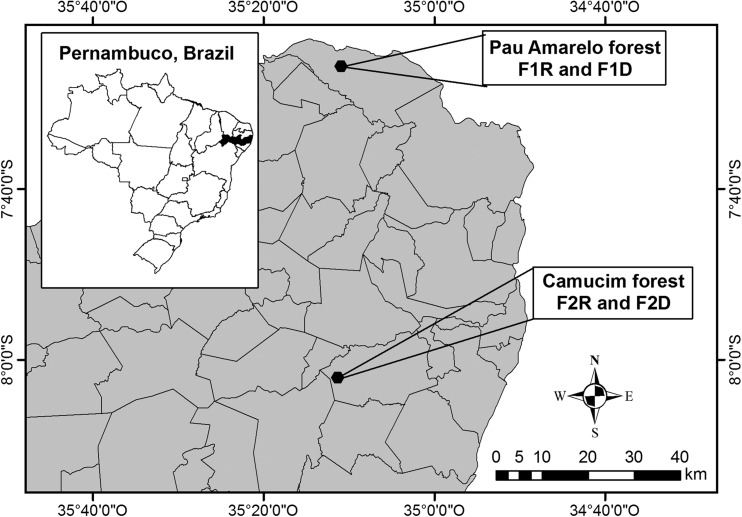
This research was carried out in two forest areas (Pau Amarelo and Camucim), located in Zona da Mata Norte, Pernambuco State, Brazil (Fig. 1). Soil samples were collected in 2012 in the rainy and dry seasons. In Pau Amarelo forest, the rainy and dry seasons were designated as F1R and F1D, respectively. Similarly, in Camucim forest, the rainy and dry seasons were designated as F2R and F2D, respectively. The local climate is “As,” according to the Köppen Climate Classification, and is characterized by winter rainfall and dry summers. As climate is coastal and has a strong rainfall gradient (east to west), from 1,500 to 700 mm, and average annual temperature ≥ 18°C (Alvares et al., 2013).
Fig. 1.
Map of study sites. F1R = Pau Amarelo forest in rainy season, F1D = Pau Amarelo forest in dry season, F2R = Camucim in rainy season, F2D = Camucim in dry season.
Soil sampling:
Two transects were established in the form of a cross at each site. Each was 200 m long with sampling points spaced 10-m apart, so that there were 42 sampling points at each site. Soil samples were taken in dry and rainy seasons at 20 to 30 cm depth by a modified sampler for assessment of BD, WC, and soil respiration, and were stored in Parafilm-sealed plastic containers. Approximately 600 g of soil was taken for nematode, organic carbon, and texture analyses. The samples were packed in labeled plastic bags and immediately transported to the Phytonematology Laboratory, Agronomy Department, Federal Rural University of Pernambuco (UFRPE), kept at 6°C ± 2°C until nematode extraction.
Nematode extraction:
Nematodes were extracted by the sucrose centrifugation method (Jenkins, 1964). The suspensions were stored in a refrigerator for no more than 3 d before counting and identification. Nematodes were counted at ×20 magnification in two replicate aliquots on Peters glass counting slides (1 ml capacity). Temporary slides were prepared and all nematodes counted were identified to genus/family level at ×40 and ×100 magnification. Nematode abundance was expressed per 300 cm3 of soil.
Trophic and functional structure:
Nematodes were assigned to five trophic groups according to feeding habits (plant parasites, bacterivores, fungivores, predators, and omnivores) based on the morphology of the stoma and esophagus (Yeates et al., 1993). Although the trophic habits of the Tylenchidae are uncertain, all individuals in this family were considered plant parasitic. Members of the order Dorylaimida are commonly classified as omnivores, but in this study we also consider them to be generalist predators, whereas we consider Mononchida to be specialist predators. Plant-parasitic nematodes were identified to genus using keys and descriptions of Mai et al. (1996), and free-living nematodes to family level according to keys of Tarjan et al. (1977). Nematodes were classified into functional guilds based on feeding habits and the five c-p groups, which represent life history characteristics and sensitivity to environmental perturbation (Bongers, 1990; Bongers and Bongers, 1998). As a measure of environmental disturbance, the Maturity Index (MI) for free-living nematodes was calculated as the weighted mean of the individual c-p values (MI = Σvi × fi, where vi is the c-p value of i-taxon, and fi is the frequency of i-taxon). Colonizer-persister values ranging from one for colonizers (r-strategists) to five for persisters (K-strategists) are assigned to nematode families to illustrate their life strategies and, thus, the conditions of the surrounding environment. The equivalent of the MI for plant-parasitic nematodes (the Plant Parasite Index, PPI) and the combined free-living and plant-parasitic nematode index (ΣMI) were calculated (Bongers, 1990; Bongers and Ferris, 1999).
Environmental quality and soil food web structure:
Faunal profiles were constructed to indicate whether the nematode soil communities in forest areas are basal, enriched, or structured and stable. Indices of ecosystem condition, i.e., Enrichment Index (EI), Structure Index (SI), Basal Index (BI), and Channel Index (CI) were calculated following Ferris et al. (2001) : EI = 100e/(b + e), and SI = 100s/(b + s), where s = 1.8 × (Ba3 + Fu3 + OP3) + 3.2 × (Ba4 + Fu4 + OP4) + 5 × (Ba4 + Fu5 + OP5), b = 0.8 × (Ba2 + Fu2), and e = 3.2 × (Ba1) + 0.8 × (Fu2). The numbers from one to five represented the c-p value. To measure the magnitude of ecosystem functions and services provided by component organisms of the soil food web, the nematode metabolic footprint (NMF) was also calculated. NMF calculations are based on biomass and metabolic activity of components of the nematode assemblages calculated from published dimensions of each species and averaged across species for genera and families (Ferris, 2010a). The ecophysiological attributes of nematodes, assembled at species, genus, and family levels were obtained from Nemaplex (http://plpnemweb.ucdavis.edu/nemaplex/). The connectance among predators and their prey was calculated as the total sum of all possible interactions among them, assuming that all taxa in each channel may interact (in this case, any organism in the resource group may be eaten by any organism in the consumer group) (Sánchez-Moreno et al., 2011).
Soil respiration:
Microbial activity was estimated from soil respiration as indicated by the C-CO2 evolution rate (Grisi, 1978). Soil samples (100 g) and containers containing 10 ml 0.5 N KOH were placed into sealed glass chambers and incubated at 25°C ± 2°C for 15 d. The CO2 absorbed by the KOH was determined by titration with 0.1 N HCL, using phenolphthalein and methyl orange as indicators.
Soil chemical analysis:
Organic matter was determined indirectly by measuring organic carbon content, using the methodology of Yeomans and Bremner (1988), which is based on the oxidation of organic matter by potassium dichromate. Following oxidation, the residual potassium dichromate was titrated with ammonium ferrous sulfate solution, using ferroin as the indicator. This analysis was carried out at the Laboratory of Soil Chemistry, Department of Agronomy, UFRPE.
Soil physical analyses:
Soil physical analyses were performed at the Laboratory of Soil Mechanics and Waste Utilization, Department of Agricultural Engineering, UFRPE, using methods detailed in the work of Donagema et al. (2011). Soil texture was determined by the hydrometer method using 1 M Na-hexametaphosphate as the dispersant. Soil BD was determined for intact soil cores measuring 5 cm in diameter, 2.5 cm in length, and 50 cm3 in volume. To determine WC, soil samples were dried at 105°C to 110°C for 24 hr and weighed before and after to determine their weight loss. BD was estimated by dividing dry weight (DW) by core volume, i.e., BD = DW/50 cm3. Soil particle density (PD) was determined in a 50-ml volumetric flask using 20 g of air-dried soil and alcohol as fluid to determine the volume occupied by the particles (PD = 20 g/[50 ml −alcohol volume]). Total porosity was calculated from the values of PD and BD {Po = (1 − [BD/PD]) × 100}.
Statistical analyses of data:
Two-way analysis of variance (ANOVA) was applied to all datasets to assess the significance of differences between areas and sampling seasons. Tukey’s multiple comparison test was used when significant differences were detected (P < 0.05). Graphics with mean values and error bars were produced to visualize distribution of data in each area over time. Pearson’s correlation coefficients between soil attributes and nematode taxa were also determined. Classical statistical analyses and ANOVA were performed using Statistica 10 (StatSoft, 2010). RC were fitted with 95% confidence and 1,000 randomizations to determine the sampling intensity necessary to detect taxa richness in the studied forest areas. Mao Tau and the first-order jackknife, Jackknife Estimator 1 (SJack1), were chosen as estimators: Mao Tau is the species richness observed and SJack1 is a statistical technique for reducing the bias of an estimator by removing subsets of the data and recalculating the estimator with the reduced sample (Colwell, 2009). Rarefaction curves were determined using EstimateS version 8.2.0 (Colwell, 2009).
Differences in nematode community composition from forest soils in different seasons were analyzed by cluster, nonmetric multidimensional scaling (NMDS), and analysis of similarity (ANOSIM) based on the Dice–Sorensen distance measure. The “stress” value from NMDS should be small, at least less than 0.2 and ideally less than 0.1, showing that the reduction to two dimensions implies very little loss of information (Legendre and Legendre, 1998). The ANOSIM test has some similarity to an ANOVA-like hypothesis test; however, it is used to evaluate a dissimilarity matrix rather than raw data (Clarke, 1993). Together, the dimension reduction and visualization capacities of NMDS and the hypothesis testing offered by ANOSIM are complementary approaches in evaluating nonparametric multivariate data. Similarity percentage (SIMPER) analysis with a cutoff of 50% was performed to support ANOSIM, indicating which nematode taxa explain the differences between groups. Similarity percentage analysis is a method for assessing which taxa are primarily responsible for an observed difference between groups of samples (Clarke, 1993). The Bray-Curtis similarity measure (multiplied by 100) is most commonly used with SIMPER (Hammer et al., 2001). Cluster, NMDS, ANOSIM, and SIMPER analyses were performed using PAST version 3.10 (Hammer et al., 2001).
Results and Discussion
Structure and composition of nematode assemblages in rainy and dry seasons:
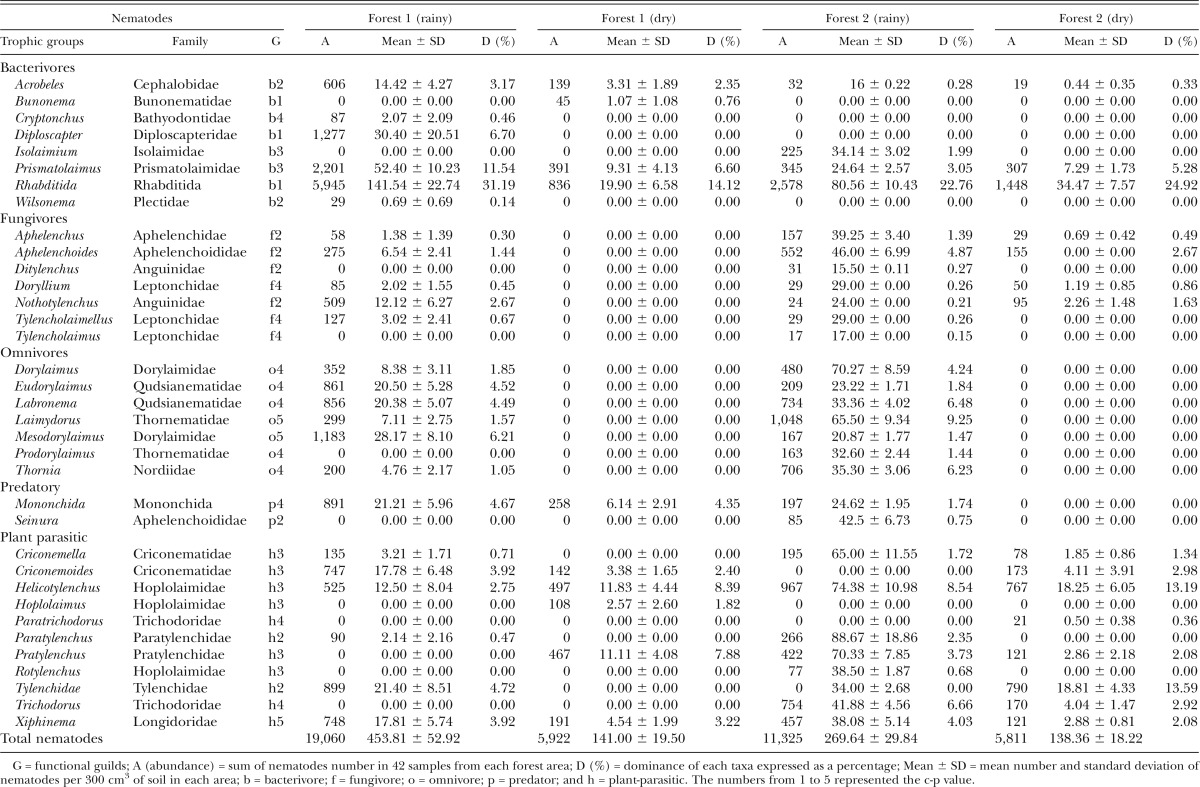
Thirty-five nematode taxa were identified; 24 were common to both areas (Table 1). Bunonema, Cryptonchus, Diploscapter, Wilsonema, and Hoplolaimus were detected only in site F1. Isolaimium, Ditylenchus, Prodorylaimus, Seinura, Paratrichodorus, Trichodorus, and Rotylenchulus were present only in site F2. Among the trophic groups, nematodes of the order Rhabditida were the most abundant of the bacterivores in both areas and Aphelenchoides was most abundant among fungivores. Of the plant-parasitic nematodes, Tylenchidae, Criconematidae (Criconemoides), and Longidoridae (Xiphinema) were dominant in site F1 while Pratylenchidae (Pratylenchus), Hoplolaimidae (Helicotylenchus), and Criconematidae (Criconemella) were dominant in site F2. In F1R, the bacterivorous nematodes constituted approximately 53% of the total nematode abundance. Omnivores predominated in F1D and F2R with 48% and 30% of total nematode abundance, respectively. Plant-parasitic nematodes represented 38% of total nematode abundance in F2D. Abundance, trophic diversity, and taxa richness were significantly higher (P < 0.05) in the rainy season than in the dry season (Table 1). Therefore, the structure and composition of the nematode assemblages were quite different between areas and time.
Table 1.
Abundance, average, and dominance of the nematode assemblages in two Atlantic Forests, Zona da Mata Norte, Pernambuco State, Brazil.
Differences between the nematode assemblages across forest soils in different seasons:
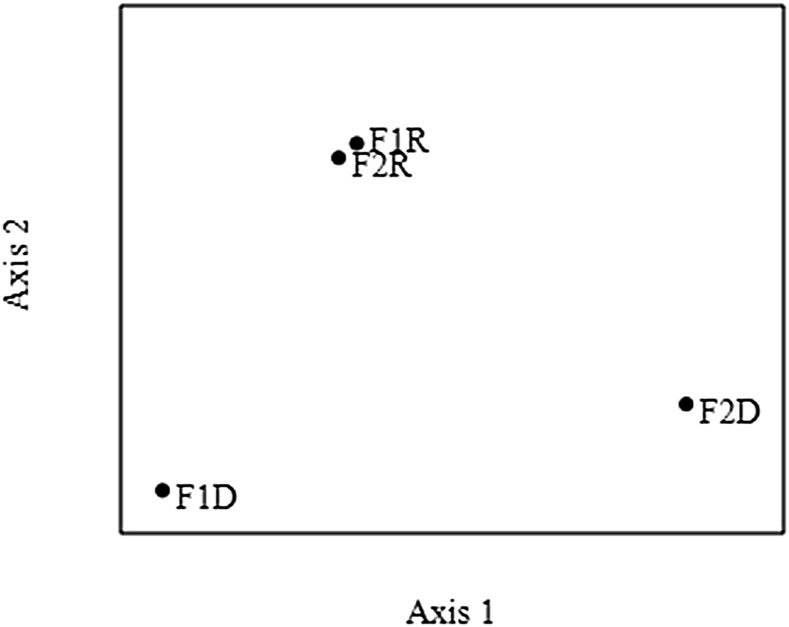
Analysis using NMDS highlighted three distinct groups: (i) forest soils in rainy season (F1R and F2R); (ii) forest soil 1 in dry season (F1D); and (iii) forest soil 2 in dry season (F2D) (Fig. 2). One-way ANOSIM revealed significant differences between the nematode assemblages across groups jointed in NMDS. Significant differences between the seasons were detected by ANOSIM (R = 0.59; P < 0.001). The greatest differences were between Group I vs. Group III (R = 0.72; P < 0.001), followed by Group II vs. Group III (R = 0.64; P < 0.001).
Fig. 2.
Two-dimensional ordering, using nonmetric multidimensional scaling, of nematode assemblages associated with forest soils during the rainy (F1R and F2R) and dry (F1D and F2D) seasons in the Atlantic Forest, Pernambuco, Brazil. F1R = Pau Amarelo forest in rainy season, F1D = Pau Amarelo forest in dry season, F2R = Camucim in rainy season, F2D = Camucim in dry season.
The genera that most contributed to the total dissimilarity between the groups are reported in Table 2. The average similarity between Groups I and II was 91.19%. Rhabditida contributed 20.10% to the total dissimilarity, followed by Dorylaimus at 17.60%. The average similarity between Groups I and III was 97.87%. Rhabditida contributed 16.90% to the total dissimilarity, followed by Dorylaimellus at 9.50%. The average similarity between Group II vs. Group III was 97.99%. Dorylaimus contributed 22.14% to the total dissimilarity, followed by Dorylaimellus at 14.12%.
Table 2.
Similarity percentage (cutoff 50%) comparisons between seasons and forest areas in the Atlantic Forest, Pernambuco, Brazil.
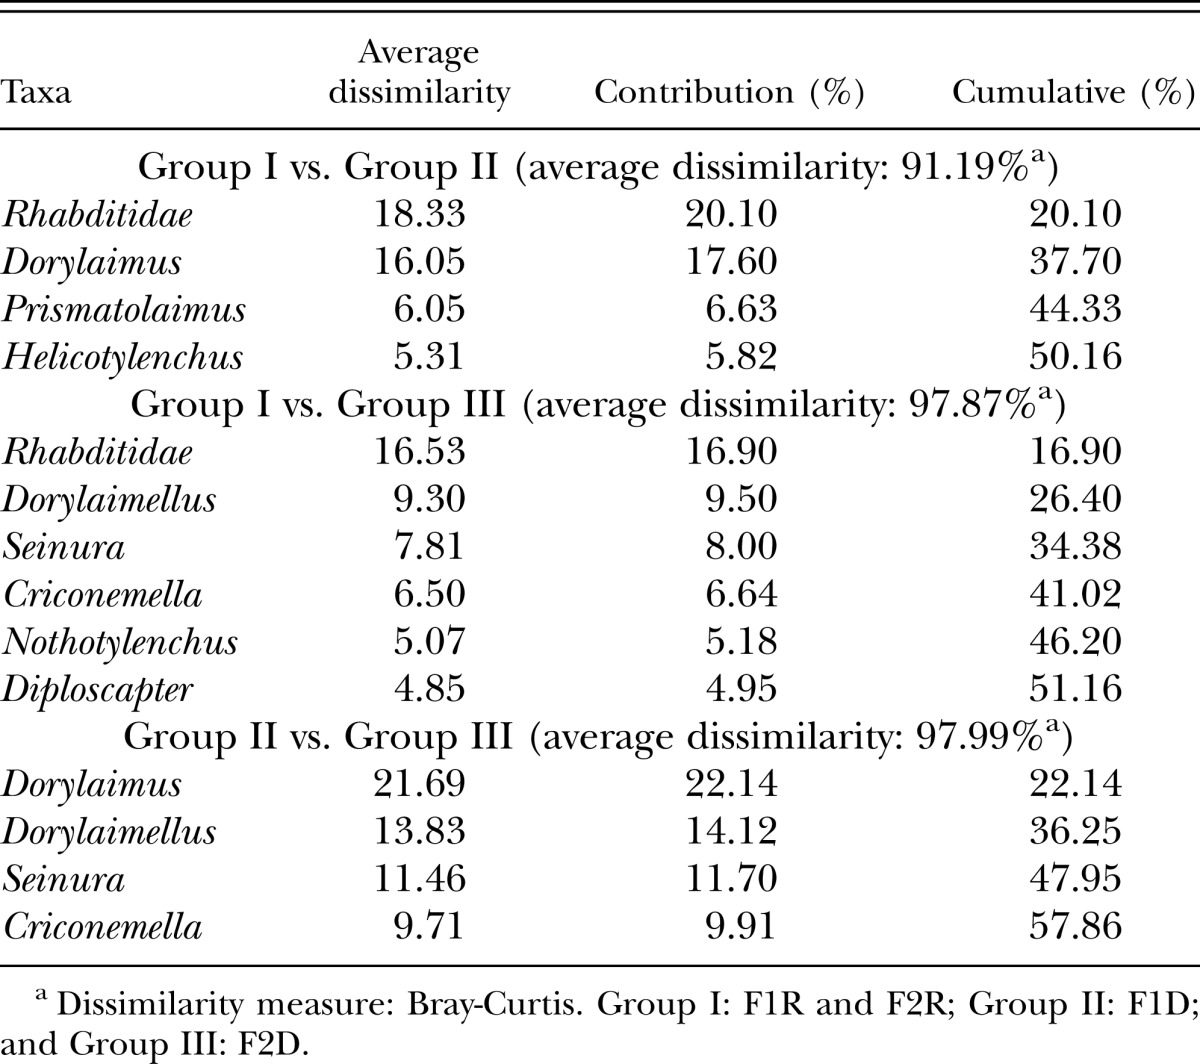
The nematode assemblages remained clustered in the rainy season (Fig. 2). Rhabditidae taxa dominated the rainy season in both forest soils. It is known that individuals in the Rhabditidae family (c-p value 1) are bacterivores and enrichment indicators (Bongers and Bongers, 1998). These nematodes have physiological adaptations for survival, dauer larvae, and staying metabolically inactive in response to some environmental or nutritional stresses (McSorley, 2003; Ferris and Bongers, 2006; Sommer and Ogawa, 2013). Therefore, the high abundance of Rhabditidae in the rainy season may be attributed to high soil water availability, which has an influence on increase of soil nutrients (Wharton, 2010) and the growth of root mass, length, and surface area (Metcalfe et al., 2008). Moreover, in moist environments, the carbon and energy channels in the soil food web are bacteria mediated (Ruess and Ferris, 2004). Green et al. (2005) demonstrated the importance of rainfall and soil moisture on root biomass in tropical rainforest.
Sampling intensity:
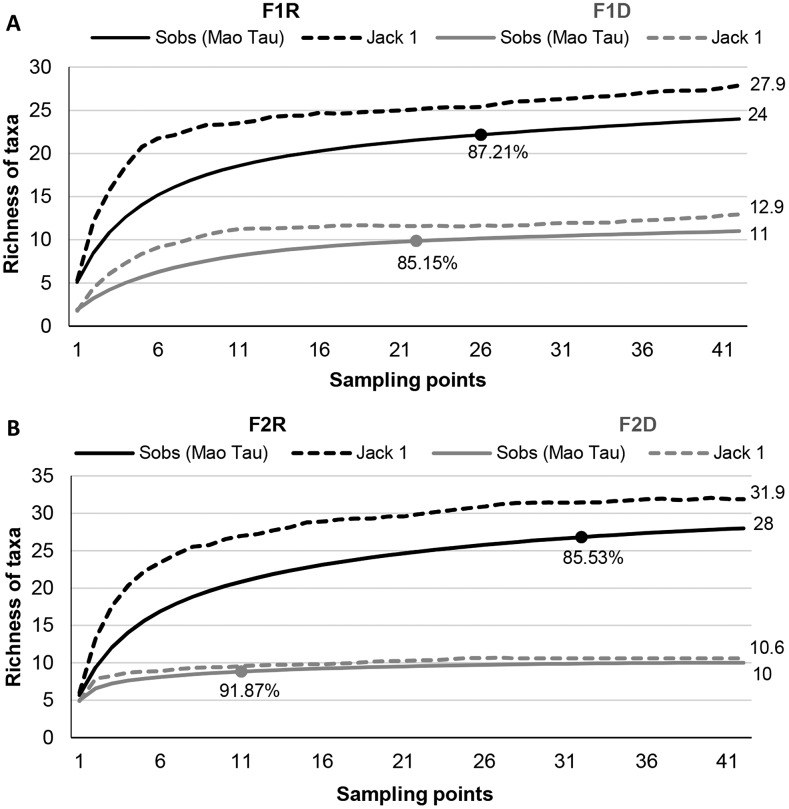
RC were calculated to determine the sampling intensity necessary to detect species richness with a known confidence level (95%) (Fig. 3). RC stabilized for all studied sites, indicating that 42 sampling points were more than sufficient to detect most of the taxa present in the studied areas. Rarefaction curve estimates of the number of taxa using SJack1 (Fig. 3A) showed that the estimated number of taxa during the rainy season in site F1 was 27.9 (F1R) and 12.95 (F1D), which are values close to Mao Tau (observed values) of 24 and 11, respectively. Rarefaction curve estimates of the number of taxa using SJack1 in F2 (Fig. 3B) were 31.9 (F2R) and 10.61 (F2D), values close to Mao Tau (observed values) of 28 and 10, respectively. Therefore, SJack1 satisfactorily estimated the total taxa richness in both areas. The RC analyses indicated that in site F1, 25 (rainy season) and 22 (dry season) sampling points are sufficient to sample 87% and 85%, respectively, of the taxa present in this area. In site F2, 32 (rainy season) and 11 (dry season) sampling points are sufficient to sample 85% and 92%, respectively, of the taxa present. We conclude that in the rainy season, sampling to detect more nematode taxa should be more intensive due to higher taxa richness in this season.
Fig. 3.
Rarefaction curves showing observed (Mao Tau) and estimated (Jack 1) taxa richness of nematode assemblages associated with Atlantic Forest soils, Pernambuco, Brazil. (A) Pau Amarelo forest in rainy (F1R) and dry (F1D) seasons; and (B) Camucim forest in rainy (F2R) and dry (F2D) seasons.
Relationships between nematodes and soil attributes:
Correlations were calculated to assess the relationships between nematode populations and soil properties (data not shown). Predatory nematodes (Mononchida and Dorylaimida) were positively correlated with WC (r = 0.32; P < 0.05), consistent with the aquatic nature of soil nematodes and the need of predatory nematodes to move through the soil system to feed on other nematodes (Griffiths, 1994; Briar et al., 2012).
Contrary to our expectation, soil respiration rate was negatively correlated with bacterivorous nematodes and enrichment metabolic footprint (r = −0.35; P < 0.05). Soil respiration rate is a measurement that is often used to estimate soil microbial activity (Dilly, 2006). Therefore, we expected that an increase in microbial activity would result in an increase in population levels of bacterivorous nematodes, such as in the positive interaction between bacterial biomass and bacterivores reported by Fu et al. (2005). Considering that we carried out the present study in forest soils, where there are different microhabitats, other factors that were not measured may also be influencing the distribution and abundance of this trophic group.
Predatory nematodes (Mononchida and Dorylaimida) were negatively correlated with soil organic matter (SOM) (r = −0.36; P < 0.05). Forest soils have high plant density and diversity that favors opportunistic nematode groups, such as bacterivores, through high inputs of organic matter (Biederman et al., 2008). Therefore, the negative correlation between these factors is contrary to our expectation because the high SOM should indirectly favor predator nematodes. Enrichment index was negatively correlated with BD (r = −0.33; P < 0.05). The decrease in EI when BD increases is possibly because at higher BD the pore space is reduced (Klein and Libardi, 2002), which influences microbial activity by reducing acid phosphatase levels (Jordan et al., 2003) or by inhibiting growth of the total and nitrifying bacteria populations (Pupin et al., 2009). This would indirectly affect EI, which indicates the predominance of enrichment opportunist, bacterivorous nematodes (e.g., order Rhabditida, and the families Diploscapteridae and Bunonematidae) within the nematode assemblage (Ferris et al., 2001).
Structure and condition of the soil food web:
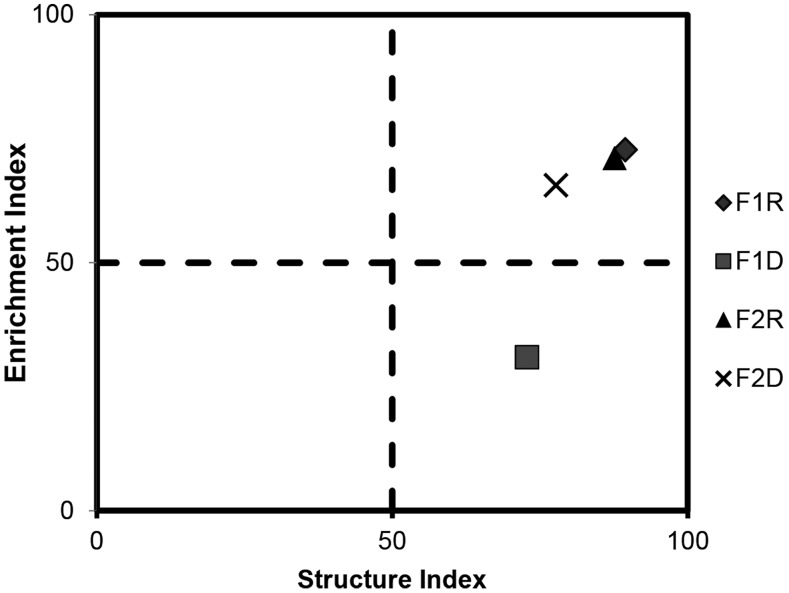
In the faunal analysis (Fig. 4), the hypothesis that forest soils have food webs with greater structure and low enrichment was accepted at F1D. In F1R, and in both seasons in site F2, the structure and enrichment of the food web were high.
Fig. 4.
Faunal analysis from soils during the rainy (F1R and F2R) and dry (F1D and F2D) seasons in the Atlantic Forest, Pernambuco, Brazil. F1R = Pau Amarelo forest in rainy season, F1D = Pau Amarelo forest in dry season, F2R = Camucim in rainy season, F2D = Camucim in dry season.
According to Ferris et al. (2001), the soil food web in site F1 is enriched and structured in the rainy season, and structured but resource limited in the dry season. In site F2, the soil food web is enriched and structured in both seasons. There were significant temporal differences in EI in site F1, with the highest values occurring in the rainy season, in contrast there were no significant differences between seasons in site F2 (P < 0.05).
Possibly, the findings in site F1 could be due to the dry season being characterized by lower soil WC and reduced microbial activity, which concomitantly reduce food availability for bacterivorous and fungivorous nematodes. The amount of precipitation may be a more important factor than plant diversity or soil nutrient status in structuring soil fungal communities in tropical forest (McGuire et al., 2012). Leff et al. (2012) suggest that soil bacterial communities depend on the nature of the organic matter to be decomposed.
Concerning site F2, the soil WC was not a determining factor, and therefore there must be other factors supporting bacterivorous and fungivorous nematodes. It is known that litter and root quality positively affect the abundance of specific nematode groups, e.g., bacterivores (Cesarz et al., 2013). The CI indicates the predominance of fungivorous nematodes in decomposition pathways (Ferris et al., 2001), with higher values suggesting that fungivores are important in organic matter decomposition and lower values indicating dominance of bacterivores.
In this study, CI differed significantly through time (P < 0.05) but values remained low, suggesting that the decomposition channel in the food web was bacterial mediated in both forest soils. This was contrary to our expectation because fungi are usually considered to be the major decomposers of forest soils (Rayner and Boddy, 1988; Ferris et al., 2004; Berg and McClaugherty, 2014). Moreover, there are differences in the growth forms of fungi and bacteria, which respectively exhibit a low growth rate in hyphae and high replication rate of individual cells (Hendrix et al., 1986). However, the quality and quantity of SOM must also be taken into account in regulating dominance of fungal or bacterial energy channels (Holtkamp et al., 2008).
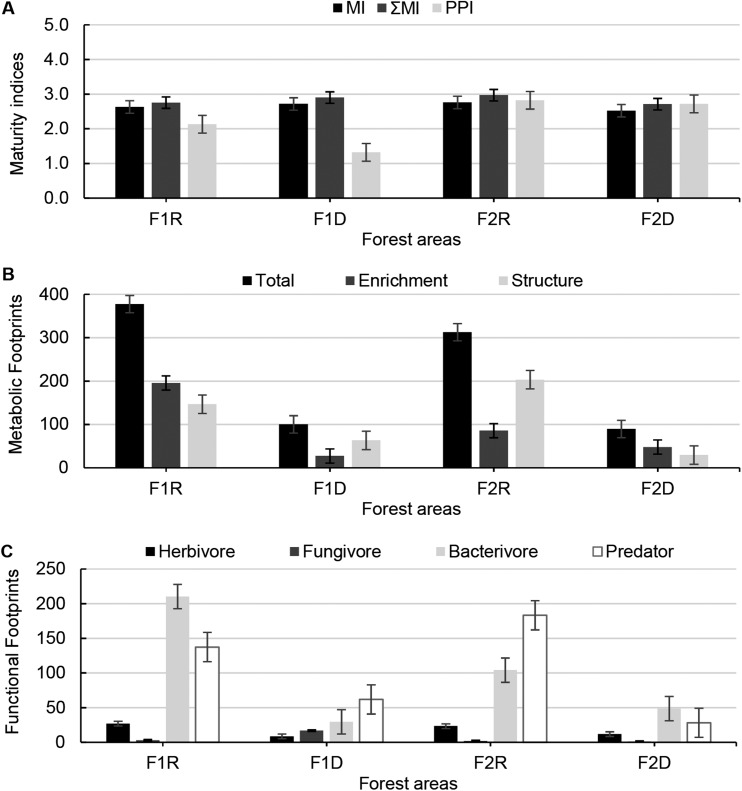
As expected, there were no differences in BI between sites and time (P < 0.05), indicating no change in the proportional abundance of general opportunistic nematodes (e.g., Acrobeles), which are tolerant to soil perturbation. SI values were high in all areas and seasons. The values of MI and ΣMI did not differ between areas and time (P < 0.05), and were > 2 (Fig. 5A).
Fig. 5.
Maturity indices (A), metabolic footprints (B), and functional footprints (C) of nematode assemblages associated with forest soils during the rainy (F1R and F2R) and dry (F1D and F2D) seasons in different areas of the Atlantic Forest, Pernambuco, Brazil. F1R = Pau Amarelo forest in rainy season, F1D = Pau Amarelo forest in dry season, F2R = Camucim in rainy season, F2D = Camucim in dry season.
Thus consistent with general understanding, the forest areas have complex and stable soil food webs, with nematode assemblages dominated by larger species with longer life cycles, such as omnivores (K-strategists), which are sensitive to perturbation and need more time to establish compared to opportunistic fast-growing bacterivorous and fungivorous nematodes (Bongers and Bongers, 1998; Ferris et al., 2001). Similarly, in a long-term experiment, increased plant diversity corresponded with increased abundance of predatory nematodes and greater food web complexity (Eisenhauer et al., 2011).
In site F1, PPI differed significantly through time with the highest values in the rainy season. However, there were no temporal differences in site F2 (P < 0.05). Probably, a decrease in root production during the dry season decreased the abundance of plant-parasitic nematodes (Bongers, 1990; Rossouw et al., 2008; Teillet et al., 2013), contributing to lower values of PPI in F1D compared to F1R.
The NMF analyses were applied as an indicator of responsiveness of the nematode assemblage to resources and their likely effect on the magnitude of the functions and services provided by the different functional guilds (Fig. 5B,C) (Ferris, 2010a; Ferris et al., 2012). In site F1, enrichment, herbivore, and bacterivore metabolic footprints differed significantly across time with greater values in the rainy season. There were no temporal differences in site F2 (P < 0.05).
Thus, in the rainy season, diverse groups of nematodes were favored by greater availability of nutrients and food. The fungivore metabolic footprint differed in site F1, where it was greatest in the dry season, but there were no differences in site F2 (P < 0.05). It is known that fungivorous nematodes prefer dry sites (Bakonyi and Nagy, 2000). However, Briar et al. (2012) suggest that not all taxa within a trophic group may respond to edaphic factors in the same way.
The structure metabolic footprint (SF) differed across time and between areas (P < 0.05). SF is an indicator of higher trophic level nematodes, including predators of opportunistic taxa (Ferris, 2010a). Thus, the decline in food availability in the dry season affected prey availability (herbivorous, fungivorous, and bacterivorous nematodes), resulting in a decrease in abundance of predatory nematodes (Ferris et al., 2012).
Functional connectance in soil food web:
Functional connectance is represented by spatial co-location between predators and their prey. If the predation function is to occur, predators and prey must be in the same place at the same time. Prey are defined as amplifiable if they can be increased by adding resources or by other environmental modification; target prey are defined as those that are, subjectively, the desired target to be suppressed or regulated by the predation (Sánchez-Moreno et al., 2011; Ferris et al., 2012). Because we performed this research in forest areas, we tested whether low prey abundance was related to high predator abundance, which is expected in a stable system.
Confirming this hypothesis, the correlations were positive in areas and time: predator vs. prey (r = 0.31; P < 0.05), predator vs. target prey (r = 0.24; P < 0.05), and predator vs. amplifiable prey (r = 0.25; P < 0.05). Eisenhauer et al. (2011) and Chung et al. (2007) assert that plant diversity benefits microbial communities and the ecosystem services of soils. Thus, positive correlations between predator and prey nematodes are expected in forest soils due to the more complex soil food web, which favors both prey and predators. The interactions between predator and prey did not differ between areas and time (P < 0.05). In other words, the predator–prey relationship was not affected by changes in soil properties that fluctuate with time (e.g., soil WC and soil respiration).
In conclusion, the structure and composition of the nematode assemblages were quite different between areas and time; there was higher abundance, trophic diversity, and taxa richness in the rainy season; rarefaction curves suggest that sampling to detect more nematode taxa should be more intensive in the rainy season. According to faunal analysis, the studied forest soils have complex and stable soil food webs, with higher connectance (dominated by larger species with longer life cycles), and predominant decomposition channel bacterial mediated in both forest soils. The predator–prey relationships did not differ across areas and time, thus they were not affected by changes in soil properties that fluctuate with time (e.g., soil WC, soil respiration).
Literature Cited
- Alvares CA, Stape JL, Sentelhas PC, Gonçalves JLM, Sparovek G. Köppen’s climate classification map for Brazil. Meteorologische Zeitschrift. 2013;22:711–728. [Google Scholar]
- Bakonyi G, Nagy P. Temperature- and moisture-induced changes in the structure of the nematode fauna of a semiarid grassland—patterns and mechanisms. Global Change Biology. 2000;6:697–707. [Google Scholar]
- Berg B, McClaugherty C. 2014. Plant litter: Decomposition, humus formation, carbon sequestration. Berlin: Springer-Verlag.
- Biederman LA, Boutton TW, Whisenant SG. Nematode community development early in ecological restoration: The role of organic amendments. Soil Biology and Biochemistry. 2008;40:2366–2374. [Google Scholar]
- Bongers T. The maturity index: An ecological measure of environmental disturbance based on nematode species composition. Oecologia. 1990;83:14–19. doi: 10.1007/BF00324627. [DOI] [PubMed] [Google Scholar]
- Bongers T, Bongers M. Functional diversity of nematodes. Applied Soil Ecology. 1998;10:239–251. [Google Scholar]
- Bongers T, Ferris H. Nematode community structure as a bioindicator in environmental monitoring. Trends in Ecology and Evolution. 1999;14:224–228. doi: 10.1016/s0169-5347(98)01583-3. [DOI] [PubMed] [Google Scholar]
- Briar SS, Culman SW, Young-Mathews A, Jackson LE, Ferris H. Nematode community responses to a moisture gradient and grazing along a restored riparian corridor. European Journal of Soil Biology. 2012;50:32–28. [Google Scholar]
- Cesarz S, Ruess L, Jacob M, Jacob A, Schaefer M, Scheu S. Tree species diversity versus tree species identity: Driving forces in structuring forest food webs as indicated by soil nematodes. Soil Biology and Biochemistry. 2013;62:36–45. [Google Scholar]
- Chung H, Zak DR, Reich PB, Ellsworth DS. Plant species richness, elevated CO2, and atmospheric nitrogen deposition alter soil microbial community composition and function. Global Change Biology. 2007;13:980–989. [Google Scholar]
- Clarke KR. Non-parametric multivariate analyses of changes in community structure. Australian Journal of Ecology. 1993;18:117–143. [Google Scholar]
- Colwell R. 2009. EstimateS: Statistical estimation of species richness and shared species from samples, version 8.2. http://viceroy.eeb.uconn.edu/EstimateS.
- Culman SW, DuPont ST, Glover JD, Buckley DH, Fick GW, Ferris H, Crews TE. Long-term impacts of high-input annual cropping and unfertilized perennial grass production on soil properties and belowground food webs in Kansas, USA. Agriculture. Ecosystems and Environment. 2010;137:13–24. [Google Scholar]
- Dilly O. 2006. Soil microbial activity. Pp. 114–116 in J. Bloem, D. W. Hopkins, and A. Benedetti, eds. Microbiological methods for assessing soil quality. Wallingford: CAB International.
- Donagema GK, de Campos DVB, Calderano SB, Teixeira WG, Viana JHM. 2011. Manual de métodos de análise de solo. Rio de Janeiro: Embrapa Solos.
- Eisenhauer N, Migunova VD, Ackermann M, Ruess L, Scheu S. Changes in plant species richness induce functional shifts in soil nematode communities in experimental grassland. PLoS One. 2011;6:e24087. doi: 10.1371/journal.pone.0024087. [DOI] [PMC free article] [PubMed] [Google Scholar]
- Ferris H. Form and function: Metabolic footprints of nematodes in the soil food web. European Journal of Soil Biology. 2010a;46:97–104. [Google Scholar]
- Ferris H. Contribution of nematodes to the structure and function of the soil food web. Journal of Nematology. 2010b;42:63–67. [PMC free article] [PubMed] [Google Scholar]
- Ferris H, Bongers T. Nematode indicators of organic enrichment. Journal of Nematology. 2006;38:3–12. [PMC free article] [PubMed] [Google Scholar]
- Ferris H, Bongers T, de Goede RGM. A framework for soil food web diagnostics: Extension of the nematode faunal analysis concept. Applied Soil Ecology. 2001;18:13–29. [Google Scholar]
- Ferris H, Bongers T, de Goede R. 2004. Nematode faunal analyses to assess food web enrichment and connectance. Pp. 503–510 in R. C. Cook, and D. J. Hunt, eds. Proceedings of the Fourth International Congress of Nematology. Nematology Monographs and Perspectives 2. Leiden: Brill.
- Ferris H, Sánchez-Moreno S, Brennan EB. Structure, functions and interguild relationships of the soil nematode assemblage in organic vegetable production. Applied Soil Ecology. 2012;61:16–25. [Google Scholar]
- Fu S, Ferris H, Brown D, Plant R. Does the positive feedback effect of nematodes on the biomass and activity of their bacteria prey vary with nematode species and population size? Soil Biology and Biochemistry. 2005;37:1979–1987. [Google Scholar]
- Green JJ, Dawson LA, Proctor J, Duff EI, Elston DA. Fine root dynamics in a tropical rain forest is influenced by rainfall. Plant and Soil. 2005;276:23–32. [Google Scholar]
- Griffiths BS. 1994. Soil nutrient flow. Pp. 65–91 in J. F. Darbyshire, ed. Soil protozoa. Wallingford: CAB International.
- Grisi BM. Método químico de medição da respiração edáfica: Alguns aspectos técnicos. Ciência e Cultura. 1978;30:82–88. [Google Scholar]
- Hammer Ø, Harper DAT, Ryan PD. PAST: Paleontological statistics software package for education and data analysis. Palaentologia Eletronica. 2001;4:1–9. [Google Scholar]
- Hendrix PF, Parmelee RW, Crossley DA, Coleman DC, Odum EP, Groffman PM. Detritus food webs in conventional and no-tillage agroecosystems. Bioscience. 1986;36:374–380. [Google Scholar]
- Holtkamp R, Kardol P, van der Wal A, Dekker SC, van der Putten WH, de Ruiter PC. Soil food web structure during ecosystem development after land abandonment. Applied Soil Ecology. 2008;39:23–34. [Google Scholar]
- Jenkins WR. A rapid centrifugal-flotation technique for separating nematodes from soil. Plant Disease Reporter. 1964;48:692–695. [Google Scholar]
- Jordan D, Ponder F, Jr, Hubbard VC. Effects of soil compaction, forest leaf litter and nitrogen fertilizer on two oak species and microbial activity. Applied Soil Ecology. 2003;23:33–41. [Google Scholar]
- Klein VA, Libardi PL. Densidade e distribuição do diâmetro dos poros de um latossolo vermelho, sob diferentes sistemas de uso e manejo. Revista Brasileira de Ciência do Solo. 2002;26:857–867. [Google Scholar]
- Leff JW, Nemergut DR, Grandy AS, O’Neill SP, Wickings K, Townsend AR, Cleveland CC. The effects of soil bacterial community structure on decomposition in a tropical rain forest. Ecosystems. 2012;15:284–298. [Google Scholar]
- Legendre P, Legendre LFJ. 1998. Numerical Ecology, 2nd ed. Amsterdam: Elsevier.
- Liang W, Li Q, Jiang Y, Neher DA. Nematode faunal analysis in an aquic brown soil fertilised with slow-release urea, Northeast China. Applied Soil Ecology. 2005;29:185–192. [Google Scholar]
- Mai WF, Mullin PG, Lyon HH, Loeffler K. 1996. Plant-parasitic nematodes: A pictorial key to genera, 5th ed. Ithaca: Cornell University Press.
- McGuire KL, Fierer N, Bateman C, Treseder KK, Turner BL. Fungal community composition in neotropical rain forests: The influence of tree diversity and precipitation. Microbial Ecology. 2012;63:804–812. doi: 10.1007/s00248-011-9973-x. [DOI] [PubMed] [Google Scholar]
- McSorley R. Adaptations of nematodes to environmental extremes. Florida Entomologist. 2003;86:138–142. [Google Scholar]
- Metcalfe DB, Meir P, Aragao LEOC, da Costa ACL, Braga AP, Goncalves PHL, Silva JD, de Almeida SS, Dawson LA, Malhi Y, Williams M. The effects of water availability on root growth and morphology in an Amazon rainforest. Plant and Soil. 2008;311:189–199. [Google Scholar]
- Mittermeier RA, Turner WR, Larsen FW, Brooks TM, Gascon C. 2011. Global biodiversity conservation: The critical role of hotspots. Pp. 3–22 in F. E. Zachos and J. C. Habel, eds. Biodiversity hotspots. Berlin: Springer-Verlag.
- Myers N, Mittermeier RA, Mittermeier CG, Fonseca GA, Kent J. Biodiversity hotspots for conservation priorities. Nature. 2000;403:853–858. doi: 10.1038/35002501. [DOI] [PubMed] [Google Scholar]
- Neher DA. Ecology of plant and free-living nematodes in natural and agricultural soil. Annual Review of Phytopathology. 2010;48:371–394. doi: 10.1146/annurev-phyto-073009-114439. [DOI] [PubMed] [Google Scholar]
- Porazinska DL, Giblin-Davis RM, Powers TO, Thomas WK. Nematode spatial and ecological patterns from tropical and temperate rainforests. PLoS One. 2012;7:e44641. doi: 10.1371/journal.pone.0044641. [DOI] [PMC free article] [PubMed] [Google Scholar]
- Powers TO, Neher DA, Mullin P, Esquivel A, Giblin-Davis RM, Kanzaki N, Stock SP, Mora MM, Uribe-Lorio L. Tropical nematode diversity: Vertical stratification of nematode communities in a Costa Rican humid lowland rainforest. Molecular Ecology. 2009;18:985–996. doi: 10.1111/j.1365-294X.2008.04075.x. [DOI] [PubMed] [Google Scholar]
- Pupin B, Freddi OS, Nahas E. Microbial alterations of the soil influenced by induced compaction. Revista Brasileira de Ciência do Solo. 2009;33:1207–1213. [Google Scholar]
- Rayner ADM, Boddy L. 1988. Fungal decomposition of wood: Its biology and ecology. Chichester: John Wiley.
- Rossouw J, van Rensburg L, Claassens S, Jansen van Rensburg PJ. Nematodes as indicators of ecosystem development during platinum mine tailings reclamation. Environmentalist. 2008;28:99–107. [Google Scholar]
- Ruess L, Ferris H. 2004. Decomposition pathways and successional changes. Pp. 547–566 in R. C. Cook, and D. J. Hunt, eds. Proceedings of the Fourth International Congress of Nematology. Nematology Monographs and Perspectives 2. Leiden: Brill.
- Sánchez-Moreno S, Ferris H, Young-Mathews A, Culman SW, Jackson LE. Abundance, diversity and connectance of soil food web channels along environmental gradients in an agricultural landscape. Soil Biology and Biochemistry. 2011;43:2374–2383. [Google Scholar]
- Sommer RJ, Ogawa A. 2013. The genome of Pristionchus pacificus and the evolution of parasitism. Pp. 1–14 in M. W. Kennedy and W. Harnett, eds. Parasitic nematodes: Molecular biology, biochemistry and immunology. Wallingford: CAB International.
- StatSoft 2010. Statistica (data analysis software system), version 10. http://www.statsoft.com.
- Stirling GR, Lodge GM. A survey of Australian temperate pastures in summer and winter rainfall zones: Soil nematodes, chemical, and biochemical properties. Australian Journal of Soil Research. 2005;43:887–904. [Google Scholar]
- Stork NE. 1996. Tropical forest dynamics: The faunal components. Pp. 1–20 in D. S. Edwards, W. E. Boot, and S. C. Choy, eds. Tropical rainforest research—current issues. Dordrecht: Kluwer Academic Publishers.
- Tarjan AC, Esser RP, Chang SL. An illustrated key to nematodes found in fresh water. Journal of the Water Pollution Control Federation. 1977;49:2318–2337. [Google Scholar]
- Teillet A, Dybal K, Kerry BR, Miller AJ, Curtis RHC, Hedden P. Transcriptional changes of the root-knot nematode Meloidogyne incognita in response to Arabidopsis thaliana root signals. PloS One. 2013;8:e61259. doi: 10.1371/journal.pone.0061259. [DOI] [PMC free article] [PubMed] [Google Scholar]
- Wharton DA. 2010. Nematodes survival strategies. Pp. 389–391 in D. L. Lee, ed. The biology of nematodes. London: Taylor & Francis Group.
- Yeates GW, Bongers T, de Goede RGM, Freckman DW, Georgieva SS. Feeding habits in soil nematode families and genera—an outline for soil ecologists. Journal of Nematology. 1993;25:315–331. [PMC free article] [PubMed] [Google Scholar]
- Yeomans JC, Bremner JM. A rapid and precise method for routine determination of organic carbon in soil. Communications in Soil Science and Plant Analysis. 1988;13:1467–1476. [Google Scholar]


