

Abstract
Glycan microarrays are surfaces that contain immobilized oligosaccharides or glycoconjugates and have proven useful in probing the interactions between glycan-binding proteins (GBPs) and individual glycans. Such glycan microarrays have been especially important in studying virus–glycan interactions, as most viruses express one or more GBPs important for pathogenesis. For studying interactions of influenza viruses with glycans, we describe protocols for fluorescent labeling of virus, addition of virus to a glycan microarray, analysis of a glycan microarray slide experiment, and interpretation of data.
Keywords: Glycomics, Glycan microarrays, Influenza virus, Fluorescence detection, Glycan-binding motif
1. Introduction
It is well established that the extracellular matrix and cell surface of epithelial cells are covered with glycans. These glycans are critical to physiological processes, such as cell growth, cell adhesion, and cell–cell signaling, and also act as receptors for many microbes, such as bacteria, parasites, and viruses (1). Pathogens utilize the glycan receptors for initial binding events, followed by cell infection. Influenza viruses are a well-studied example of a group of viruses that interact with glycans on the cell surface. Influenza viruses express a glycan-binding protein called hemagglutinin, which specifically binds to sialic acid-containing glycans to ultimately allow endocytosis and fusion of the virus with the host cell (2–4). There are many variants of hemagglutinin proteins in influenza viruses, which convey specificity for different sialic acids and therefore different tissue tropisms for individual viruses (2). Human influenza viruses bind sialic acid-linked a2-6 to the next sugar, while avian viruses bind a2-3 sialic acid. Interestingly, human parainfluenza viruses all bind a2-3 sialic acid. An excellent method for analyzing the specificity of viruses and viral hemagglutinins is the glycan microarray. The Consortium for Functional Glycomics (CFG) has produced a large mammalian glycan microarray, which has been widely used to study the glycan interactions of many pathogens, notably viruses (5). This has yielded an abundance of information on virus–glycan-binding specificities (https://www.functionalglycomics.org/static/consortium/news.shtml). The most straightforward technique for evaluating virus binding to the microarray is by direct fluorescent labeling of the virus. This allows the virus to be incubated with the glycan microarray in one step followed by the quantification of binding and data analysis to obtain the glycan specificity of the virus (6–8). The example of influenza virus will be discussed below to illustrate the protocol for virus labeling, assaying on the glycan microarray, and data analysis. The glycan microarray is a powerful tool (9–11) for screening viruses for their glycan-binding properties and generating hypotheses based on the detected interactions.
2. Materials
2.1. Fluorescent Labeling of Virus
- Prepared Influenza virus (for example, virus isolated from MDCK cells, purified by sucrose gradient centrifugation, checked for purity by SDS-PAGE, quantified by hemagglutination (HA) assay and/or total viral protein) (BioRad Protein Assay or quantitative SDS-PAGE) (6, 7).
- Virus is grown in LLC-MK2 cells (hPIVs) or MDCK (influenza) in infection medium [DMEM/Ham’s F12 (Gibco) supplemented with 1% ITS + (BD) and 0.1% gentamicin (Sigma)]. For influenza, 0.5 mg/mL trypsin (TPCK treated, Worthington) is added to infection medium. For hPIV1 and -2, add 1 mg/mL trypsin to the infection medium (see Note 1).
- Virus is purified by a low speed spin first to remove cell debris, then by pelleting virus from the clarified medium at 52,112 × g for 2 h (Beckman L-80 ultracentrifuge, SW-28 rotor), resuspending overnight in calcium–magnesium saline (50 mL per pellet), then centrifugation through a 10–60% sucrose gradient (hPIV) or 10–40% (influenza) (Beckman TL-100 ultracentrifuge, TLS-55 rotor, gradient 18 Probing Virus–Glycan Interactions Using Glycan Microarrays 253 at 105,000 × g for 15 min then final pelleting of band at 214,200 × g for 1 h).
- Virus concentrations average ~0.5 mg/mL total viral protein. Corresponding HA titer, which is a more relevant measure of viral activity, varies among viral species. A “good” preparation of most influenza or hPIV1 is around 64,000 HAU/mL; a “good” preparation of hPIV2 or -3 is around 12,800 HAU/mL.
Calcium/magnesium saline for resuspension of virus (after pelleting to removing sucrose or other buffer) and for dialysis: 0.15 M NaCl, 0.25 mM CaCl2, and 0.8 mM MgCl2 (Fisher Scientific).
0.15 M Sodium chloride.
1 M Sodium bicarbonate, pH 9.0.
Fluorescent dye with reactive group (for example, Alexa Fluor 488 succinimidyl ester, Molecular Probes).
Slide-A-Lyzer Mini Dialysis Units (7,000 MWCO) (Pierce/Thermo Fisher Scientific).
9% SDS gel.
2.2. Assay of Virus Binding to the CFG Glycan Microarray
Glycan microarray-printed slides (CFG) (Do not touch the printed area).
Cover slips (Fisher scientific).
Humidified Slide processing chambers (Fisher Scientific) (see Note 2).
100-mL Coplin jars for washing slides.
MilliQ water (dH2O).
Cyanine5 (Cy5)-labeled Streptavidin (ZYMED).
TSM buffer: 20 mM Tris–HCl, pH 7.4, 150 mM NaCl, 2 mM CaCl2, and 2 mM MgCl2.
TSM Wash Buffer (TSMW): TSM Buffer + 0.05% Tween 20.
TSM-Binding Buffer (TSMBB): TSM buffer + 0.05% Tween 20 + 1% BSA (see Note 3).
2.3. Data Analysis of Microarray Binding
Processed glycan microarray slide.
ProScanArray Scanner equipped with multiple lasers for detecting fluorophores (Perkin Elmer).
Image analysis software (Imagene software (BioDiscovery) or Perkin Elmer ScanArray Express).
Data analysis software (Microsoft excel).
3. Methods
3.1. Fluorescent Labeling of Virus
1. To 100 mL of virus in calcium–magnesium saline, add 10 mL of 1 M sodium bicarbonate pH 9.0 (see Note 4). 2. For 100 mL virus (for example, at 1.25 × 10⁴ HAU/mL), prepare the Alexa Fluor 488 labeling reagent. Typically, ~70 mg of Alexa Fluor 488 succinimidyl ester should be used. This is equivalent to ~0.005 mg dye per HAU (see Note 5). 3. Resuspend the Alexa Fluor 488 succinimidyl ester in 25 mL dH2O and add to the tube of virus (see Note 6). 4. Incubate samples for 1 h at room temperature in the dark or wrapped in foil on stirrer, using a 5 mm × 2 mm mini Spinbar (Bel-Art Products, 371210010) to stir the sample inside a microcentrifuge tube. 5. Transfer the entire labeling mixture to a Slide-A-Lyzer Mini Dialysis Unit (7,000 MWCO). 6. Dialyze against three changes of calcium/magnesium saline at 4°C (change after 1 h, overnight, then for an additional 1 h). Keep samples in the dark. 7. Run samples on a 9% SDS gel. Look at the gel under UV light; only the bands corresponding to the known molecular weights of surface proteins should fluoresce. The gel can be subsequently Coomassie stained to confirm band identity if necessary.
3.2. Assay of Virus Binding to Glycan Microarray
Prepare TSM, TSMW, and TSMBB Buffers (as described above).
Prepare sample(s): (a) Prepare 100 mL of virus sample by diluting the fluorescently labeled virus in TSMBB to an appropriate final concentration required for the analysis (e.g. 1:20 dilution of above-prepared virus) (see Notes 7 and 8). (b) Prepare 100 mL of Cy5-labeled streptavidin at 0.5 mg/mL final concentration in TSMBB.
Hydrate glycan microarray slides in 100 mL of TSMW in a Coplin Jar for 5 min and drain excess buffer from slide by briefly touching corner of slide to a paper towel.
Lay the slide flat and add 70 mL of the Cy5-streptavidin to the slide (see Notes 9 and 10).
Slowly place cover slip on the slide, avoiding the formation of bubbles in the sample under the cover slip. If necessary, remove any bubbles by gently tapping the cover slip with a pipette tip or slowly lifting one side of the cover slip. Make sure that the 18 Probing Virus–Glycan Interactions Using Glycan Microarrays 255 cover slip is properly positioned over the glycan microarray printed in the designated area on the slide.
Incubate slide in a humidified slide-processing chamber in the dark for 1 h at RT or other appropriate time and temperature depending on the experimental design.
When the incubation is complete, remove cover slip by gently allowing it to slip off the slide either directly into the biohazard trash or into a Coplin Jar filled with wash buffer (TSMW) (see Note 11).
Wash the slide by gently dipping four times into 100 mL of each of the following buffers in Coplin Jars: (a) TSMW (b) TSM
Immediately after the TSM wash, drain excess buffer from slide by briefly touching corner of slide to a paper towel and lay the slide flat and add 70 mL of the virus preparation.
Slowly place cover slip on slide, trying to avoid the formation of bubbles in the sample under the cover slip. Remove any bubbles by gently tapping the cover slip with a pipette tip if necessary, or slowly lifting one side of the cover slip. Make sure that the cover slip is properly positioned over the glycan microarray printed in the designated area on the slide.
Incubate slide in a humidified slide-processing chamber in the dark for 1 h at 4°C (see Note 12).
After 1 h incubation, remove cover slip by gently allowing it to slip off into the glass trash/biohazard trash.
Wash the slide by gently dipping four times into 100 mL of each of the following buffers in Coplin Jars: (a) TSMW (b) TSM (c) dH2O
Spin slide in slide centrifuge for ~15 s or remove dH2O under a gentle stream of nitrogen. Wipe bottom (non-printed) side of the slide with a Kimwipe.
3.3. Data Analysis of Microarray Binding
3.3.1. Scanning Slides
Turn on Scan Array Express or other scanner equipped with appropriate lasers for analysis of the selected fluorescent tag(s).
Allow lasers at least 15 min to warm up before scanning.
Configure scanner by selecting the appropriate laser setting for each fluorophore used; i.e. Alexa Fluor 488, Cyanine5 (Cy5), Cyanine3 (Cy3), etc. (a) Check PMT and power of lasers: Standard PMT (% gain) = 70, Laser power = 90%.
Select scan protocol that was configured in step 3.
Place slide in scanner with the microarray facing up and the barcode entering the scanner last.
Select scan and then Run scan protocol-press OK. Scan takes ~5 min at each excitation wavelength.
Each image for each wavelength scanned should be saved separately as a TIF file (see Fig. 1).
Fig. 1.
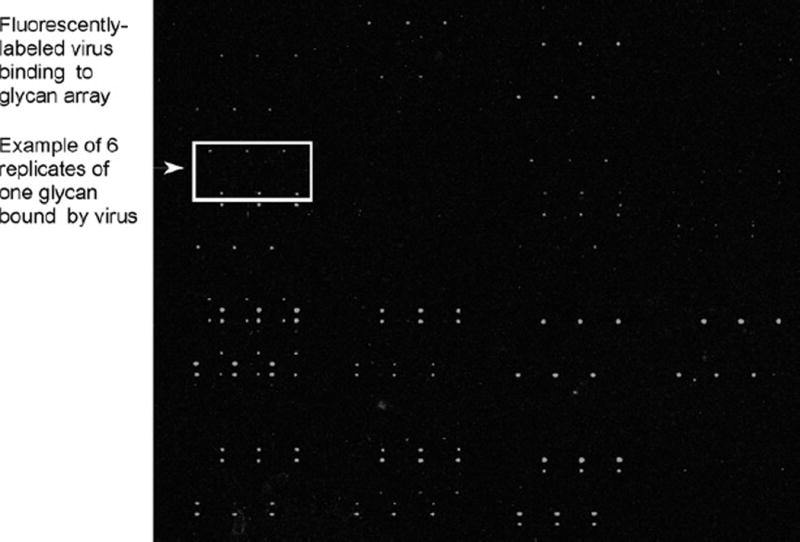
Image of a glycan microarray slide with Alexa Fluor 488-labeled virus bound to specific glycans. Glycans are printed in replicates of 6, and a pattern of binding to the glycans can be seen. The fluorescence detected in the image is then quantified using the quantitation software described, generating data that is shown in Figs. 2 and 3.
3.3.2. Analyzing Slide Images (Using Imagene Software) (See Note 13)
Open Imagene software (or another appropriate software if Imagene is not available).
Load appropriate TIF image(s).
Load appropriate grid file.
Load appropriate gene ID file.
Align grid. (a) Click Selection: adjust metagrid-click and drag grid to align with biotin spots on the microarray. (b) Click Selection: adjust subgrid-adjust individual grids using biotin spots. (c) Auto adjust spots: click Auto: auto adjust all spots – be sure to be clicked off of any individual grid. (d) Manually adjust spots: click Selection: adjust spots – adjust individual spots so that the entire spot fits inside the circle, and tighten the spots if needed by dragging the lower right corner of the circle to the correct size. If circles are around background spots that have appeared on the slide, the circle can be moved off of the spot.
Click Measure: make measurements. This process measures intensity of spots reporting the results as average relative fluorescence units (RFU) of the n = 6 spots on the CFG microarray. The results are in the form of a text file, which is used up upload the data onto the CFG website where it is converted to an interactive Bar Chart linked to several databases.
Save files.
3.3.3. Analyzing Data
The text file is also opened in an Excel macro that is produced for each glycan microarray format. For the CFG glycan microarray, a unique Excel Macro is produced for each version of the glycan microarray.
Once the values are calculated, the results of processing by the Excel Macro are presented in an Excel spreadsheet. Here the averages of RFU of binding of virus to individual replicates of the printed glycans are presented in tables, which list the glycan structures with associated RFU values sorted in order of appearance on the microarray in one column and in descending order of Average RFU values in another column. A histogram of RFU plotted vs. glycan number is also generated. See Figs. 2 and 3.
Each successive version of the CFG glycan microarray contained an increasing number of glycans; i.e. v4.2 of the microarray consists of 511 glycans in replicates of 6. The average RFU value from the 6 replicates is provided in the tables, along with the standard deviation, and the standard error of the mean. The coefficient of variation is also included as a %CV and is determined by multiplying the Standard Deviation/Mean by 100. The highest and lowest RFU values from each set of 6 replicates are removed so the mean is of 4 values rather than 6. This eliminates some of the “outliers” that contain a single very high or low point. Thus, points with high %CV should be considered suspect.
-
Data from glycan microarrays, composed of hundreds of printed glycans, are quite complex. In the case of most influenza or parainfluenza viruses, the data are somewhat simplified because most viruses bind to glycans possessing sialic acid at their non-reducing ends. Thus, for v4.2 of the CFG glycan microarray, there are 123 glycans containing sialic acid in various linkages on a variety of structures that need to be evaluated. 258 J. Heimburg-Molinaro et al.
Most viruses differentiate between sialic acid-linked a2-3 or a2-6 to a terminal, non-reducing galactose, but may differ significantly with respect to the underlying glycan structure. Interpretation of the data is currently done by manual inspection of the bound glycan structures. One approach to determine relative binding strengths is by ordering the glycans based on RFU bound. For this data to be valid, one needs to be sure the data are in a linear range. Determining the linear range can be accomplished by doing analyses at multiple concentrations of virus; i.e. from a high dilution to a low dilution using the same slide (to conserve slides) until a constant RFU is obtained for the highest binding glycans. Data from the curve showing about half-maximal binding of the highest binding glycan will be in a linear range. The highest binding glycans under these conditions may be considered the strongest binding glycans. To analyze specificity of binding, it is important to inspect not only what glycans the virus binds, but also what related structures are not bound. We use the following steps for these analyses:- The binding assay is carried out at multiple concentrations by preparing a series of two- or fivefold serial dilutions of the stock suspension of labeled virus. Using a single slide, a binding assay is carried out according to the protocols outlined above at the highest dilution of virus. After the slide is analyzed, it is rehydrated in the wash buffer and the next dilution (higher concentration) of virus is applied to the slide. The slide is processed and increasing concentrations are similarly assayed until the RFU of the highest binding glycan(s) stop increasing, which indicates the slide has been saturated.
- To select the top binding glycans in this analysis, the data at each dilution of virus is normalized by determining the percentile of binding of each glycan relative to the strongest bound glycan. This analysis is performed on two or more assays at non-saturating concentrations of virus to be sure the data are in a linear range. Then the average percentile ranking of each glycan is determined by averaging the Rank of each glycan at each dilution of virus. To order the ranked glycans, the data are sorted according to the Average Rank in decreasing order. This can all be done using an excel Spreadsheet.
- As an example, the data in Table 1 show the results of ranking the glycans bound by labeled human parainfluenza virus 1, strain C35 (51,200 HAU/ml). The analyses were done at dilutions of 1:100, 1:40, 1:20, and 1:10. Notice that the RFU bound of strongest binding glycan (#234) increased with increasing concentration of virus until a dilution of 1:10 was reached. Thus the linear range of virus concentration was represented by the lower 3 dilutions. (d) By calculating the average rank of the binding of each glycan in the linear range (the lower 3 dilutions), an average rank was obtained and the glycans were ordered according to relative binding from highest to lowest ranking. All rankings below 4 percentile were considered weak- or nonbinders.
- The data from the ranked and ordered glycans determined from concentration-dependent binding assays is used to manually determine a motif of binding.
- Tally up the appearance of particular sugars and linkages in the first, second, third, and/or beyond positions in the binding glycans (those binding above 4 percentile, as described in 4d). For example, 34 glycans are identified as “bound” in Table 1; 30 of them have Neu5Aca2-3 as the sialic acid attached to the Gal, 2 have Neu5Aca2-6, and 2 have Neu5Gca2-3.
- Look for the minimum number of sugars in the chains bound (in Table 1, three).
- Look for common substituents (in Table 1, e.g. fucose, sulfate, and GalNAc) and the sugars to which they are attached.
- Look for numbers of branches on the structures.
- Take all of the above and draw the sequence of the generic bound structure (from Table 1: (±Neu5Aca2-8) Neu5Aca2-3(±6OSO3)Galb1-4(±Fuc, ±GalNAc)GlcNAc; possibility of Neu5Aca2-6 or Neu5Gca2-3 binding).
- Take the generic bound structure and look at the nonbinding glycans, especially those that are in the general glycan category. If nonbinding structures that otherwise fit the generic bound motif are found, refine binding motif according to characteristics of these structures (in Table 1, two binding structures have Neu5Aca2-6 linkages, but hPIV1 would not be defined as generally binding to Neu5Aca2-6 due to the large number of these structures that are not bound.)
Fig. 2.
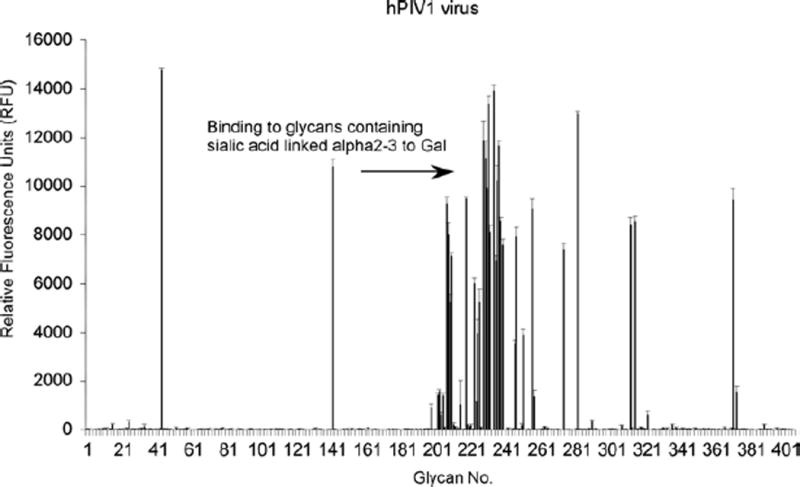
Alexa Fluor 488-labeled human parainfluenza virus 1 (hPIV1), strain C-35 (51,200 HAU/ml) diluted 1:10, binding to v3.2 of the CFG glycan microarray (http://www.functionalglycomics.org/static/consortium/resources/resourcecoreh8.shtml). Histogram presents the glycan number (x-axis) vs. the relative fluorescence units (RFU) (y-axis) of binding to each glycan. The highest binding glycans contain terminal epitopes of sialic acid-linked a2-3 to galactose.
Fig. 3.

Alexa Fluor 488-labeled human influenza A virus, strain A/Oklahoma/447/08 H1N1 (61,147 HAU/ml) diluted 1:20, binding to v4.0 of the CFG glycan microarray (http://www.functionalglycomics.org/static/consortium/resources/resourcecoreh8.shtml). Histogram presents the glycan number (x-axis) vs. the relative fluorescence units (RFU) (y-axis) of binding to each glycan. The highest binding glycans contain terminal epitopes of sialic acid-linked a2-6 to galactose.
Table 1.
| GLYCA N NO. |
STRUCTURE | 1:10 dilution | 1:20 dilution | 1:40 dilution | 1:100 dilution | AVG. RANK |
||||||||
|---|---|---|---|---|---|---|---|---|---|---|---|---|---|---|
| Max RFU = 14742 | Max RFU = 13705 | Max RFU = 11691 | Max RFU = 5721 | |||||||||||
| RFU | %CV | RANK | RFU | %CV | RANK | RFU | %CV | RANK | RFU | %CV | RANK | |||
| 234 | Neu5Aca2-3Galb1-4GlcNAcb1-3Galb1-4GlcNAcb1-3Galb1-4GlcNAcb-Sp0 | 13910 | 4 | 94 | 13706 | 7 | 100 | 11692 | 14 | 100 | 5722 | 20 | 100 | 100 |
| 44 | Neu5Aca2-3(6OSO3)Galb1-4GlcNAcb-Sp8 | 14742 | 1 | 100 | 13359 | 6 | 97 | 9433 | 15 | 81 | 3875 | 18 | 68 | 82 |
| 282 | Neu5Aca2-3Galb1-4GlcNAcb1-3Galb1-3GlcNAcb-Sp0 | 12967 | 2 | 88 | 11224 | 7 | 82 | 8191 | 9 | 70 | 5188 | 17 | 91 | 81 |
| 142 | Neu5Aca2-3Galb1-4GlcNAcb1-2Mana1-3(Neu5Aca2-3Galb1-4GlcNAcb1-2Mana1-6)Manb1-4GlcNAcb1-4GlcNAcb-Sp1 | 10794 | 5 | 73 | 11329 | 6 | 83 | 7841 | 13 | 67 | 4252 | 14 | 74 | 75 |
| 218 | Neu5Aca2-3Galb1-3(Neu5Aca2-3Galb1-4)GlcNAcb-Sp8 | 9476 | 2 | 64 | 10328 | 3 | 75 | 6846 | 20 | 59 | 5009 | 16 | 88 | 74 |
| 229 | Neu5Aca2-3Galb1-4(Fuca1-3)GlcNAcb-Sp0 | 11149 | 13 | 76 | 10761 | 7 | 79 | 6256 | 11 | 54 | 4846 | 15 | 85 | 72 |
| 228 | Neu5Aca2-3Galb1-4(Fuca1-3)GlcNAcb1-3Galb1-4(Fuca1-3)GlcNAcb1-3Galb1-4(Fuca1-3)GlcNAcb-Sp0 | 11866 | 14 | 80 | 10529 | 14 | 77 | 7212 | 6 | 62 | 3953 | 9 | 69 | 69 |
| 231 | Neu5Aca2-3Galb1-4(Fuca1-3)GlcNAcb1-3Galb-Sp8 | 13339 | 5 | 90 | 12521 | 9 | 91 | 6561 | 13 | 56 | 3403 | 12 | 59 | 69 |
| 239 | Neu5Aca2-3Galb1-4Glcb-Sp8 | 7588 | 6 | 51 | 8491 | 6 | 62 | 5175 | 12 | 44 | 4124 | 15 | 72 | 59 |
| 371 | NeuAca2-3Galb1-4GlcNAcb1-3GalNAc-Sp14 | 9414 | 10 | 64 | 9143 | 12 | 67 | 5095 | 24 | 44 | 3724 | 45 | 65 | 58 |
| 312 | Neu5Aca2-3Galb1-3(Neu5Aca2-3Galb1-4GlcNAcb1-6)GalNAca-Sp14 | 8415 | 7 | 57 | 7490 | 15 | 55 | 5904 | 9 | 50 | 3482 | 32 | 61 | 55 |
| 230 | Neu5Aca2-3Galb1-4(Fuca1-3)GlcNAcb-Sp8 | 9877 | 1 | 67 | 7733 | 13 | 56 | 5514 | 8 | 47 | 2696 | 39 | 47 | 50 |
| 256 | Neu5Gca2-3Galb1-4(Fuca1-3)GlcNAcb-Sp0 | 9048 | 9 | 61 | 7887 | 15 | 58 | 4627 | 30 | 40 | 1990 | 29 | 35 | 44 |
| 274 | Galb1-3(Neu5Aca2-3Galb1-4GlcNacb1-6)GalNAca-Sp14 | 7399 | 7 | 50 | 5370 | 22 | 39 | 3605 | 34 | 31 | 2520 | 49 | 44 | 38 |
| 208 | Neu5Aca2-3(GalNAcb1-4)Galb1-4GlcNAcb-Sp0 | 8006 | 12 | 54 | 6306 | 9 | 46 | 3694 | 11 | 32 | 2036 | 52 | 36 | 38 |
| 210 | Neu5Aca2-3(GalNAcb1-4)Galb1-4Glcb-Sp0 | 7126 | 4 | 48 | 5583 | 3 | 41 | 3430 | 13 | 29 | 2073 | 32 | 36 | 35 |
| 232 | Neu5Aca2-3Galb1-4(Fuca1-3)GlcNAcb1-3Galb1-4GlcNAcb-Sp8 | 8106 | 7 | 55 | 5266 | 9 | 38 | 4477 | 7 | 38 | 1685 | 15 | 29 | 35 |
| 209 | Neu5Aca2-3(GalNAcb1-4)Galb1-4GlcNAcb-Sp8 | 5224 | 13 | 35 | 2080 | 15 | 15 | 2119 | 13 | 18 | 4056 | 39 | 71 | 35 |
| 236 | Neu5Aca2-3Galb1-4GlcNAcb-Sp8 | 10202 | 13 | 69 | 5908 | 28 | 43 | 4148 | 26 | 35 | 1405 | 14 | 25 | 34 |
| 207 | Neu5Aca2-3(6OSO3)Galb1-4(Fuca1-3)GlcNAcb-Sp8 | 9258 | 6 | 63 | 5149 | 16 | 38 | 4049 | 7 | 35 | 1456 | 7 | 25 | 33 |
| 247 | Neu5Aca2-6Galb1-4Glcb-Sp0 | 7915 | 10 | 54 | 5234 | 23 | 38 | 2898 | 19 | 25 | 1797 | 46 | 31 | 31 |
| 235 | Neu5Aca2-3Galb1-4GlcNAcb-Sp0 | 6963 | 6 | 47 | 4322 | 14 | 32 | 4235 | 11 | 36 | 1367 | 15 | 24 | 31 |
| 251 | Neu5Aca2-8Neu5Aca2-3Galb1-4Glcb-Sp0 | 3905 | 11 | 26 | 3960 | 11 | 29 | 1890 | 20 | 16 | 1107 | 14 | 19 | 21 |
| 223 | Neu5Aca2-3Galb1-3GlcNAcb1-3Galb1-4GlcNAcb-Sp0 | 6003 | 8 | 41 | 2997 | 11 | 22 | 2817 | 4 | 24 | 900 | 32 | 16 | 21 |
| 237 | Neu5Aca2-3Galb1-4GlcNAcb1-3Galb1-4GlcNAcb-Sp0 | 11642 | 4 | 79 | 3638 | 7 | 27 | 2635 | 12 | 23 | 446 | 54 | 8 | 19 |
| 315 | Neu5Aca2-3Galb1-4GlcNAcb1-2Mana1-3(Neu5Aca2-6Galb1-4GlcNAcb1-2Mana1-6)Manb1-4GlcNAcb1-4GlcNAcb-Sp1 | 8538 | 5 | 58 | 3437 | 5 | 25 | 3271 | 6 | 28 | 75 | 73 | 1 | 18 |
| 238 | Neu5Aca2-3Galb1-4Glcb-Sp0 | 8567 | 3 | 58 | 2381 | 11 | 17 | 2833 | 35 | 24 | 50 | 60 | 1 | 14 |
| 225 | Neu5Aca2-3Galb1-3GlcNAcb-Sp8 | 3955 | 29 | 27 | 2115 | 38 | 15 | 1563 | 13 | 13 | 442 | 78 | 8 | 12 |
| 246 | Neu5Aca2-6Galb1-4GlcNAcb1-3Galb1-4GlcNAcb-Sp0 | 3540 | 8 | 24 | 1862 | 14 | 14 | 1954 | 3 | 17 | 310 | 81 | 5 | 12 |
| 226 | Neu5Aca2-3Galb1-4(6OSO3)GlcNAcb-Sp8 | 5223 | 22 | 35 | 1666 | 17 | 12 | 1458 | 6 | 12 | 29 | 50 | 1 | 8 |
| 373 | Neu5Aca2-3Galb1-4(Fuca1-3)GlcNAcb1-3GalNAca-Sp14 | 1547 | 30 | 10 | 1643 | 36 | 12 | 617 | 67 | 5 | 118 | 34 | 2 | 6 |
| 203 | Neu5Aca2-8Neu5Aca2-8Neu5Aca2-3(GalNAcb1-4)Galb1-4Glcb-Sp0 | 1586 | 12 | 11 | 1238 | 27 | 9 | 476 | 49 | 4 | 5 | 114 | 0 | 4 |
| 202 | Neu5Aca2-8Neu5Aca2-8Neu5Aca2-8Neu5Aca2-3(GalNAcb1-4)Galb1-4Glcb-Sp0 | 1401 | 17 | 10 | 1101 | 9 | 8 | 309 | 61 | 3 | 98 | 79 | 2 | 4 |
| 257 | Neu5Gca2-3Galb1-4GlcNAcb-Sp0 | 1345 | 45 | 9 | 994 | 25 | 7 | 546 | 64 | 5 | 10 | 96 | 0 | 4 |
Footnotes
hPIV3 does not require trypsin (12, 13). Four 175-cm tissue culture flasks (about 200 mL medium) will generally yield sufficient virus for purification and glycan microarray analysis. 18 Probing Virus–Glycan Interactions Using Glycan Microarrays 265
A homemade system for a humidified chamber can be made using a lidded Petri Dish (150 mm in diameter), with wet paper towels in the bottom of the chamber and two parallel glass rods or cut plastic pipette on top of the moist paper towels as a “slide rack” to hold the slide off of the paper towels for incubation.
If buffers have been prepared ahead of time, they should be stored at 4°C and brought to room temperature before use.
The purified virus should be used at about 1.25 × 10⁵ HAU/mL. This corresponds to a dilution of 1:100 that gives an HA titer of 64 in the standard HA assay (14). An SDS-PAGE gel should be run prior to use to ensure the virus preparation has only virus proteins.
The amount of dye per amount of virus should be optimized for each virus to ensure sufficient labeling with no loss in biological activity. For viruses without hemagglutination or neuraminidase activity, amount of dye per amount of virus can be determined relative to total viral protein. Labeling is sufficient when the surface proteins are visible under UV light on an SDS gel.
To prepare and store the Alexa Fluor 488 reagent, dissolve 1 mg Alexa Fluor 488 in 1 mL 0.15 M saline and make 25 mL aliquots. Then use a speed-vac to dry the samples and store at −20°C until use. Reconstitute in 25 mL dH2O.
The buffers used for dilution can vary based on the sample. The glycan microarrays are very stable and can be used with any buffer or ionic strength in the pH range of 4–8.5. Since some glycans may be O-acetylated, buffers above pH 8 should be avoided when such glycans are being monitored. For example, some viruses are not stable in buffers containing calcium, magnesium, Tween, etc. In assays for endogenous viral neuraminidase activity, a sodium acetate based buffer at pH 5.5 is used with incubations at 37°C.
An appropriate final concentration should be determined experimentally for each virus preparation. This is accomplished empirically by preparing several dilutions; i.e. a twofold serial dilution down to 1:128 and applying an aliquot of the lowest dilution to the microarray, incubating for binding as described below and processing to determine amount of virus bound. Repeat this process on the same slide (to conserve glycan microarrays) until a constant value is reached for the strongest binding glycan. The dilution producing approximately half maximal binding will represent a concentration that is in a linear range of virus binding and is suitable for analysis.
Cy5-streptavidin is added to the slide and washed away before virus is added to visualize the biotin spots that are printed on 266 J. Heimburg-Molinaro et al. the glycan microarray, to locate the subarrays of glycans and perform the grid alignment, which is necessary for data analysis. If possible, the Cy5-streptavidin may be mixed in with the sample and incubated together on the microarray. Although the Cy5 and Alexa Fluor 488 do not interfere with each other, we apply the streptavidin prior to the virus to avoid any question about streptavidin interacting with the virus.
The Cy5 label on the streptavidin is one of several possible fluorophores. If the virus is labeled with Alexa Fluor 488, for example, two separate images are obtained, one scanned at 488 nm for binding of Alexa Fluor 488 and another for binding of Cy5 at an excitation wavelength of 633 nm.
The cover slip should be carefully removed to avoid damage to the glycan microarray printed surface. Harsh manipulations that would allow the edge of the cover slip to scratch the microarray surface must be avoided. An alternative to doing the analysis under a cover slip, which conserves sample, is to use a hydrophobic pen to surround the surface of the glass slide around the area of the printed glycan microarray prior to step 3. After the resulting hydrophobic barrier has dried, up to 1 mL of sample can be applied and retained within the barrier. Incubations can be carried out as described without a cover slip, but larger sample volumes are required. After incubation, the sample can be drained off and the slide can be washed with a gentle stream of buffer from a plastic squeeze bottle prior to washing as described in step 13.
The incubation for influenza virus on the glycan microarray is typically performed at 4°C to eliminate the possibility of interference by the activity of the viral neuraminidase. However, if this is not a concern, or if the neuraminidase activity is to be studied, the experiment can be performed at room temperature or 37°C.
The image analysis is individual to each scanner and software. Different systems may have different methods for performing these steps, and the instructions for individual scanners and software should be followed.
References
- 1.Varki A, Cummings RD, Esko JD, Freeze HH, Stanley P, Bertozzi CR, Hart GW, Etzler ME. Essentials of Glycobiology. 2nd. Cold Spring Harbor Laboratory Press; Cold Spring Harbor, N.Y.: 2009. [PubMed] [Google Scholar]
- 2.Nicholls JM, Chan RWY, Russell RJ, Air GM, Peiris JSM. Evolving complexities of influenza virus and its receptors. Trends Microbiol. 2008;16:149–157. doi: 10.1016/j.tim.2008.01.008. [DOI] [PubMed] [Google Scholar]
- 3.Stevens J, Blixt O, Glaser L, Taubenberger JK, Palese P, Paulson JC, Wilson IA. Glycan microarray analysis of the hemagglutinins from modern and pandemic influenza viruses reveals different receptor specificities. J Mol Biol. 2006;355:1143–1155. doi: 10.1016/j.jmb.2005.11.002. 18 Probing Virus–Glycan Interactions Using Glycan Microarrays 267. [DOI] [PubMed] [Google Scholar]
- 4.Viswanathan K, Chandrasekaran A, Srinivasan A, Raman R, Sasisekharan V, Sasisekharan R. Glycans as receptors for influenza pathogenesis. Glycoconj J. 2010;27:561–570. doi: 10.1007/s10719-010-9303-4. [DOI] [PMC free article] [PubMed] [Google Scholar]
- 5.Blixt O, Head S, Mondala T, Scanlan C, Huflejt ME, Alvarez R, Bryan MC, Fazio F, Calarese D, Stevens J, Razi N, Stevens DJ, Skehel JJ, van Die I, Burton DR, Wilson IA, Cummings R, Bovin N, Wong CH, Paulson JC. Printed covalent glycan array for ligand profiling of diverse glycan binding proteins. Proc Natl Acad Sci U S A. 2004;101:17033–17038. doi: 10.1073/pnas.0407902101. [DOI] [PMC free article] [PubMed] [Google Scholar]
- 6.Amonsen M, Smith DF, Cummings RD, Air GM. Human parainfluenza viruses hPIV1 and hPIV3 bind oligosaccharides with alpha2-3-linked sialic acids that are distinct from those bound by H5 avian influenza virus hemagglutinin. J Virol. 2007;81:8341–8345. doi: 10.1128/JVI.00718-07. [DOI] [PMC free article] [PubMed] [Google Scholar]
- 7.Kumari K, Gulati S, Smith DF, Gulati U, Cummings RD, Air GM. Receptor binding specificity of recent human H3N2 influenza viruses. Virol J. 2007;4:42. doi: 10.1186/1743-422X-4-42. [DOI] [PMC free article] [PubMed] [Google Scholar]
- 8.Gulati S, Smith DF, Air GM. Deletions of neuraminidase and resistance to oseltamivir may be a consequence of restricted receptor specificity in recent H3N2 influenza viruses. Virol J. 2009;6:22. doi: 10.1186/1743-422X-6-22. [DOI] [PMC free article] [PubMed] [Google Scholar]
- 9.Lepenies B, Seeberger PH. The promise of glycomics, glycan arrays and carbohydrate-based vaccines. Immunopharmacol Immunotoxicol. 2010;32:196–207. doi: 10.3109/08923970903292663. [DOI] [PubMed] [Google Scholar]
- 10.Liang CH, Wu CY. Glycan array: a powerful tool for glycomics studies. Expert Rev Proteomics. 2009;6:631–645. doi: 10.1586/epr.09.82. [DOI] [PubMed] [Google Scholar]
- 11.Disney MD, Seeberger PH. The use of carbohydrate microarrays to study carbohydrate-cell interactions and to detect pathogens. Chem Biol. 2004;11:1701–1707. doi: 10.1016/j.chembiol.2004.10.011. [DOI] [PubMed] [Google Scholar]
- 12.Liu C, Eichelberger MC, Compans RW, Air GM. Influenza type A virus neuraminidase does not play a role in viral entry, replication, assembly, or budding. J Virol. 1995;69:1099–1106. doi: 10.1128/jvi.69.2.1099-1106.1995. [DOI] [PMC free article] [PubMed] [Google Scholar]
- 13.Henrickson KJ. Human Parainfluenza Viruses. In: Lennette EH, Lennette DA, Lennette ET, editors. Diagnostic Procedures for Viral, Rickettsial, and Chlamydial Infections. American Public Health Association; Washington, DC: 1995. pp. 481–494. [Google Scholar]
- 14.WHO Manual on Animal Influenza Diagnosis and Surveillance, World Health Organization.