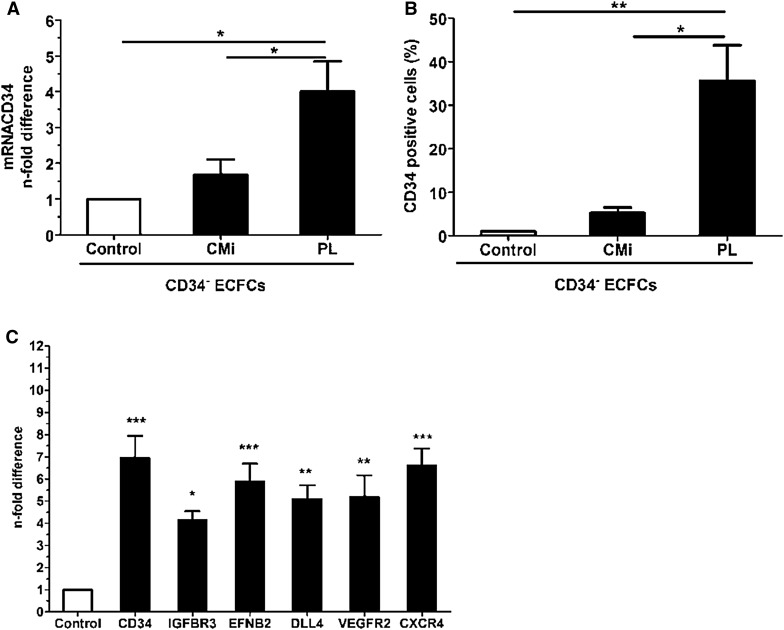
Fig. 2.
Expression of CD34 in CD34+ and CD34− PB-ECFCs fractions after magnetic separation. a CD34 mRNA levels in CD34− ECFCs after cell culture in PL-EGM or CMi. Open bar depicts the CD34 mRNA levels in CD34− ECFCs obtained after separation and prior the seeding in PL-EGM or CMi. Closed bars represent CD34 mRNA levels in CD34− CMi and CD34− PL cells after 6 days in cell culture. b Flow cytometry evaluation of the number of CD34+ cells in CD34− ECFCs cultures expanded in CMi or PL-EGM. Data are expressed as mean ± SEM percentage of cells positive for CD34 in the cell cultures expanded either in CMi or PL-EGM (closed bars). The control CD34− cells are depicted with open bar. c mRNA levels of genes associated with tip-cell phenotype in CD34+ and CD34− PB-ECFCs obtained after magnetic separation of CD34− PL. Open bar depict mRNA levels of tip-cell associated genes in CD34− cells, while closed bars represent mRNA levels of same genes in CD34+ cells

