

Abstract
Membrane fusion and fission are vital to eukaryotes’ life1–5. For three decades, it has been proposed that fusion is mediated by fusion between proximal leaflets of two bilayers (hemi-fusion) that produces a hemi-fused structure, followed by fusion between distal leaflets, whereas fission is via hemi-fission, which also produces a hemi-fused structure, followed by full fission1, 4, 6–10. This hypothesis remained unsupported owing to the lack of observation of hemi-fusion/hemi-fission in live cells. A competing fusion hypothesis involving protein-lined pore formation has also been proposed2, 11–15. Using confocal and super-resolution STED microscopy, we observed the hemi-fused Ω-shaped structure for the first time in live cells, neuroendocrine chromaffin cells and pancreatic β-cells. This structure was generated from fusion pore opening or closure (fission) at the plasma membrane. Unexpectedly, its transition to full fusion or fission was determined by competition between fusion and calcium/dynamin-dependent fission mechanisms, and was surprisingly slow (seconds to tens of seconds) in a significant fraction of the events. These results provide key missing evidence over the past three decades proving the hemi-fusion and hemi-fission hypothesis in live cells, and reveal the hemi-fused intermediate as a key structure controlling fusion/fission, as fusion and fission mechanisms compete to determine its transition to fusion or fission.
Chromaffin cells were transfected with EGFP-tagged phospholipase Cδ1 PH domain (PH-EGFP), bathed with cell-impermeable Atto 655 (A655), and stimulated with 1 s depolarization (from −80 to +10 mV, depol1s), which induced calcium currents (ICa) and capacitance (Cm) changes reflecting exo- and endocytosis (Fig. 1a). PH-EGFP binds specifically to PtdIns(4,5)P2 (PIP2)16, a phospholipid located at the cytoplasm-facing (PMcyto), but not extracellular facing leaflet (PMextra) of the plasma membrane (PM) or the cytoplasm-facing or lumen-facing leaflet of the vesicular membrane (VMcyto or VMlumen)17. Accordingly, PH-EGFP labels PMcyto in chromaffin cells18 (see also Fig. 1b, n =16; Extended Data Figure 1a–b). Diffusion of PIP2-bound PH-EGFP from PMcyto to VMcyto may indicate PMcyto-VMcyto fusion, whereas A655 labels opened Ω-profiles19.
Figure 1. Confocal imaging of hemi-fusion.

a, Left: recording configuration. Right: depol1s-induced ICa and Cm. b, Confocal PH-EGFP images at the cell bottom or center (~2 µm above bottom). c, Confocal cell-bottom PH-EGFP and A655 images at 1 s before and 3 s after depol1s. d–f, FPH, F655 and confocal cell-bottom images (at times indicated with lines) for same-onset (d), PH-earlier (e) and PH-only (f) spots. Drawings show vesicular structures at times indicated by lines. These settings apply to all related plots. g, Percentage (mean + s.e.m.) of same-onset, PH-earlier, and PH-only spots (16 cells, 401 spots) and distribution of PH-655 interval (interval between FPH and F655 rise onset, binning: 0.1–0.2 s, 0.2–0.4 s, …). h, PM-GFP fluorescence (FPM), F655 and images for same-onset (left, representative of 62 spots), PM-GFP-earlier (middle, representative of 24 spots) and PM-GFP-only (right, representative of 26 spots) spots. i, Percentage of same-onset, PM-GFP-earlier, and PM-GFP-only spots (mean + s.e.m., 7 cells, 112 spots). j–k, FPH-mCh, FVAMP2 and images for same-onset (j) and PH-earlier (k) spots. l, FPH-mCh, FVAMP2 and images showing repeated FPH-mCh increases. Images in b, c, d, e, f, j, k, and l are representative of 16, 16, 224, 40, 137, 52, 26 and 11 images, respectively.
Confocal imaging of PH-EGFP and A655 (PH-EGFP/A655) at XY plane with a fixed Z plane ~100 nm above cell-bottom (XY/Zfix imaging, Extended Data Fig. 1c–d) revealed A655 spots (25.1 ± 3.9 per cell, 16 cells) induced by depol1s19, 98% of which were accompanied by PH-EGFP fluorescence (FPH) increase (Fig. 1c). FPH rise τ (417 ± 31 ms) was slower than A655 fluorescence (F655) increase (122 ± 16 ms, n = 69 spots randomly selected, Fig. 1d). A655 spots without FPH increase was due to Ω-profile shrinking and merging faster than FPH rise19 (Extended Data Fig. 1e).
At our imaging time resolution of 33–100 ms, FPH increased at the same onset as F655 increase (termed same-onset spots, Fig. 1d, Supplementary video 1, 224 spots), or 0.1–26 s (8.0 ± 1.5 s, 40 spots) earlier (termed PH-earlier spots, Fig. 1e, Extended Data Fig. 1f, Supplementary video 2). We also observed PH-EGFP spots without F655 increase, but with size and FPH similar to same-onset or PH-earlier spots (termed PH-only spots, Fig. 1f, Supplementary video 3, 137 spots, 16 cells, Extended Data Fig. 1g). Since PH-EGFP and A655 report PMcyto-VMcyto fusion and full-fusion, respectively, depol1s-induced same-onset (54 ± 6%), PH-earlier (14 ± 5%), and PH-only spots (32 ± 5%, 16 cells, Fig. 1g, Extended Data Table 1) may correspond to full-fusion, hemi-fusion then full-fusion, and hemi-fusion, respectively. This conclusion was further strengthened by the following six sets of evidence.
First, when PH-EGFP was replaced with GFP tagged to Lyn kinase’s myristoylation and palmitoylation sequence (PM-GFP) that is targeted to PMcyto20 (Extended Data Fig. 2a), PM-GFP/A655 imaging revealed same-onset, PM-GFP-earlier, and PM-GFP-only spots analogous to PH-EGFP/A655 imaging results (Fig. 1h–i, Extended Data Table 1). Similarly, replacing PH-EGFP with CAAX-EGFP, a motif targeted to PMcyto via its cysteine residue isoprenylation21 (Extended Data Fig. 2b), revealed same-onset, CAAX-EGFP-earlier, and CAAX-EGFP-only events (Extended Data Fig. 2c–e). Thus, PH-EGFP-reported hemi-fusion (PMcyto-VMcyto fusion) is independent of PIP2.
Second, FPH increase was not due to lipid transport from nearby vesicles or endoplasmic reticulum (ER), because 1) lipid transport (minutes)22 is much slower than FPH increase (Fig. 1d–f), 2) PH-EGFP (or PH-mCherry or PH-YFP) labelled only PM, but not vesicles (Fig. 1b, Extended Data Fig. 3a–b) or ER (Extended Data Fig. 3c–d), and 3) FPH increase was independent of ER location (Extended Data Fig. 3e–f).
Third, in cells transfected with PH-mCherry and pH-sensitive VAMP2-pHluorin, depol1s induced VAMP2-pHluorin spots with PH-mCherry fluorescence (FPH-mCh) increase at the same onset (Same-onset, 52 spots, 72 ± 6%, n=11 cells, Fig. 1j) or 6.7 ± 1.4 s earlier (PH-earlier, 26 spots, 28 ± 6%, Fig. 1k), analogous to PH-EGFP/A655 imaging results. Since VAMP2-pHluorin fluorescence (FVAMP2) increase is due to proton (molecular weight: 1 Dalton, hydrated proton: ~0.1 nm) and OH− (molecular weight: 17 Dalton) exchange via an open pore23, PH-earlier spots (before FVAMP2 increase) could not permeate the smallest molecules. Thus, PH-earlier events were not due to an opened pore too small to permeate A655 (molecular weight: 528 Dalton), but reflected hemi-fusion followed by full-fusion. Although PH-mCherry-only spots were also observed, it could be due to lack of VAMP2-pHluorin expression. However, infrequently, FPH-mCh increased and decreased without FVAMP2 changes, and then increased to the previous level with FVAMP2 increase (Fig. 1l, n = 11 spots), suggesting sequential transition of hemi-fusion, fission (FPH-mCh decay, described later), and full-fusion.
Fourth, stimulated emission depletion (STED) imaging of PH-EGFP and Alexa 532 (A532) in the XZ plane with a fixed Y plane (XZ/Yfix scanning; Extended Data Fig. 1d) directly revealed depol1s-induced same-onset (53%, Fig. 2a), PH-earlier (12%, Fig. 2b) and PH-only Ω-profiles (34%, Fig. 2c; total Ω-profile number: 108, 35 cells). The Ω-profile diameter at the fusion onset (318 ± 28 nm, n = 63 Ω-profiles with clear edges) was similar to granule diameter (~300 nm)24. Ω-profile PH-EGFP fluorescence was often brighter than PM (Fig. 2a–c). Simulation suggests that this is due to neighbouring fluorescence contribution from the Ω-profile in the Z-axis direction (Extended Data Fig. 4). Scanning every ~50 ms showed that FPH increase near the Ω-profile base (near PM) was earlier than the top (far from PM) by 111 ± 9 ms (n = 11 Ω-profiles, Fig. 2d), indicating PIP2 diffusion from the PM to Ω-profile.
Figure 2. STED imaging of hemi-fused Ω-profile.

a–c, STED XZ images of PH-EGFP and A532 for same-onset (a), PH-earlier (b), and PH-only Ω-profile (c). Labelled times are relative to depol1s onset (applies to a–g). Cytosol, PM, bath, and coverslip location are labelled in a. d, FPH (A.U., arbitrary unit) from three regions of a depol1s-induced Ω-profile imaged every 46 ms at STED XZ/Yfix setting. e–g, STED XZ images of PH-mCherry and mCLING-A488 for same-onset (e, representative of 53 Ω-profiles) and PH-only Ω-profiles with undetectable (f) and detectable gap at the neck region (g, arrowhead). g, right panels: reconstructed XY images across the center (upper) or the neck (lower) of the Ω-profile. Data were collected with XZ/Ystack scanning every ~5–10 s. h, Electron microscopic tomograph of a hemi-fused structure (box enlarged below, see also Extended Data Fig. 5). Images in a-h are representative of 57, 13, 38, 11, 53, 16, 5, and 5 images, respectively.
Fifth, we applied mCLING-Atto 488 (membrane-binding fluorophore-cysteine-lysine-palmitoyl group, mCLING-A488) to the bath, which inserted into and thus labelled PMextra25. mCLING fluorescence increased in nearly all A655 spots (not shown), suggesting that mCLING labels fully fused Ω-profiles. STED XZ imaging of mCLING-A488/PH-mCherry revealed same-onset Ω-profiles (labelled with mCLING and PH-mCherry, Fig. 2e) and PH-only Ω-profiles (labelled with only PH-mCherry, n = 16, Fig. 2f, g). Some PH-only Ω-profiles exhibited an open neck (n = 5, Fig. 2g), consistent with a hemi-fused diaphragm. By repeating XZ scanning every 100 nm along the Y-axis for 1–2 µm (XZ/Ystack scanning), we reconstructed XY-plane images showing a smaller ring across the Ω-profile neck and a larger ring across the Ω-profile center (Fig. 2g). 5 out of 16 PH-only Ω-profiles showed a detectable open neck of 70–130 nm (Fig. 2g). These results directly demonstrate the hemi-fused Ω-profile by differential labelling of PMcyto and PMextra.
Sixth, during high potassium application, which induced PH-only and close-fusion events (n = 8 cells, Extended Data Fig. 5a–b), electron microscopic examination of ~800 granules close to the PM (< 30 nm, Extended Data Fig. 5c) revealed 28 granules (~3.5%) in tight contact with PM (Extended Data Fig. 5d). Electron tomography revealed no PMcyto–VMcyto connection in 6 tight-contacts (Extended Data Fig. 5e), potential PMcyto–VMcyto connection in 7 tight-contacts (Extended Data Fig. 5f), and evident PMcyto–VMcyto connection in 5 tight-contacts (Fig. 2h, Extended Data Fig. 5g) similar to hemi-fusion candidates reported in cells26, 27. These results support live-cell detection of the hemi-fused structure.
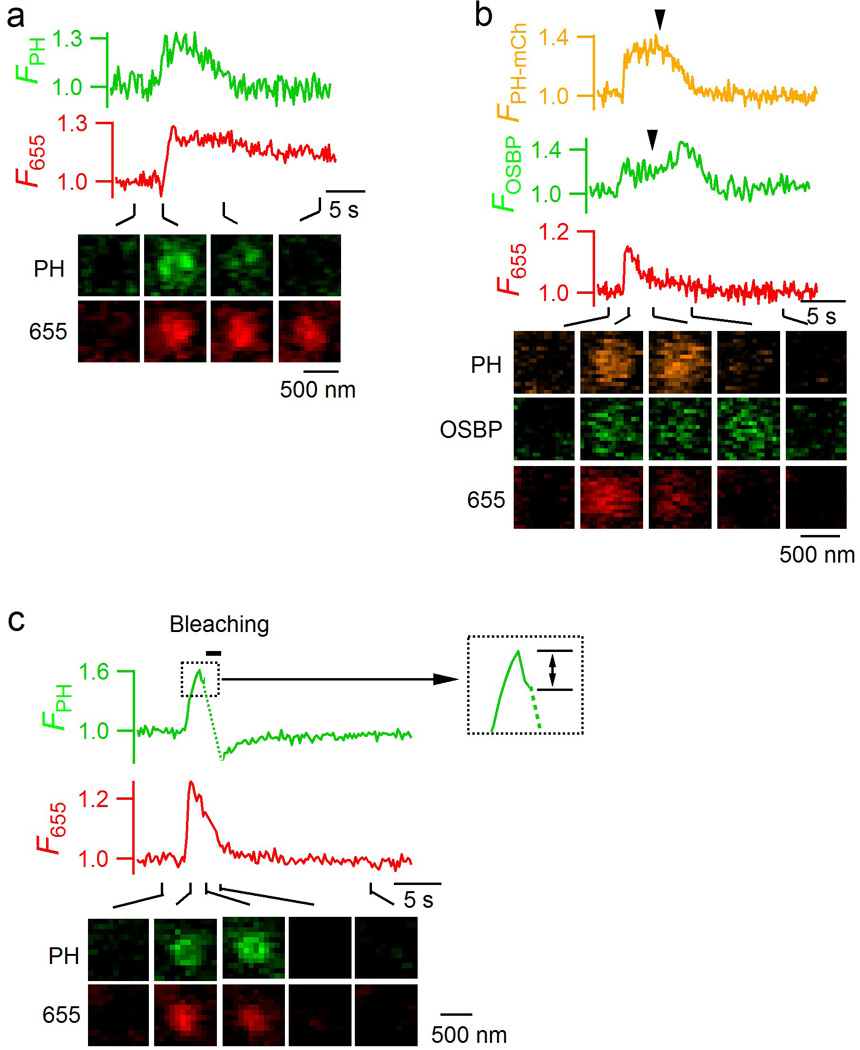
Next, we studied fission during fusion pore closure (Fig. 3a–i). Full-fusion-generated Ω-profiles may maintain an open pore (stay fusion), close the pore (close fusion) or shrink to merge with PM (Ω-shrink fusion)19. With strong A655 excitation, A655 spots persisted during stay fusion (Fig. 3a, n = 33 spots), dimmed while maintaining a constant size after pore closure (close fusion) that prevented bleached A655 exchange with extracellular fluorescent A655 (Fig. 3b–c), and dimmed rapidly while spot size reduced during Ω-shrink fusion19 (Extended Data Fig. 1e). At confocal cell-bottom PH-EGFP/A655 image setting, depol1s induced close-fusion (5.2 ± 1.0 spots per cell, n = 10 cells) where F655 decayed while FPH remained unchanged for > 40 s (24 spots, 46%, Fig. 3b) or decayed 4.9 ± 1.0 s after pore closure (F655 decay onset) with a τ of 5.5 ± 1.0 s (28 spots, 54%, Fig. 3c, 3i). Similar FPH patterns were observed when pore closure was detected by VAMP2-pHluorin imaging, where FVAMP2 increase and decrease reflect pore opening and closure/re-acidification, respectively (Extended Data Fig. 6). They were also observed with STED XZ/Yfix imaging of PH-EGFP/A532 (strong A532 excitation), where A532 fluorescence (F532) dimming reflected pore closure (Fig. 3d–f; stay-fusion, 30 spots; close-fusion with no FPH decay, 10 spots; close-fusion with delayed FPH dimming, 8 spots).
Figure 3. Hemi-fission pathway.

a–c, FPH, F655 and confocal cell-bottom images of stay-fusion (a) and close-fusion without (b) or with (c) FPH decay. d–f, Similar to a-c, respectively, but with STED XZ/Yfix imaging of PH-EGFP/A532. g–h, FPH (excited with 1.5% laser power), F655 and confocal images of stay-fusion (g) or close-fusion (h) subjected to 1 s PH-EGFP bleaching (bar, 100% laser power). Drawings in a–b apply to g–h, respectively. i, FPH dwell time (interval between F655 and FPH decay onset) distribution for close-fusion spots (42 spots, 10 cells). j, FPH, F655 and confocal images for close-fusion with pore reopened (F655 increased again). FPH recovered after 1 s bleaching, indicating PMcyto-VMcyto connection after F655 decay (pore closure). Reappearance of F655 indicated pore reopening, suggesting the transition from the hemi-fused structure to full fusion. k, FPH, F655 and confocal images for a PH-only spot with eventual FPH decay. Images in a, b, c, d, e, f, g, h, j, and k are representative of 33, 24, 28, 30, 10, 8, 22, 28, 4, and 80 images, respectively.
FPH decay after F532 or F655 dimming was not due to vesicle movement, because as FPH decayed, the PH-EGFP-labelled Ω-profile dimmed, but did not move (Fig. 3f, n = 8 spots), and A655 spots remained unchanged if excited minimally to avoid bleaching (Extended Data Fig. 7a, 22 spots). While FPH decayed, the fluorescence of a PI(4)P probe increased (Extended Data Fig. 7b, 13 spots), suggesting PIP2 conversion to PI(4)P, which may explain why PIP2 is not detected in resting vesicles (Fig. 1b, Extended Data Fig. 3a)18.
FPH decay must reflect PMcyto-VMcyto fission that prevents PH-EGFP diffusion from PMcyto to VMcyto. The interval between F655 decay (or F532 decay, pore closure) and FPH decay may reflect the lifetime of the hemi-fused Ω-profile generated by hemi-fission (PMextra-VMlumen fission). To test this, we applied a high laser power (100%, 1 s) 5 s after depol1s to photo-bleach PH-EGFP in a small area. Bleached PH-EGFP recovered during stay-fusion, due to fluorescent PH-EGFP diffusion through the PMcyto-VMcyto connection (Fig. 3g, n = 22 spots, 11 cells). Bleached PH-EGFP recovered after close-fusion with no FPH decay in 28 out of 37 spots (76%, 11 cells, Fig. 3h), suggesting a PMcyto-VMcyto connection after pore closure, i.e., hemi-fission. FPH did not recover in 9 close-fusion spots, suggesting PMcyto-VMcyto fission after pore closure, i.e., full-fission. Full-fission in these spots likely occurred during or right before bleaching, because FPH did not recover in two close-fusion spots, where FPH started to decrease right before bleaching (Extended Data Fig. 7c). Thus, the interval between F655 and FPH dimming reflected hemi-fission intermediate lifetime (Fig. 3i).
Occasionally (4 out of 28 spots), the hemi-fission intermediate returned to full-fusion status, reflected as F655 decay (pore closure) and then increase while FPH remained elevated and could recover if being bleached (Fig. 3j). Not only the hemi-fission intermediate (Fig. 3c, f), but also the hemi-fusion intermediate could proceed to full-fission, reflected as FPH decay after dwelling for 8.6 ± 1.1 s in 80 out of 137 PH-only spots (n=16 cell, Fig. 3k, see also Fig. 1l).
Summarized in Fig. 4a, hemi-fused Ω-profiles were generated by hemi-fusion (Fig. 1f, 2c, 2f–g) or hemi-fission (Fig. 3b, e, h), and proceeded to full-fusion (Fig. 1e, 1k, 2b, 3j; Extended Data Fig. 1f) or full-fission (Fig. 3c, f, k) in chromaffin cells. Similar transitions were observed with PH-EGFP/A655 imaging in rat pancreatic β cells (24 INS-1 cells, 179 fusion spots, Extended Data Fig. 8), suggesting wider applications of our observations.
Figure 4. Calcium/dynamin-dependent fission competes with fusion to determine hemi-to-full-fusion transition.

a, Schematic drawing of structural transitions during fusion pore opening and closure. b, PH-only and full-fusion (same-onset plus PH-earlier) percentage plotted versus close-fusion percentage (left, one cell for one circle, line fit, r = 0.56, 24 cells) or ICa (right, mean ± s.e.m.). Close-fusion percentage is relative to full-fusion. c–e, Close-fusion percentage (left, mean + s.e.m., per cell) or percentage of same-onset, PH-earlier, and PH-only spots (right, mean + s.e.m., per cell) in Ctrl (c, 19 cells) or during dynasore application (c, 23 cells); with overexpressed empty vector (d, 21 cells) or dynamin 1 K44A mutant (Dyn 1-K44A, d, 23 cells); and with transfected siRNA control (si-Ctrl, e, 24 cells) or dynamin 1/2 siRNA (si-Dyn, e, 24 cells). ***: p < 0.0001 (left, two-sided t test; right, ANOVA). f, PH-only and full-fusion (same-onset plus PH-earlier spots) percentage (mean ± s.e.m., per cell) plotted versus close-fusion percentage (mean ± s.e.m., data obtained from c-e). Cell number for each group is written in c–e. g, STED XZ images of dynamin 1-EGFP and A532 before and 3 s after depol1s (representative of 11 images).
The schematics in Fig. 4a suggest that hemi-fission (PMextra-VMlumen fission) counteracts hemi-to-full-fusion transition. Consistent with this suggestion, as close-fusion or ICa that triggers close-fusion19 increased, PH-only events reflecting hemi-fusion (not hemi-fission) increased, whereas full-fusion (including same-onset and PH-earlier events) percentage decreased (Fig. 4b, Extended Data Table 1), likely due to increased hemi-fission that counteracts hemi-to-full-fusion transition. Inhibition of dynamin by dynasore, overexpressed dynamin dominant-negative mutant Dynamin 1-K44A, or dynamin 1 and 2 knockdown (Extended Data Fig. 9a–b) substantially reduced depol1s-induced close-fusion and PH-only percentage without affecting ICa, but increased same-onset percentage (Fig. 4c–e, Extended Data Fig. 9c–e, Extended Data Table 1). Thus, inhibition of dynamin-dependent close-fusion may reduce PH-only events, but increase full-fusion percentage (Fig. 4f, Extended Data Fig. 9f) by inhibiting hemi-fission that counteracts hemi-to-full-fusion transition. Dynamin 1-EGFP puncta were observed at PM (Extended Data Fig. 9g, Fig. 4g) and co-localized with 11 out of 16 depol1s-induced A532 spots at the Ω-profile pore region (Fig. 4g, 10 cells), suggesting that dynamin is physically available before fusion to counteract hemi-to-full-fusion transition. Insufficient dynamin 1-EGFP expression and endogenous dynamin might explain the lack of dynamin-EGFP in remaining spots.
In summary, by developing STED- and confocal-based methods, we resolved PMcyto-VMcyto and PMextra-VMlumen fusion/fission in live chromaffin and pancreatic β cells, and discovered the hemi-fused Ω-profile as the structural pathway to fusion and fission. The hemi-fused Ω-profile generated by hemi-fusion or hemi-fission is a key structure controlling fusion and fission. It proceeds to full-fusion or full-fission depending on the net outcome of competition between fusion and calcium/dynamin-dependent fission mechanisms (Fig. 4a).
Lacking direct live-cell evidence, whether fusion is mediated via forming a protein-lined pore2, 11–13, 15 or through hemi-fusion1, 6–8 has been intensely debated. The hemi-fusion hypothesis remains to be proved with evidence showing sequential transition from intact vesicle to hemi-fusion and then to full-fusion. The present work reveals this sequential transition in live cells and thus proves the hemi-fusion hypothesis. Studies interpreting fusion pore regulation by SNARE proteins as SNARE-lined pore in PC12 and chromaffin cells2, 11–15 may be re-interpreted under the hemi-fusion framework to gain new insight.
Hemi-fused vesicles were proposed as release-ready vesicles in cortical synapses28 (but see Ref. 29) and sea urchin eggs30, whereas reconstituted vesicle-vesicle fusion starts from vesicle contact to either full-fusion8, possibly via hemi-fusion too transient to detect, or to hemi-fused diaphragms that do not or are highly reluctantly to proceed to full-fusion7, 8. We observed not only transitions (same-onset or PH-only events) analogous to those observed in reconstituted vesicle-vesicle fusion, but also many other dynamic reversible transitions, including from intact vesicle to a hemi-fused structure for 0.1–26 s and then to full-fusion or back to intact vesicle, and from fully-fused Ω-profile to a hemi-fused structure for various times and then to intact vesicle or back to fully fused Ω-profile (Fig. 4a). These differences may reflect differential protein and lipid composition in cells and reconstituted systems.
Hemi-fission was proposed based on simulation and conductance measurements from artificially pulled lipid nanotube3, 4, 9. Here we provided the first evidence showing hemi-fission as the pathway to fission during fusion pore closure in live cells. Unexpectedly, the hemi-fission intermediate had a long lifetime, ranging from <1 s to > 40 s, before proceeding to full-fission or full-fusion (Fig. 3). Fission in live cells is therefore composed of two kinetically distinguishable steps, hemi-fission (PMextra-VMlumen fission) and full-fission (PMcyto-VMcyto fission).
We found surprisingly that dynamin-dependent fission mechanisms compete with fusion mechanisms at the hemi-fused state before full-fusion occurs to counteract the hemi-to-full-fusion transition. Such a competition is sometimes observed in real time; the sequential observation of full-fusion, hemi-fission, and back to full-fusion (Fig. 3j) may explain the widely observed capacitance flickers, repeated fusion pore opening and closure5, 24. Regulation of fission mechanisms may thus regulate fusion efficiency.
Hemi-fusion and hemi-fission were studied mostly in reconstituted membranes different from cells in molecular composition and geometry. To what extent these studies apply to cells is unclear. Our work provides the foundation and techniques to further study hemi-fusion and hemi-fission in live cells.
Methods
Cell culture
We prepared primary chromaffin cell culture as described previously19. In brief, fresh adult (21 – 27 months old) bovine adrenal glands (from a local abattoir), were immersed in pre-chilled Lock’s buffer on ice containing: NaCl, 145 mM; KCl, 5.4 mM; Na2HPO4, 2.2 mM; NaH2PO4, 0.9 mM; glucose, 5.6 mM; HEPES, 10 mM (pH 7.3, adjusted with NaOH). Glands were perfused with Lock’s buffer, then infused with Lock's buffer containing collagenase P (1.5 mg/ml, Roche), trypsin inhibitor (0.325 mg/ml, Sigma) and bovine serum albumin (5 mg/ml, Sigma), and incubated at 37°C for 20 min. The digested medulla was minced in Lock’s buffer, and filtered through a 100 µm nylon mesh. The filtrate was centrifuged (48 ×g, 5 min), re-suspended in Lock’s buffer and re-centrifuged until the supernatant was clear. Final cell pellet was re-suspended in pre-warmed DMEM medium (Gibco) supplemented with 10% fetal bovine serum (Gibco) and plated onto poly-L-lysine (0.005 % w/v, Sigma) and laminin (4 µg/ml, Sigma) coated glass coverslips. The cells were incubated at 37°C with 9% CO2 and used within 1 week. Before plating, some cells were transfected by electroporation using Basic Primary Neurons Nucleofector Kit (Lonza), according to the manufacturer’s protocol. The INS-1 cell line was purchased from AddexBio (San Diago, USA).
Electrophysiology
At room temperature (22 – 24°C), whole-cell voltage-clamp and capacitance recordings were performed with an EPC-10 amplifier together with the software lock-in amplifier (PULSE, HEKA, Lambrecht, Germany)19, 31. The holding potential was −80 mV. The frequency of the sinusoidal stimulus was 1000 – 1500 Hz with a peak-to-peak voltage ≤ 50 mV. The bath solution contained 125 mM NaCl, 10 mM glucose, 10 mM HEPES, 5 mM CaCl2, 1 mM MgCl2, 4.5 mM KCl, 0.001 mM TTX and 20 mM TEA (pH 7.3, adjusted with NaOH). The pipette (2 – 5 MΩ) solution contained 130 mM Cs-glutamate, 0.5 mM Cs-EGTA, 12 mM NaCl, 30 mM HEPES, 1 mM MgCl2, 2 mM ATP, and 0.5 mM GTP, pH 7.2 adjusted with CsOH. These solutions pharmacologically isolated calcium currents.
Setup and parameters for confocal and STED imaging
With an inverted confocal microscope (Nikon A1R, 60× oil objective, numerical aperture: 1.4), A655 (68 µM in bath, Sigma) and PH-EGFP were excited by a Diode laser at 640 nm (maximum power: 40 mW) and an Argon laser at 488 nm (maximum power: 50 mW), respectively. Unless mentioned otherwise, the 640 nm laser was set at 16% of the maximum power, whereas 488 nm laser was set at 1.5%. A655 and PH-EGFP fluorescence were collected with a photomultiplier at 650 – 720 nm and 500 – 550 nm, respectively. Both excitation and fluorescence collection were done simultaneously. VAMP2-pHluorin was imaged with the same setting as for PH-EGFP imaging. When PH-mCherry was used, it was excited with 561 nm laser (maximal power: 50 mW) at 3% maximal power. Confocal images were collected every 33 ms at 50 nm per pixel at the cell bottom (70–160 µm2).
STED images were acquired with Leica TCS SP8 STED 3× microscope that is equipped with a 100 × 1.4 NA HC PL APO CS2 oil immersion objective and operated with the LAS-AX imaging software. Excitation was with a tunable white light laser and emission was detected with hybrid (HyD) detectors. In time gated STED mode, PH-EGFP and A532 were sequentially excited with a tunable white light laser at 470 and 532 nm, respectively. The STED beam was generated by a 592 nm depletion beam. Similarly, mCLING-A488 and PH-mCherry were sequentially imaged, in this case excitation laser was set to 488 and 570 nm, respectively, STED beam was generated by a 660 nm depletion beam. All STED images were acquired in the XZ plane at the cell bottom that was attached to the coverslip, where a cross-sectional view of the cell and thereby fused vesicles could be observed. The STED images of PH-EGFP and A532 was acquired every 50–280 ms at 16 nm per pixel, in an XZ area of 19.4 µm×1.2 µm, with fixed Y plane. The probability of observing a fusion event induced by depol1s during XZ scanning (with a fix y-axis location) varied from 0 to 0.38 per cell depending on the number of fusion events induced by depol1s in the scanned region. To reconstruct the structure of fused vesicles, STED XZ images were also acquired with Y stacks at 100 nm interval for a total length of 1–2 µm. All STED images were deconvolved using Huygens software (Scientific Volume Imaging).
Image analysis
Confocal images were analyzed using NIS-Elements AR (Nikon). STED images were analyzed with ImageJ. The fluorescence intensity from an area covering the fluorescence spot was measured at every image frame. For images shown in figures, 5–15 frames were averaged. The full-width-half-maximum (WH) was measured from intensity profiles of 1 – 4 lines across the spot center.
For plot of fluorescence intensity, such as FPH and F655, we normalized the fluorescence intensity to the baseline in all figures. For calculation of the onset of spot F655 and FPH increase, we fit the 10–30% rising phase of F655 or FPH, and extrapolated the fit to the baseline. The time point at which the fit line crosses the baseline is the onset. Our sampling time was 33 ms in most experiments, but 100 ms for experiments where PH-EGFP was bleached. Thus, our time resolution was 33 – 100 ms. With this time resolution, spots with delay of F655 rise within 33 ms from the FPH rise onset could not be identified, which may lead to an underestimation of PH-EGFP spots with a delayed F655 rise. Similar analysis was applied to measure the onset of FPH-mCherry and FVMAP2 rise.
When A655 (strong excitation: 16% maximal power) and PH-EGFP (weak excitation: 1.5% maximal power) were imaged, fusion pore closure was identified if after A655 spot appeared, the spot F655 decayed to baseline with a time constant more than 2 s (~2–5 s) while the spot WH did not change. Another form of fusion, the Ω-shrink fusion, in which the fusion-generated Ω-profile shrinks until undetectable, could also cause F655 decay to baseline19. However, this decay is different from the decay caused by Ω-profile pore closure in three aspects. First, the decay time constant of nearly all Ω-shrink events is < 1.7 s19. Thus, a decay time constant of > 2s is a safe criteria for identifying fusion pore closure19. Second, Ω-shrink fusion is accompanied by a reduction of WH, whereas Ω-profile closure is not19. The WH can be measured from either A655 spot or PH-EGFP spot, the latter of which is often easier to measure because FPH often did not decrease in parallel with F655 during pore closure. Third, F655 and FPH decayed approximately in parallel during Ω-shrink fusion that reduces the size of Ω-profile till undetectable, but usually did not decay in parallel during fusion pore closure. After pore closure, there is often a delay of FPH decay due to the long lifetime of the hemi-fused structure generated by hemi-fission (Fig. 3i). A combination of these three criteria allowed us to clearly identify fusion pore closure events, as has been recently characterized extensively and confirmed with several other independent methods19.
Representative images were shown with 5–15 frame averages. Since the STED Z-resolution (~150 nm) is worse than the X-axis resolution (~65 nm), we measured the vesicle diameter on the X-axis direction for images obtained with STED XZ scanning. The vesicle at the Z-axis direction may appear elongated due to a lower Z-axis resolution.
Electron microscopy
Bovine chromaffin cells were stimulated for 2–10 minutes using a solution containing 30 mM KCl 115 mM NaCl, 10 mM glucose, 10 mM HEPES, 2 mM CaCl2, and 1 mM MgCl2 (pH 7.3, adjusted with NaOH). The cells were immediately fixed with 2% paraformaldehyde, 2% glutaraldehyde, and 1% tannic acid or 1% acrolein and 1% tannic acid for 30 min at room temperature. The results obtained from both fixation methods were undistinguishable. The cells were stained with 1% OsO4 for 1 hour, en bloc stained with 0.25–0.5% uranyl acetate in acetate buffer at pH 5.0 for 1 h at 4°C, and gradually dehydrated with increasingly pure solutions of ethanol (50%, 70%, 90%, and then 100%) before infiltration with ethanol as a diluent and embedding with Embed-812, then cured over night at 50°C and then at 60°C for 36 hours. The embedded samples were sectioned on an ultramicrotome with thicknesses of 50–70 nm. The resulting sections were placed on 400 mesh carbon coated copper grids.
Single images were collected at up to 73,000X magnification on a JEOL JEM-200CX, 120kV electron microscope with an AMT XR-100 CCD. Tilt-series were collected with SerialEM32 at 15,000X magnification on a JEOL 2100, 200kV electron microscope, with an Orius 832 CCD. Tilt-series were acquired at tilt increments of 1° from −70° to +70°. Tomographic reconstruction was performed using the IMOD software suite33 using patch-tracking or 10 nm gold fiducials for alignment, with slices of 1 nm thickness examined for hemi-fusion structures.
Data selection and statistics
The data within the first 2 min after whole-cell break-in were used to avoid whole-cell endocytosis rundown19, 34. The statistical test used is t test (two-sided) and ANOVA test. The data were expressed as mean ± s.e.m. Sample size was chosen based on our previous experience. The present work did not involve cell authentication, mycoplasma testing, randomization or blinding.
Extended Data
Extended Data Figure 1. Imaging with PH-EGFP to label plasma membrane and vesicle fusion.

a–b, PH-EGFP is not exposed to the extracellular side of the plasma membrane. Sampled cell with PH-EGFP fluorescence (a) and the mean PH-EGFP fluorescence intensity of three cells (b) subjected to a pH change from 7.4 to 5.5 in the bath solution. PH-EGFP fluorescence at pH of 5.5 was similar to that at pH of 7.4. But breaking the cell with a glass pipette led to a change in the intracellular pH to 5.5, resulting in the decrease of the PH-EGFP fluorescence (EGFP fluorescence is pH-sensitive). These results indicate that PH-EGFP is located at the cytoplasm-facing, but not the extracellularly facing leaflet of the plasma membrane. The images were obtained by confocal imaging at the cell bottom of cells transfected with PH-EGFP. Before data collection, we patched the cell by forming a giga-seal between the glass pipette and the cell. Data were then collected at pH of 7.4, and 5.5. Then, we broke the cell by pushing the glass pipette into the cell at pH of 5.5, which changed the intracellular pH to 5.5. The images in panel a were taken from one cell. We observed similar image results from another 2 cells. c, XY/Zfix imaging configuration. i, Orientation of microscopic X, Y and Z axis. The X and Y axis define the microscopic horizontal plane that is in parallel to the coverslip, and the plasma membrane (PM) attached to the cover slip, whereas the Z axis is vertical to the XY plane. The gray panel indicates the focal panel for XY scanning. ii, An Ω-profile attached to the PM is drawn (black). Its projection is shown in green in the gray panel. The location of PM is also labelled. iii, Similar to ii, but showing only the green projection in the gray panel, the theoretical XY image with perfect resolution. iv, Sampled XY image experimentally obtained by confocal XY/Zfix imaging. d, XZ/Yfix imaging configuration. Similar arrangements as panel c, except that XY/Zfix imaging is replaced with XZ/Yfix imaging. Sampled image in iv was obtained from STED XZ/Yfix imaging. e, Ω-shrink fusion can be too fast to be detected with PH-EGFP. FPH, F655 and sampled images (at times indicated by lines) from a spot undergoing Ω-shrink fusion, a recently found fusion form that shrinks the fusion-generated Ω-profile until undetectable19. The rate of shrinking for this spot was faster than diffusion of PH-EGFP from the plasma membrane to the fusion-generated Ω-profile, resulting in no detectable FPH increase. The images were obtained by confocal microscopy with 1.5% laser power for FPH and 16% laser power for F655 at the cell bottom. Fluorescence intensities were normalized to baseline. Images were representative of 8 Ω-shrink fusion spots. f, FPH, F655 and sampled images (at times indicated with lines) for a PH-earlier spot with a ~400 ms interval between the onset of FPH increase and F655 increase (two dotted lines). The results show a transient hemi-fusion to full-fusion transition. FPH and F655 are normalized to the baseline. Data were obtained with confocal XY/Zfix imaging at the cell bottom. The drawings illustrate the vesicle’s structural changes at times indicated by black lines. Images were representative of 5 fusion spots. g, The Full-Width-Half-Maximum (WH) and the PH-EGFP fluorescence intensity (FPH) for same-onset (264 spots from 16 cells), PH-earlier (40 spots), and PH-only spots (137 spots). FPH is plotted as mean + s.e.m. in arbitrary unit (A.U.). The results indicate a similar spot size and fluorescence intensity for the three fusion categories.
Extended Data Figure 2. Three categories of fusion are observed with fluorescent membrane probes independent of PIP2.
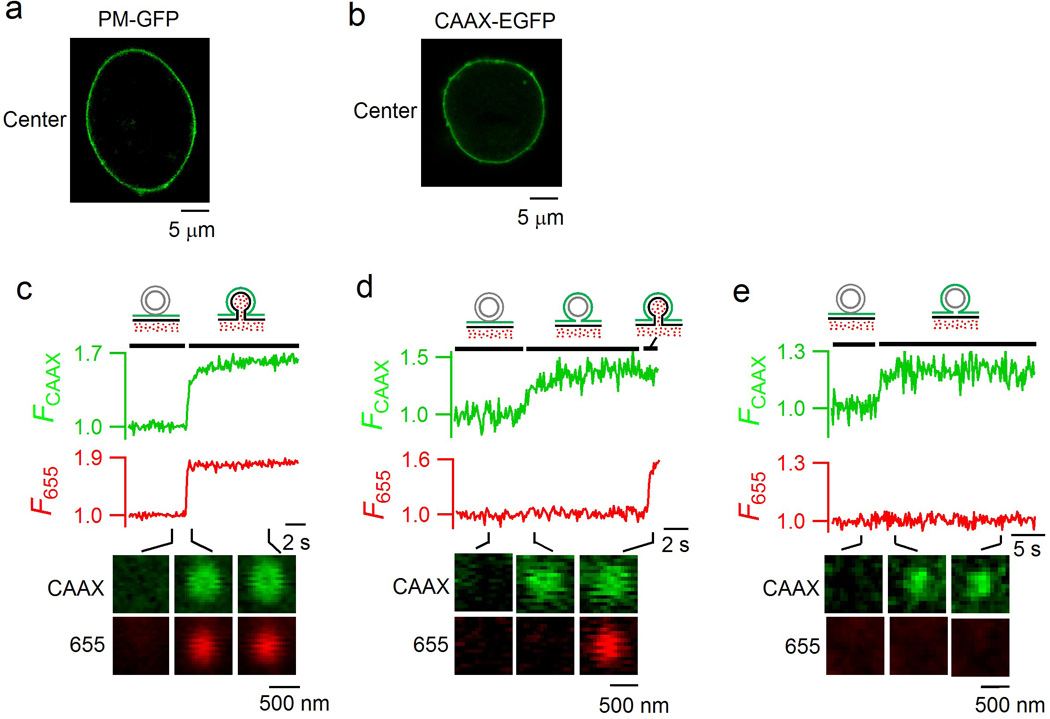
a, PM-GFP labels the plasma membrane. PM-GFP (GFP targeted to the plasma membrane by palmitoylation and myristoylation sequence from Lyn Kinase) image of a bovine chromaffin cell transfected with PM-GFP (focal plane at the cell center). PM-GFP predominantly labelled the plasma membrane of the cell. The image was representative of 13 cells imaged. b, CAAX-EGFP image of a bovine chromaffin cell transfected with CAAX-EGFP. The image was taken with a Z-axis focal plane at the cell center. CAAX-EGFP clearly labelled the cell plasma membrane. The image was representative of 15 cells imaged. c–e, Fluorescence intensity of CAAX-EGFP (FCAAX), F655 and the sampled images (at times indicated with lines) obtained at the cell bottom for three spots: Same-onset spot in which FCAAX and F655 increased with the same onset (c, representative of 97 spots), CAAX-earlier spot in which the onset of FCAAX increase preceded the onset of F655 increase (d, representative of 30 spots), and CAAX-only spot in which FCAAX increased without any change in F655 (e, representative of 39 spots). Fluorescence intensities were normalized to baseline. Cells were transferred with CAAX-EGFP and bathed with A655. Images were obtained by confocal microscopy with 1.5% laser power for CAAX-EGFP and 16% laser power for A655 at the cell bottom.
Extended Data Figure 3. PH-EGFP fluorescence increase in fusion spots is not due to lipid transfer from docked granules or endoplasmic reticulum (ER).
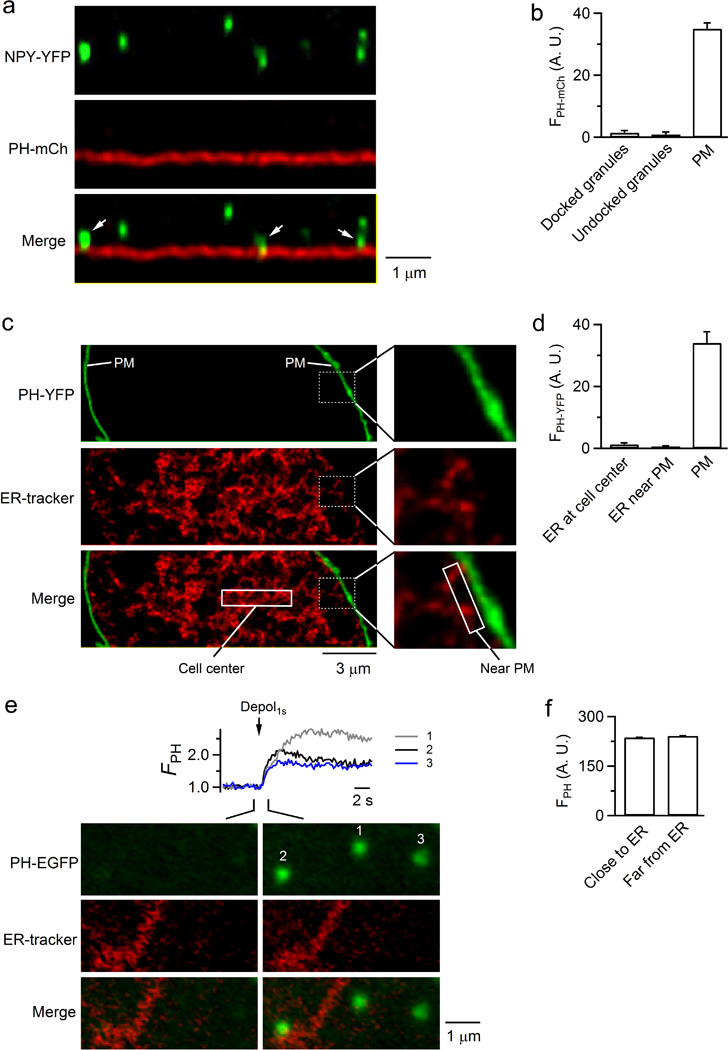
a, STED XZ images of NPY-YFP (upper) and PH-mCherry (PH-mCh, middle) from a chromaffin cell at the cell bottom (images superimposed in the lower panel). Arrows indicated NPY-YFP-containing granules docked at the PH-mCh-labelled plasma membrane. Chromaffin cells were transfected with NPY-YFP and PH-mCherry. The image was representative of 9 cells imaged. b, PH-mCherry fluorescence intensity (FPH-mCh) in three locations: 1) NPY-YFP spots docked at the plasma membrane (81 granules, 9 cells), 2) undocked NPY-YFP spots (87 granules, 9 cells), and 3) the plasma membrane (PM). FPH-mCh is expressed as mean + s.e.m. in the arbitrary unit (A.U.) with background fluorescence subtracted. For docked granules, only the fluorescence from the top of the granule was used for calculation to avoid contamination from PM. c, Left: STED XY/Zfix image (focal plane at cell center) of PH-YFP (upper) and ER-tracker red (middle). PH-YFP and ER-tracker red images were superimposed in the lower panel. PH-YFP labels only the cell plasma membrane (PM). The rectangle in the lower panel indicate the ‘cell center’ region where we analyzed the PH-YFP intensity shown in panel d. Right: the boxed area in the left is enlarged to show no PH-YFP fluorescence in ER-tracker-positive regions in contact with PH-YFP-labelled plasma membrane. Cells were transfected with PH-YFP and incubated with ER-Tracker Red (1 µM, Invitrogen) in HBSS solution for 30 min at 37°C for labeling of endoplasmic reticulum (ER). The rectangle in the lower panel indicates the ‘near PM’ region where we analyzed the PH-YFP intensity shown in panel d. The PM location is also labelled. The image was representative of 5 cells imaged. d, PH-YFP fluorescence intensity (FPH-YFP) in three locations: 1) ER-tracker-positive regions at cell center far from the plasma membrane (PM), 2) ER-tracker-positive regions near PM (within 1 µm from PM), and 3) PH-YFP-labelled PM region. For regions near PM, ER-tracker-labelled ERs were often in contact with PH-YFP-labelled PM. To avoid contamination from PM, the FPH-YFP was calculated in regions 300–1000 nm away from PM. FPH-YFP is plotted as mean + s.e.m. in arbitrary unit (A.U., from 5 cells). The results indicate that ER contains little PH-YFP and thus could not serve as a source to transport PIP2 to fusing vesicles. e, Images: PH-EGFP (upper) and ER-tracker red (middle, superimposed in the bottom) images 1 s before and 2 s after depol1s showing 3 PH-EGFP spots with different distances from ER-tracker red-labelled ER. Traces: FPH trace from three depol1s–induced PH-EGFP spots (1, 2, 3) with different distances from ER-tracker red-labelled ER. The image was representative of 5 cells imaged. f, FPH (arbitrary unit, A.U., mean + s.e.m.) from depol1s–induced fusing spots close to ER (within 500 nm of ER, 12 spots, 5 cells) and far from ER (> 500 nm from ER, 13 Spots, 5 cells). There was no significant difference, suggesting that ER does not contribute to FPH increase.
Extended Data Figure 4. Simulation: STED images of a Ω-profile at the XZ plane.

a, A point light source (a single fluorescent molecule) at the microscopic XZ plane. b, The point spread function of the point light source shown in panel a at the X-axis with a full-width-half-maximum of 65 nm (our STED X-axis resolution, left) and at the Z-axis with a full-width-half-maximum of 150 nm (our STED Z-axis resolution, right). The point spread function was generated with a Gaussian function. c, Simulated STED image of the point light source shown in panel a at the microscopic XZ plane. The image was generated using the point spread functions shown in panel b. d, Upper: the plasma membrane alone (left) and an Ω-profile attached to the plasma membrane (PM, right) are drawn at the XZ plane. Lower: the simulated STED images of the upper panels showing that the Ω-profile in the right is brighter than the plasma membrane alone in the left. Fluorescence molecules were randomly distributed at the membrane, including the plasma membrane and the Ω-profile membrane, at a density of 550 molecules per 100 nm2. Conclusion: For the XZ plane, despite the same fluorescent molecule number per unit membrane area on the Ω-profile and on the plasma membrane, the Ω-profile is brighter than the plasma membrane. This is because due to the limit of STED Z-axis resolution (~150 nm), the neighboring fluorescence of the Ω-profile in the Z-axis direction contributes to the increase of fluorescence at a given point of interest in the Ω-profile. Such a contribution is absent when the plasma membrane is alone without an attached Ω-profile.
Extended Data Figure 5. Electron microscopic observation of the hemi-fused intermediate structure.
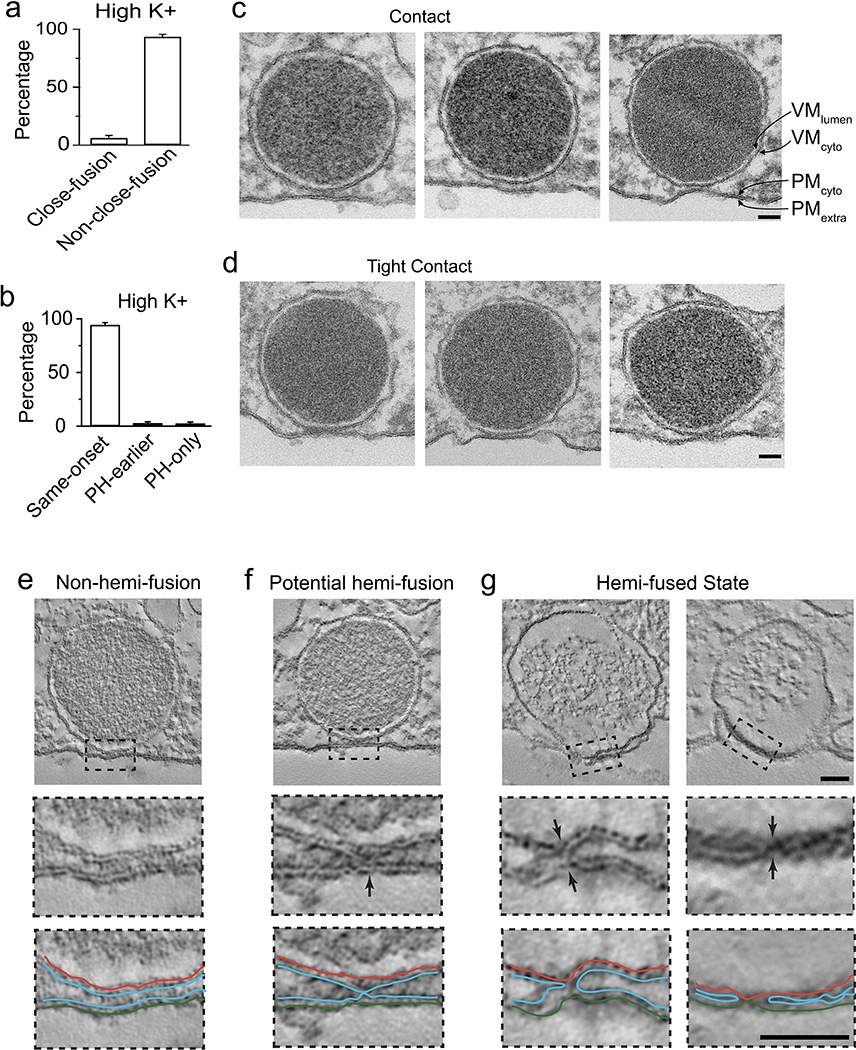
a, The percentage (mean + s.e.m.) of close-fusion and non-close-fusion per cell (228 A655 spots in 8 cells, 4 bovines) during high potassium application (30–90 mM KCl). The percentage is normalized to total number of events with F655 increase in a cell. b, The percentage (mean + s.e.m.) of same-onset, PH-earlier, and PH-only spots per cell during high potassium application (247 spots with FPH increase, 8 cells, 4 bovines). The percentage is normalized to total number of spots showing a FPH increase in the cell. The percentage of PH-only events was low, owing to a low percentage of close-fusion. Such a low percentage made it harder to find hemi-fusion structures under the electron microscope. c, Three sampled chromaffin granules in contact with the plasma membrane, but with a clear gap (~10–20 nm) between the vesicle membrane (VM) and the plasma membrane (PM). Each leaflet of VM (VMlumen, facing lumen; VMcyto, facing cytoplasm) and PM (PMcyto, facing cytoplasm; PMextra, facing extracellular solution) are labelled in the right panel. Images were taken from 50 nm thin sections. Chromaffin cells were fixed during application of a high potassium (30 mM) solution (applies to panels c-g). The scale bar is 50 nm in panel c-g. Images were representatives of ~800 granules within 30 nm from the PM. d, Similar to panel c, except showing three chromaffin granules in tight contact with the plasma membrane – no clear gap between VM and PM in the contact site. Images were representatives of 28 tight contacts. e, A tomograph section (1 nm) of a tight contact showing a vesicle docked, but not hemi-fused at the plasma membrane. The box region is enlarged in the middle and the lower panel to show the non-hemi-fusion structure – VMcyto is not connected with the PMcyto. In the lower panel, PMextra, PMcyto, VMcyto, and PMcyto were drawn (also applies to panel f and g). The image was representative of 6 images captured. f, A tomograph section (1 nm) of a tight contact showing a potential hemi-fusion structure, in which VMcyto may be connected with PMcyto at the contact site. The line drawing in the lower panel represented our interpretation of the image. However, the connection was not as good as compared to panel g. We could not fully exclude the possibility that these potential hemi-fusion structures are actually non-hemi-fusion structures with the presence of exocytosis proteins in the contact site. The image was representative of 7 images captured. g, Tomograph sections (1 nm) of two tight contacts showing the hemi-fused state (arrows, see line drawings in the lower panel for our interpretation). The hemi-fused structure in the left column is the same as that shown in Fig. 2h. The image was representative of 5 images captured.
Extended Data Figure 6. Detection of fusion pore opening and closure with VAMP2-pHluorin.
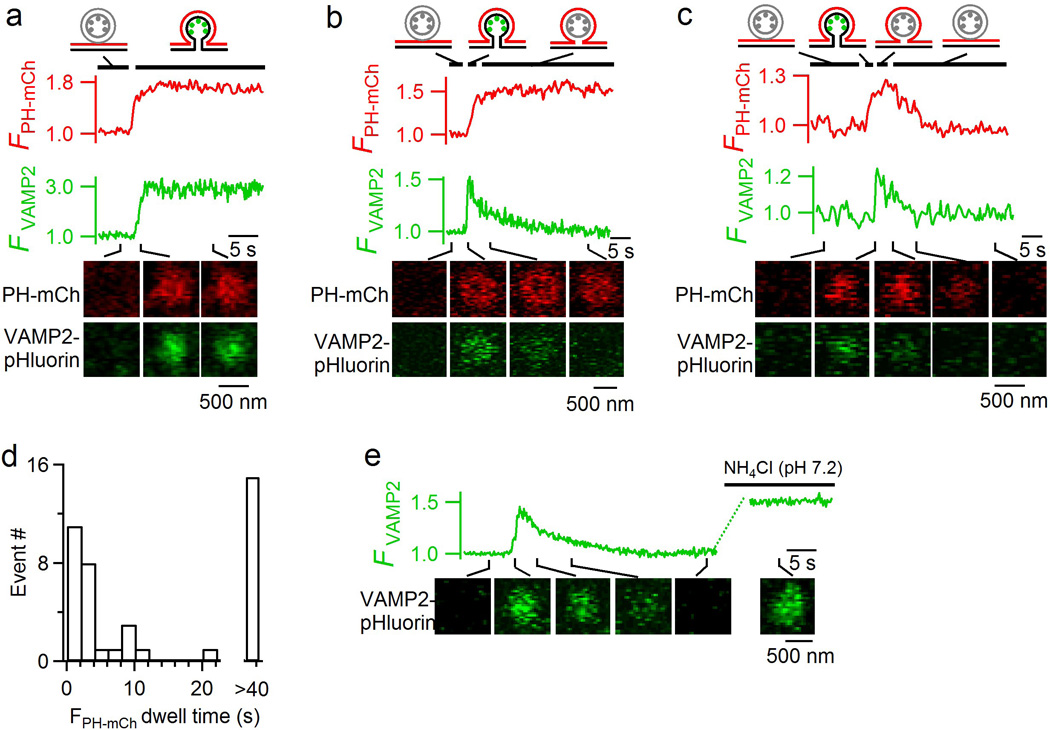
a–c, PH-mCherry fluorescence (FPH-mCh), VAMP2-pHluorin fluorescence (FVAMP2), and sampled images (at times indicated with lines) for a stay-fusion spot (a), a close-fusion spot with no FPH-mCh decay (b), and a close-fusion spot accompanied with FPH-mCh decay (c). Panel a shows a fully-fused Ω-profile with an open pore (representative of 29 events); Panel b shows that an open pore became a hemi-fused Ω-profile due to hemi-fission (PMextra-VMlumen fission) (representative of 15 events); and panel c shows transition from a fully opened Ω-profile to the hemi-fused Ω-profile (due to hemi-fission), and then to the formation of a vesicle via full fission (representative of 27 events). These transitions are illustrated with drawings of vesicular structures at time frames indicated by black lines (green dots: pH-sensitive VAMP2-pHluorin; red line: PH-mCh-labelled membrane). The onset of FVAMP2 decay indicates the time of PMextra-VMlumen fission, whereas FPH-mCh decay indicates PMcyto-VMcyto fission. Events in a-c were induced by depol1s in cells transfected with both PH-mCherry and VAMP2-pHluorin. Data were obtained from confocal microscopy at the cell-bottom (FVAMP2: 1.5% laser power; FPH-mCh: 3% laser power). d, Close-fusion spot number plotted versus FPH-mCh dwell time, the interval between FVAMP2 and FPH-mCh decay onset, which reflects lifetime of the hemi-fused structure generated by hemi-fission before proceeding to full fission. e, FVAMP2 and sampled images (at times indicated with lines) for a fusion spot showing increase of FVAMP2 upon vesicle fusion, followed by a decay due to vesicle acidification after pore closure. The decreased FVAMP2 recovered to the peak level upon addition of NH4Cl solution that raised the intra-vesicular pH to 7.2. We observed 30 such events in 13 cells, confirming that FVAMP2 increase and decrease reflect fusion pore opening and closure, respectively19.
Extended Data Figure 7. Dimming of PH-EGFP spot is not caused by vesicle pinching off, but by conversion of PIP2 to other molecules like PI(4)P.
a, FPH (PH-EGFP fluorescence), F655 and sampled images (at times indicated with lines) for a fusion spot showing FPH decay after fusion. These images were obtained by confocal microscopy at the cell-bottom with 1.5% laser power for FPH, whereas A655 was excited with 2% of the maximum laser power, but not 16% that would cause bleaching after fusion pore closure. The persistence of the A655 spot after the decay of FPH indicates that the FPH decay is not due to vesicle pinch off from the plasma membrane. The slight decay of F655 was due to slight bleaching of A655 at the low laser power after fusion pore closure. The fluorescence intensities were normalized to the baseline. The image was representative of 22 spots from 7 cells. b, FPH-mCh, the fluorescence intensity of the PH domain of oxysterol-binding protein attached with EGFP (FOSBP, green) that detects PI(4)P, F655, and sampled images (at times indicated with lines) are shown for a close-fusion spot. The fusion spot closed its pore, reflected as the decay of F655, due to bleaching by high laser power after pore closure. FOSBP increase was correlated with the decay of FPH-mCh that detected PIP2, suggesting conversion of PIP2 to PI(4)P during the decay of FPH-mCh. The image was representative of 13 spots in 8 cells. c, FPH (PH-EGFP fluorescence), F655 and sampled images for a close-fusion spot, which was subjected to strong photo-bleaching of PH-EGFP for 1 s (bar) with 100% laser power at the cell bottom (bleach area: 6 µm × 6 µm). The trace in the dotted box is enlarged in the right inset showing a decrease of FPH (bi-directional arrow) before photo-bleaching was applied. The decrease of FPH may reflect fission between PMcyto and VMcyto that prevents diffusion of PIP2 bound PH-EGFP from PM into the vesicle, which explains why FPH did not recover after bleaching. The images were obtained by confocal microscopy with 1.5% laser power for FPH and 16% laser power for F655 at the cell bottom. Thus, FPH did not recover after photo-bleaching if the close-fusion spot shows a decay of FPH before PH-EGFP photo-bleaching. The image was representative of 2 spots.
Extended Data Figure 8. Hemi-fusion and hemi-fission in INS-1 cell, a pancreatic β-cell line.
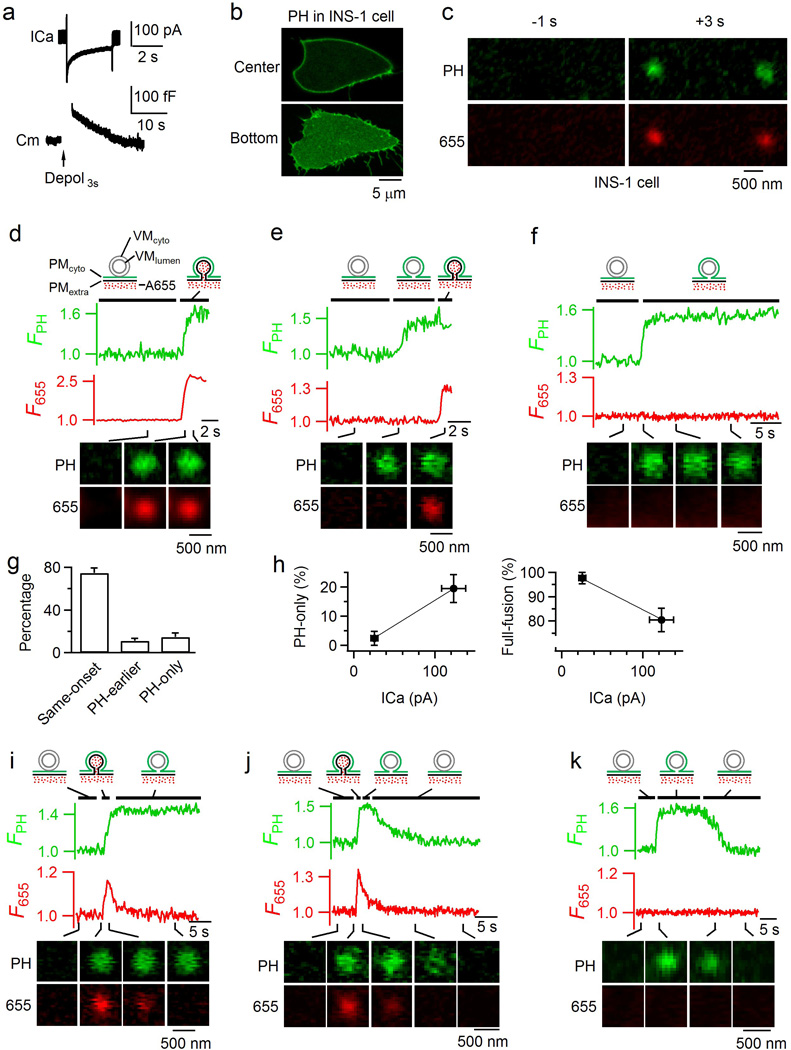
a, Sampled ICa (upper) and Cm (lower) induced by a 3 s depolarization from −80 to +10 mV (depol3s, arrow) in an INS-1 cell. INS-1 cells were used in all panels in this figure, and depol3s were also used in panels c-k. b, Sampled confocal PH-EGFP images at the INS-1 cell center (~2 µm above cell bottom, upper) and bottom (lower). The image was representative of 24 cells. c, Sampled cell-bottom confocal PH-EGFP and A655 images at 1 s before (left) and 3 s (right) after depol3s in an INS-1 cell. The image was representative of 24 INS-1 cells. d, FPH, F655, and sampled images (at times indicated with lines) for a same-onset spot (representative of 133 spots). Data were obtained from confocal microscope at the cell bottom. FPH and F655 are normalized to the baseline (applies to all other panels in this figure). The drawings show the vesicle’s structural changes at the time point indicated by black lines. e–f, FPH, F655 and sampled images for a PH-earlier spot (e, representative of 21 spots) and a PH-only spot (f, representative of 25 spots). Drawings are similar to those in panel d, except that an additional structure representing a hemi-fusion intermediate, the hemi-fused Ω-profile, is shown (e: between FPH and F655 rise; f: after FPH rise). g, The percentage (mean + s.e.m., per cell) of same-onset (133 spots), PH-earlier (21 spots), and PH-only spots (25 spots) detected with PH-EGFP/A655 imaging (179 spots in total, n = 24 cells). h, The percentage (mean + s.e.m.) of hemi-fusion (PH-only spots, left) and full-fusion (including same-onset and PH-earlier spots, right) plotted versus the ICa amplitude (mean + s.e.m.). Cells were grouped based on the ICa amplitude (10–50 pA, n = 7 cells; 50–200 pA, n = 17 cells). PH-only or full-fusion percentage is calculated as its percentage among all events with FPH increase per cell. i–j, FPH, F655 and sampled images for two close-fusion spots accompanied without (i) or with (j) FPH decay. The data reflected hemi-fused Ω-profile due to hemi-fission (i and j), and transition from hemi-fused Ω-profile to forming vesicle via full fission (j). The drawings indicate these vesicular structural changes at time frames indicated by black lines. i panel is representative of 11 spots; and j panel, 14 spots. k, FPH, F655 and sampled images for a PH-only spot in which FPH decayed after a dwell time, suggesting that the hemi-fused Ω-profile does not proceed to full fusion, but return to become intact vesicle via fission (PMcyto-VMcyto fission, see also the drawings). k panel is representative of 10 spots.
Extended Data Figure 9. Inhibition of dynamin inhibits close fusion and PH-only events, and dynamin 1 puncta are present at the plasma membrane.

a, Western blot showing that dynamin 1/2 siRNA (si-Dyn), but not control siRNA (si-Ctrl) knocked down dynamin as recognized with an antibody against dynamin 1 and 2. Actin is also shown as a loading control. Dynamin 1/2 siRNA were synthesized (Dharmacon) and the targeting sequence were 5’-aggagaaagagaagaagta-3’ and 5’-gggatgtcctggagaacaa-3’, which recognize dynamin 1 and dynamin 2. Non-targeting control siRNA was used as a negative control (Dharmacon). The siRNA was transfected to bovine chromaffin cells by electroporation. Western blot was performed 3 days later. For western blot source data, see Supplementary Figure 1. b, Relative expression of dynamin 1/2 in the presence of dynamin 1/2 siRNA (Si-Dyn) or control siRNA (Si-Ctrl). The expression levels were measured from western blot and normalized to actin control (n = 3). Data are expressed as mean + s.e.m. *: p = 0.0371 (two-sided t test). c–f, Replot of Fig. 4c–f, respectively, except that the number of experiments was counted from individual animals rather than from individual cells. Data from all cells in a bovine (2 adrenal glands) are grouped together and counted as one experiment. c, Left: close-fusion percentage per bovine (mean + s.e.m.) in the absence (Ctrl, 367 A655 spots, 6 bovines) and presence of dynasore (80 µM, incubated for 20 min, 439 A655 spots, 7 bovines). The percentage is normalized to total number of events with F655 increase per bovine. ***: P < 0.001 (two-sided t test). Right: the percentage of same-onset, PH-earlier, and PH-only spots per bovine in control (6 bovines, 517 spots with FPH increase) and in the presence of dynasore (7 bovines, 470 spots with FPH increase). The percentage is normalized to total number of spots showing a FPH increase per bovine. ***: P < 0.001 (ANOVA). d, Similar to panel c (mean + s.e.m.), except that the control and dynasore were replaced with overexpressed empty vector (5 bovines, 386 spots) and overexpressed dynamin 1 K44A mutant (Dyn 1-K44A, 6 bovines, 493 spots), respectively. **: P = 0.0043 (two-sided t test). e, Similar to panel c (mean + s.e.m.), except that the control and dynasore were replaced with siRNA control (si-Ctrl, 6 bovines, 352 spots) and dynamin 1/2 siRNA (si-Dyn, 7 bovines, 350 spots). **: P = 0.0012 (two-sided t test). f, The percentage (mean ± s.e.m. per bovine) of hemi-fusion (PH-only, upper) and full-fusion spots (including same-onset and PH-earlier spots, lower) plotted versus the percentage of close-fusion spot (mean ± s.e.m. per bovine) obtained in control (6 bovines), in the presence of dynasore (7 bovines), with overexpression of vector (5 bovines) or Dyn I-K44A mutant (6 bovines), and with si-Ctrl (6 bovines) or si-Dyn (7 bovines). g, Sampled STED XZ images of dynamin 1-EGFP (upper) and A532 (middle) showing dynamin 1-EGFP puncta associated with the plasma membrane (PM). Upper and middle panels are superimposed in the lower panel. The chromaffin cells were transfected with dynamin1-EGFP and bathed with A532. Since A532 filled the thin layer of solution between the cell bottom PM and the coverslip (see the label for approximate location in the bottom panel), the upper border of A532 fluorescence layer indicated the location of PM. This result indicates that dynamin 1 puncta are present at the plasma membrane in resting condition. The image was representative of 13 cells imaged.
Extended Data Table 1. Mean ± s.d. values in main figures.
a, Mean ± s.d. values per cell in Fig. 1g, 1i, 4c, 4d, and 4d. All values were calculated per cell (also 0061pplies to table b). b, Mean ± s.d. values per cell in the right panel of Fig. 4b.
| a. | |||||||
|---|---|---|---|---|---|---|---|
| Same-onset (%) |
PH-earlier (%) |
PH-only (%) |
Close fusion (%) |
Cell # |
Animal # |
||
| Fig 1g | 53.8 ± 23.0 | 13.9 ± 19.0 | 32.3 ± 20.8 | 16 | 5 | ||
| Fig. 1i | 60.4 ± 14.2 | 14.7 ± 12.2 | 24.9 ± 9.8 | 7 | 5 | ||
| Fig. 4c | Ctrl | 54.6 ± 16.7 | 15.8 ± 16.9 | 29.7 ± 16.7 | 60.9 ± 15.0 | 19 | 6 |
| Dynasore | 81.4 ± 18.8 (P< 0.0001) |
12.2 ± 12.2 (P = 0.8201) |
6.4 ± 8.2 (P< 0.0001) |
17.9 ± 12.1 (P< 0.0001) |
23 | 7 | |
| Fig. 4d | Vector | 57.4 ± 23.5 | 12.9 ± 11.1 | 29.7 ± 18.1 | 58.4 ± 12.9 | 21 | 5 |
| DynI-K44A | 91.4 ± 14.7 (P< 0.0001) |
6.1 ± 9.6 (P = 0.3440) |
2.5 ± 6.7 (P< 0.0001) |
13.4 ± 10.0 (P< 0.0001) |
23 | 6 | |
| Fig. 4e | si-Ctrl | 52.2 ± 15.7 | 13.5 ± 8.7 | 34.2 ± 12.2 | 60.6 ± 11.7 | 24 | 6 |
| si-Dyn | 78.1 ± 14.9 (P< 0.0001) |
10.6 ± 9.7 (P = 0.7872) |
11.3 ± 10.6 (P< 0.0001) |
20.0 ± 18.8 (P< 0.0001) |
24 | 7 |
| b. | ||||
|---|---|---|---|---|
| Group 1 | Group 2 | Group 3 | Group 4 | |
| ICa (pA) | 204.0 ± 52.0 | 298.6 ± 34.4 | 517.5 ± 81.2 | 829.0 ± 41.6 |
| PH-only (%) | 13.8 ± 19.1 | 26.7 ± 21.3 | 39.4 ± 10.9 | 41.6 ± 10.0 |
| Full fusion (%) | 83.2 ± 19.1 | 73.3 ± 21.3 | 60.6 ± 10.9 | 58.4 ± 10.0 |
| Cell # | 5 | 7 | 6 | 6 |
Supplementary Material
Acknowledgments
We thank Drs. Tamas Balla, Gero Miesenböck, and Dong-Sheng Wang for providing construct containing GFP-fused PH domain of PLCδ1, VAMP2-pHluorin construct, and dynamin siRNA, respectively. We thank Dr. Carolyn Smith for technical support of STED microscopy. We thank Susan Cheng and Virginia Crocker of NINDS EM facility for their EM technical support. This work was supported by the National Institute of Neurological Disorders and Stroke Intramural Research Program (ZIA NS003009-13 and ZIA NS003105-08) and National Institute on Deafness and other Communication Disorders (NIDCD) Intramural Research Program (Z01-DC000002 and NIDCD Advanced Imaging Core ZIC DC000081).
Footnotes
Author contributions. W.D.Z, E.H., W.S. performed and analysed most experiments, P.J.W. and H.C.C. initiated STED imaging of PH-EGFP, E.S.K., S.A.V. and B.K. performed electron microscopic works. L.G.W. designed experiments and wrote the manuscript with helps from all authors. W.D.Z. and E.H. participated in designing experiments and writing the manuscript.
The authors declare no competing financial interest.
Reference List
- 1.Jahn R, Fasshauer D. Molecular machines governing exocytosis of synaptic vesicles. Nature. 2012;490:201–207. doi: 10.1038/nature11320. [DOI] [PMC free article] [PubMed] [Google Scholar]
- 2.Jackson MB, Chapman ER. The fusion pores of Ca(2+)-triggered exocytosis. Nat. Struct. Mol. Biol. 2008;15:684–689. doi: 10.1038/nsmb.1449. [DOI] [PMC free article] [PubMed] [Google Scholar]
- 3.Chernomordik LV, Kozlov MM. Protein-lipid interplay in fusion and fission of biological membranes. Annu. Rev. Biochem. 2003;72:175–207. doi: 10.1146/annurev.biochem.72.121801.161504. [DOI] [PubMed] [Google Scholar]
- 4.Schmid SL, Frolov VA. Dynamin: functional design of a membrane fission catalyst. Annu. Rev. Cell Dev. Biol. 2011;27:79–105. doi: 10.1146/annurev-cellbio-100109-104016. [DOI] [PubMed] [Google Scholar]
- 5.Wu LG, Hamid E, Shin W, Chiang HC. Exocytosis and endocytosis: modes, functions, and coupling mechanisms. Annu. Rev. Physiol. 2014;76:301–331. doi: 10.1146/annurev-physiol-021113-170305. [DOI] [PMC free article] [PubMed] [Google Scholar]
- 6.Kozlov MM, Markin VS. Possible mechanism of membrane fusion. Biofizika. 1983;28:242–247. [PubMed] [Google Scholar]
- 7.Hernandez JM, et al. Membrane fusion intermediates via directional and full assembly of the SNARE complex. Science. 2012;336:1581–1584. doi: 10.1126/science.1221976. [DOI] [PMC free article] [PubMed] [Google Scholar]
- 8.Diao J, et al. Synaptic proteins promote calcium-triggered fast transition from point contact to full fusion. Elife. 2012;1:e00109. doi: 10.7554/eLife.00109. [DOI] [PMC free article] [PubMed] [Google Scholar]
- 9.Shnyrova AV, et al. Geometric catalysis of membrane fission driven by flexible dynamin rings. Science. 2013;339:1433–1436. doi: 10.1126/science.1233920. [DOI] [PMC free article] [PubMed] [Google Scholar]
- 10.Kozlovsky Y, Kozlov MM. Membrane fission: model for intermediate structures. Biophys. J. 2003;85:85–96. doi: 10.1016/S0006-3495(03)74457-9. [DOI] [PMC free article] [PubMed] [Google Scholar]
- 11.Lindau M, Almers W. Structure and function of fusion pores in exocytosis and ectoplasmic membrane fusion. Curr. Opin. Cell Biol. 1995;7:509–517. doi: 10.1016/0955-0674(95)80007-7. [DOI] [PubMed] [Google Scholar]
- 12.Han X, Jackson MB. Electrostatic interactions between the syntaxin membrane anchor and neurotransmitter passing through the fusion pore. Biophys. J. 2005;88:L20–L22. doi: 10.1529/biophysj.104.056739. [DOI] [PMC free article] [PubMed] [Google Scholar]
- 13.Han X, Wang CT, Bai J, Chapman ER, Jackson MB. Transmembrane segments of syntaxin line the fusion pore of Ca2+-triggered exocytosis. Science. 2004;304:289–292. doi: 10.1126/science.1095801. [DOI] [PubMed] [Google Scholar]
- 14.Jackson MB. SNARE complex zipping as a driving force in the dilation of proteinaceous fusion pores. J. Membr. Biol. 2010;235:89–100. doi: 10.1007/s00232-010-9258-1. [DOI] [PMC free article] [PubMed] [Google Scholar]
- 15.Chang CW, et al. A structural role for the synaptobrevin 2 transmembrane domain in dense-core vesicle fusion pores. J. Neurosci. 2015;35:5772–5780. doi: 10.1523/JNEUROSCI.3983-14.2015. [DOI] [PMC free article] [PubMed] [Google Scholar]
- 16.Lomasney JW, et al. Phosphatidylinositol 4,5-bisphosphate binding to the pleckstrin homology domain of phospholipase C-delta1 enhances enzyme activity. J. Biol. Chem. 1996;271:25316–25326. doi: 10.1074/jbc.271.41.25316. [DOI] [PubMed] [Google Scholar]
- 17.McLaughlin S, Wang J, Gambhir A, Murray D. PIP(2) and proteins: interactions, organization, and information flow. Annu. Rev. Biophys. Biomol. Struct. 2002;31:151–175. doi: 10.1146/annurev.biophys.31.082901.134259. [DOI] [PubMed] [Google Scholar]
- 18.Milosevic I, et al. Plasmalemmal phosphatidylinositol-4,5-bisphosphate level regulates the releasable vesicle pool size in chromaffin cells. J. Neurosci. 2005;25:2557–2565. doi: 10.1523/JNEUROSCI.3761-04.2005. [DOI] [PMC free article] [PubMed] [Google Scholar]
- 19.Chiang HC, et al. Post-fusion structural changes and their roles in exocytosis and endocytosis of dense-core vesicles. Nat. Commun. 2014;5:3356. doi: 10.1038/ncomms4356. [DOI] [PMC free article] [PubMed] [Google Scholar]
- 20.Hammond GR, Sim Y, Lagnado L, Irvine RF. Reversible binding and rapid diffusion of proteins in complex with inositol lipids serves to coordinate free movement with spatial information. J. Cell Biol. 2009;184:297–308. doi: 10.1083/jcb.200809073. [DOI] [PMC free article] [PubMed] [Google Scholar]
- 21.Gao J, Liao J, Yang GY. CAAX-box protein, prenylation process and carcinogenesis. Am. J. Transl. Res. 2009;1:312–325. [PMC free article] [PubMed] [Google Scholar]
- 22.Moser von Filseck J, et al. INTRACELLULAR TRANSPORT. Phosphatidylserine transport by ORP/Osh proteins is driven by phosphatidylinositol 4-phosphate. Science. 2015;349:432–436. doi: 10.1126/science.aab1346. [DOI] [PubMed] [Google Scholar]
- 23.Vardjan N, Stenovec M, Jorgacevski J, Kreft M, Zorec R. Subnanometer fusion pores in spontaneous exocytosis of peptidergic vesicles. J. Neurosci. 2007;27:4737–4746. doi: 10.1523/JNEUROSCI.0351-07.2007. [DOI] [PMC free article] [PubMed] [Google Scholar]
- 24.Albillos A, et al. The exocytotic event in chromaffin cells revealed by patch amperometry. Nature. 1997;389:509–512. doi: 10.1038/39081. [DOI] [PubMed] [Google Scholar]
- 25.Revelo NH, et al. A new probe for super-resolution imaging of membranes elucidates trafficking pathways. J. Cell Biol. 2014;205:591–606. doi: 10.1083/jcb.201402066. [DOI] [PMC free article] [PubMed] [Google Scholar]
- 26.Pinto da Silva P, Nogueira ML. Membrane fusion during secretion. A hypothesis based on electron microscope observation of Phytophthora Palmivora zoospores during encystment. J. Cell Biol. 1977;73:161–181. doi: 10.1083/jcb.73.1.161. [DOI] [PMC free article] [PubMed] [Google Scholar]
- 27.Jung JH, Szule JA, Marshall RM, McMahan UJ. Variable priming of a docked synaptic vesicle. Proc. Natl. Acad. Sci. U.S.A. 2016;113:E1098–E1107. doi: 10.1073/pnas.1523054113. [DOI] [PMC free article] [PubMed] [Google Scholar]
- 28.Zampighi GA, et al. Conical electron tomography of a chemical synapse: vesicles docked to the active zone are hemi-fused. Biophys. J. 2006;91:2910–2918. doi: 10.1529/biophysj.106.084814. [DOI] [PMC free article] [PubMed] [Google Scholar]
- 29.Fernandez-Busnadiego R, et al. Quantitative analysis of the native presynaptic cytomatrix by cryoelectron tomography. J. Cell Biol. 2010;188:145–156. doi: 10.1083/jcb.200908082. [DOI] [PMC free article] [PubMed] [Google Scholar]
- 30.Wong JL, Koppel DE, Cowan AE, Wessel GM. Membrane hemifusion is a stable intermediate of exocytosis. Dev. Cell. 2007;12:653–659. doi: 10.1016/j.devcel.2007.02.007. [DOI] [PMC free article] [PubMed] [Google Scholar]
- 31.Lindau M, Neher E. Patch-clamp techniques for time-resolved capacitance measurements in single cells. Pflugers Arch. 1988;411:137–146. doi: 10.1007/BF00582306. [DOI] [PubMed] [Google Scholar]
- 32.Mastronarde DN. Automated electron microscope tomography using robust prediction of specimen movements. J. Struct. Biol. 2005;152:36–51. doi: 10.1016/j.jsb.2005.07.007. [DOI] [PubMed] [Google Scholar]
- 33.Kremer JR, Mastronarde DN, McIntosh JR. Computer visualization of three-dimensional image data using IMOD. J. Struct. Biol. 1996;116:71–76. doi: 10.1006/jsbi.1996.0013. [DOI] [PubMed] [Google Scholar]
- 34.Smith C, Neher E. Multiple forms of endocytosis in bovine adrenal chromaffin cells. J. Cell Biol. 1997;139:885–894. doi: 10.1083/jcb.139.4.885. [DOI] [PMC free article] [PubMed] [Google Scholar]
Associated Data
This section collects any data citations, data availability statements, or supplementary materials included in this article.