

Abstract
Background
Racial/ethnic disparity in breast cancer-specific mortality in the U.S. is well documented. We examined whether accounting for racial/ethnic differences in the prevalence of clinical, patient, and lifestyle and contextual factors that are associated with breast cancer-specific mortality can explain this disparity.
Methods
The California Breast Cancer Survivorship Consortium combined interview data from six California-based breast cancer studies with cancer registry data to create a large racially diverse cohort of women with primary invasive breast cancer. We examined the contribution of variables in a previously reported Cox regression baseline model plus additional contextual, physical activity, body size, and comorbidity variables to the racial/ethnic disparity in breast cancer-specific mortality.
Results
The cohort comprised 12,098 women. Fifty-four percent were non-Latina Whites, 17% African Americans, 17% Latinas, and 12% Asian Americans. In a model adjusting only for age and study, breast cancer-specific hazard ratios relative to Whites were 1.69 (95% CI 1.46 -1.96), 1.00 (0.84 - 1.19), and 0.52 (0.33 - 0.85) for African Americans, Latinas, and Asian Americans respectively. Adjusting for baseline-model variables decreased disparity primarily by reducing the hazard ratio for African Americans to 1.13 (0.96 - 1.33). The most influential variables were related to disease characteristics, neighborhood socioeconomic status, and smoking status at diagnosis. Other variables had negligible impact on disparity.
Conclusions
While contextual, physical activity, body size, and comorbidity variables may influence breast cancer-specific mortality, they do not explain racial/ethnic mortality disparity.
Impact
Other factors besides those investigated here may explain the existing racial/ethnic disparity in mortality.
Keywords: breast cancer, mortality, race, ethnicity, disparity
Introduction
There are well-described differences in breast cancer mortality by race and ethnicity in the U.S. For example, breast cancer mortality rates were similar for African Americans and non-Latina Whites (NL Whites) in the U.S. until the late 1970s, but these rates began to diverge in the early 1980s(1-3). Reasons for racial/ethnic differences in mortality after breast cancer diagnosis are not completely understood. Demographic, screening, and disease characteristics(4), socioeconomic and lifestyle factors(5-7), adequacy of treatment(8-13), presence of comorbidities(14, 15), neighborhood factors(16), differential influence of tumor biology on outcome(17, 18), and patient hematologic traits(19) have been cited or investigated as possibly accounting for these observed disparities. Irrespective of race and ethnicity, history of comorbidity(20, 21) and lifestyle factors such as body size and physical activity(22-27) have been shown to influence breast cancer-specific mortality, albeit not in all studies(28). Most of these previous studies were conducted in NL Whites only. Few studies have investigated the combined roles of clinical, lifestyle, and contextual factors (i.e. those related to socioeconomic and man-made (“built”) physical attributes of an individual's surroundings(29, 30)) in relation to breast cancer-specific mortality.
We have previously reported on the role of institutional and neighborhood contextual factors(31, 32), low physical activity(33), large body size(34), and comorbidities(35) in relation to mortality following breast cancer diagnosis in the large California Breast Cancer Survivorship Consortium (CBCSC) study, which comprised 12,210 invasive breast cancer cases diagnosed between 1993 and 2007(36). Our objective in the present analysis was to investigate the contribution of each of these four domains of risk factors to the apparent racial/ethnic disparity in breast cancer-specific mortality within the context of a single baseline model that included common demographic, clinical, and disease characteristics.
Materials and Methods
The California Breast Cancer Survivorship Consortium (CBCSC)
The CBCSC, established in 2011, pooled data from six California-based studies to investigate racial/ethnic disparities in mortality(36). They included the Asian American Breast Cancer Study (AABCS), the Women's Contraceptive and Reproductive Experiences study (CARE), the San Francisco Bay Area Breast Cancer Study (SFBCS), the Life after Cancer Epidemiology study (LACE), the California Teachers Study (CTS), and the Multiethnic Cohort study (MEC). The CBCSC harmonized and pooled interview information from breast cancer cases and linked this information with neighborhood data from the California Neighborhoods Data System(29),data on characteristics of the primary reporting hospitals, and corresponding clinical characteristics and mortality data from the California Cancer Registry for cases diagnosed with primary invasive breast cancer between 1993 and 2007(36). Additional methodological details of the construction of the cohort are included in Supplemental Methods. The protocols for the CBCSC study were approved by the institutional review boards of all participating institutions and by the California State Committee for the Protection of Human Subjects.
Statistical methods
We used a previously developed(36) Cox multiple regression model as the starting point for examining the contribution of individual disease and patient characteristics to the observed racial/ethnic disparity in breast cancer-specific mortality. This model, which we refer to as the baseline model, used the attained age time scale, was stratified by study, and included racial/ethnic group, age at diagnosis as a continuous variable on both the natural and log scales, and clinical and demographic variables that contributed significantly to predicting breast cancer-specific mortality. The baseline model variables are listed in Supplemental Table 1 and further details of its development are described in the Supplemental Methods. The CBCSC included four exposure domains: contextual factors(31, 32), physical activity(33),body size(34), and comorbidity(35) to investigate their roles in breast cancer-specific and overall mortality. For this analysis we selected representative variables that were found to be predictive of outcome in these analyses as exposures of interest.
We performed several types of analyses in the baseline model to assess the influence of individual clinical and lifestyle factors on the racial/ethnic disparity in breast cancer-specific mortality. A univariable analysis started with the racial/ethnic group variable alone in a Cox regression model adjusted for continuous age at diagnosis and stratified by study. The remaining variables in the baseline model (Supplemental Table 1) were included individually, one by one in turn, and the resulting changes in the hazard ratios (HR) between African Americans, Latinas, and Asian Americans vs. NL Whites were described. A multivariable analysis started with all variables in the model, and the change in HR of each racial/ethnic group was noted when variables were removed, individually, one by one in turn. These two analyses reveal slightly different information about the influence of the different variables. The univariable analysis identifies variables that by themselves have a large influence on HR, although if they are highly correlated with other variables these also would have similar influence on HR in this analysis. The multivariable analysis identifies variables that have, by themselves and without regard to other variables, a large influence on racial/ethnic disparity. In this analysis removing a variable that is correlated with other variables in the model will have a smaller influence on HR, since some of the information it contains remains in the model through the remaining correlated variables. In addition, a sequential analysis was performed starting again with the racial/ethnic group variable alone in the model, and adding individual variables in a stepwise fashion in the order of their univariable significance. This analysis assesses the change in HR as more and more variables are added, with larger changes in HR occurring whenever the first influential variable in a correlated set or an individual influential uncorrelated variable is added. Tests of significance of a single variable or sets of variables of interest when added to a reference Cox model were based on the Cox partial likelihood ratio test.
We repeated these three analyses to investigate the further influence of contextual, physical activity, body size, and comorbidity related factors. The difference in these additional analyses was that the starting, reference model included all of the variables in the original baseline model. We also restricted these analyses to subgroups of the cohort that included only breast cancer cases from individual studies which collected data relevant to each of these four domains, as will be described below.
The measure that we devised to summarize the racial/ethnic disparity in breast cancer-specific mortality for a particular model was , the sample-size weighted standard deviation of loge HR estimates for racial/ethnic groups from the model. Here βi is the loge HR estimate (i.e. the Cox regression coefficient) for the ith racial/ethnic group, ni is the racial/ethnic group sample size, and β̄• is the sample-size weighted mean of the βi. D is independent of which group is chosen as the reference group and will be closer to zero for models where there is a smaller difference in breast cancer-specific mortality HR across the racial/ethnic groups.
In order to assess relative changes in this disparity measure, define D0 as the total disparity in a reference model. For the analyses of variables in the original baseline model, D0 was computed from a model that included only the racial/ethnic group variable, stratified by study and adjusted for age, but with no other variables from the baseline model included. For the analysis of variables related to contextual, physical activity, body size, and comorbidity factors, D0 was computed from a model that included all of the original baseline model variables. The relative influence of a particular variable on the disparity across racial/ethnic groups in the context of one of these reference models was defined as , i.e., the percent of the total disparity that is contributed by the variable, where D+ and D− denote the disparity measures for models that do and do not include a variable of interest, respectively. Note that D is a general measure of disparity that will not by itself reflect complex changes in the HR between racial/ethnic groups. Therefore, we also examined changes in HR for individual racial/ethnic groups. We also devised an approximate likelihood ratio-based test of significance of change in the disparity measure D. This test, termed “disparity χ2”, is described in detail in Supplemental Methods.
All reported p-values are based on two-sided tests, with p < 0.05 generally regarded as significant.
Results
The current analysis included 12,098 of the original 12,210 cases in CBCSC cohort – 112 cases designated as “other”race/ethnicity were excluded. The cohort comprised 6,501 (54%) NL Whites, 2,060 African Americans (17%), 2,032 Latinas (17%), and 1,505 (12%) Asian Americans. Table 1 summarizes the frequency of selected variables and their distribution by racial/ethnic group, and Supplemental Table 1 shows all variables that are included in the baseline model.
Table 1. Complete CBCSC cohort description by selected baseline model variables (N=12,098).
| Variable | Racial/ethnicgroup | |||||
|---|---|---|---|---|---|---|
| Non Latina White | African American | Latina | Asian American | Total | ||
| Total1 | 6501 (54%) | 2060 (17%) | 2032 (17%) | 1505 (12%) | 12098 (100%) | |
| AJCC stage | Stage I | 3416 (53%) | 827 (40%) | 911 (45%) | 729 (48%) | 5883 (49%) |
| Stage II | 2486 (38%) | 923 (45%) | 868 (43%) | 629 (42%) | 4906 (41%) | |
| Stage III | 312 (5%) | 143 (7%) | 145 (7%) | 90 (6%) | 690 (6%) | |
| Stage IV | 102 (2%) | 58 (3%) | 34 (2%) | 19 (1%) | 213 (2%) | |
| Unknown | 185 (3%) | 109 (5%) | 74 (4%) | 38 (3%) | 406 (3%) | |
| Grade | Grade I | 1522 (23%) | 280 (14%) | 306 (15%) | 215 (14%) | 2323 (19%) |
| Grade II | 2537 (39%) | 639 (31%) | 780 (38%) | 594 (39%) | 4550 (38%) | |
| Grade III | 1769 (27%) | 874 (42%) | 721 (35%) | 569 (38%) | 3933 (33%) | |
| Unknown | 673 (10%) | 267 (13%) | 225 (11%) | 127 (8%) | 1292 (11%) | |
| Nodal positivity | No positive nodes | 4338 (67%) | 1208 (59%) | 1244 (61%) | 981 (65%) | 7771 (64%) |
| Positive nodes | 1984 (31%) | 737 (36%) | 713 (35%) | 499 (33%) | 3933 (33%) | |
| Unknown | 179 (3%) | 115 (6%) | 75 (4%) | 25 (2%) | 394 (3%) | |
| Prior tumor | No | 5972 (92%) | 1906 (93%) | 1924 (95%) | 1445 (96%) | 11247 (93%) |
| Yes | 529 (8%) | 154 (7%) | 108 (5%) | 60 (4%) | 851 (7%) | |
| Neighborhood SES | Lowest SES | 201 (3%) | 559 (27%) | 263 (13%) | 137 (9%) | 1160 (10%) |
| Lower-middle SES | 591 (9%) | 528 (26%) | 402 (20%) | 251 (17%) | 1772 (15%) | |
| Middle SES | 1119 (17%) | 420 (20%) | 430 (21%) | 288 (19%) | 2257 (19%) | |
| Higher-middle SES | 1717 (26%) | 338 (16%) | 447 (22%) | 376 (25%) | 2878 (24%) | |
| Highest SES | 2657 (41%) | 177 (9%) | 440 (22%) | 420 (28%) | 3694 (31%) | |
| Unknown | 216 (3%) | 38 (2%) | 50 (2%) | 33 (2%) | 337 (3%) | |
| Surgery type | No surgery | 115 (2%) | 98 (5%) | 36 (2%) | 18 (1%) | 267 (2%) |
| Mastectomy | 2547 (39%) | 843 (41%) | 926 (46%) | 792 (53%) | 5108 (42%) | |
| Breast conserving surgery | 3827 (59%) | 1116 (54%) | 1069 (53%) | 693 (46%) | 6705 (55%) | |
| Other | 12 (0%) | 3 (0%) | 1 (0%) | 2 (0%) | 18 (0%) | |
| Tumor size | < 1 cm | 1135 (17%) | 235 (11%) | 300 (15%) | 267 (18%) | 1937 (16%) |
| < 5 cm | 4730 (73%) | 1512 (73%) | 1495 (74%) | 1084 (72%) | 8821 (73%) | |
| ≥5 | 346 (5%) | 176 (9%) | 120 (6%) | 92 (6%) | 734 (6%) | |
| Unknown | 290 (4%) | 137 (7%) | 117 (6%) | 62 (4%) | 606 (5%) | |
Percentages in the “Total” row are row percentages, whereas other percentages are column percentages for the variable.
Influence of variables in the baseline model
Figure 1 shows visually the analysis we conducted to examine the influence of the variables in the baseline model on the disparity in breast cancer-specific mortality across racial/ethnic groups. The top panel of Figure 1 shows the HR for African Americans, Latinas, and Asian Americans relative to NL Whites as variables were added to the model. The left-most point, labelled “RACE” is the model with racial/ethnic group alone, stratified by study and adjusted for age at diagnosis, but without the remaining variables. In this starting model, breast cancer-specific mortality in African Americans was higher compared to NL Whites, with an HR of 1.69(95% CI 1.46 - 1.96; see Table 2, column 1) whereas Latinas had similar mortality to NL Whites (HR 1.00, 95% CI 0.84 -1.19), and Asian Americans had lower mortality compared to NL Whites (HR 0.52, 95% CI 0.33 -0.85).
Figure 1.
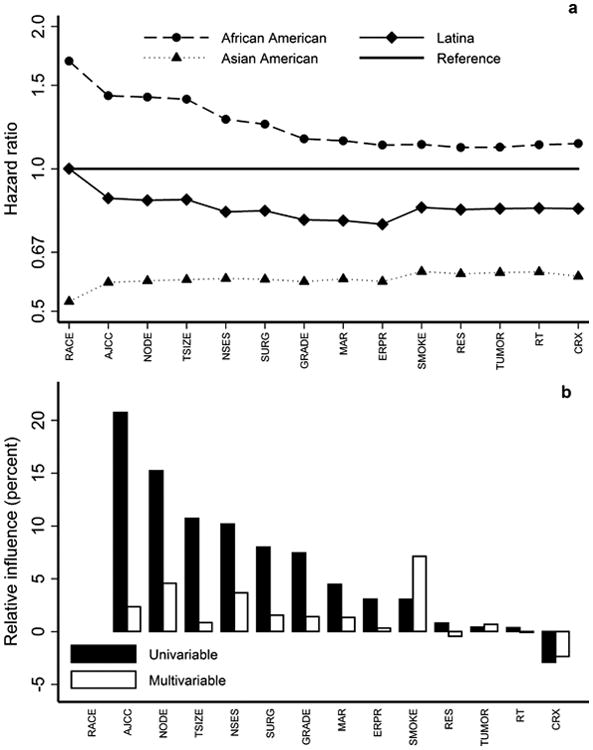
(a) Hazard ratios (HR) for breast cancer-specific mortality of African Americans Latinas, and Asian Americans compared to NL Whites, for a sequence of Cox regression models, the leftmost of which includes racial/ethnic group alone, stratified by study and adjusted for age at diagnosis, where variables are added in the order of their univariable significance, and where the rightmost represents the full baseline model described in(36). (b) Univariable and multivariable relative influence of individual variables in the baseline model.
Table 2. Hazard ratio (HR) estimates and 95% confidence intervals from Cox regression analysis of breast cancer-specific mortality, for the racial/ethnic group only model vs the full baseline model.
| All cases (N = 12,098) | ||
|---|---|---|
| Racial/ethnic group | Racial/ethnic group only model1 | Baseline model2 |
| Non-Latina Whites | 1 (Ref) | 1 (Ref) |
| African Americans | 1.69 (1.46, 1.96) | 1.13 (0.96,1.33) |
| Latina | 1.00 (0.84, 1.19) | 0.82 (0.69, 0.99) |
| Asian Americans | 0.52 (0.33, 0.85) | 0.59 (0.38, 0.96) |
| Disparity (D) | 0.32 | 0.19 |
| % change in D | - 40% | |
| Overall χ2(df)3 | 1632 (64) | |
| P-value3 | <0.0001 | |
| Disparity χ2(df)4 | 40 (3) | |
| P-value4 | < 0.0001 | |
Model including racial/ethnic group, and stratified by study and adjusted for age at diagnosis only.
Model including racial/ethnic group and all other variables in Table 1, stratified by study and adjusted for age at diagnosis.
Cox partial likelihood ratio χ2 comparing left model to right model in each section. df = degrees of freedom.
Portion of the likelihood ratio χ2 attributable to change in disparity measure (see methods)
The succession of points from left to right in the top panel of Figure 1 resulted from adding each of the variables sequentially to the model in the order of their univariable significance – i.e., their significance in a model that otherwise included only racial/ethnic groups with stratification by study and adjustment for age at diagnosis. The right-most point is the multivariable model that included all 14 variables shown in Supplemental Table 1. (The variables corresponding to the labels on the figures are shown in Table 3.) The disparity in breast cancer-specific mortality between African Americans and NL Whites was substantially reduced by adjusting for all of these variables (HR 1.13, 95% CI 0.96 -1.33; Table 2, column 2). While adding AJCC stage changed the HR somewhat for Latinas and Asian Americans, adjusting for all of the variables in the model had a much smaller impact than for African Americans. For Latinas, the HR decreased to 0.82 (95% CI 0.69 - 0.99) in the fully adjusted model while it increased slightly to 0.59 (95% CI 0.38 - 0.96) in Asian Americans.
Table 3. List of variables and abbreviations used in figures.
| Variable description | Abbreviations used in figures |
|---|---|
| Avg. hours of activity, ages 10 to 19 | ACT1 |
| Avg. hours of activity, ages 10 to diagnosis year | ACT2 |
| Avg. hours of activity, decade before diagnosis | ACT3 |
| AJCC stage | AJCC |
| Pre diagnosis BMI | BMI |
| Total business count | BUSI |
| Commuting via public transportation | COM |
| Housing crowding | CRWD |
| Chemotherapy | CRX |
| Diabetes | DIAB |
| ER/PR status | ERPR |
| Grade | GRADE |
| Hypertension | HBP |
| Hospital SES composition | HSES |
| Marital status | MAR |
| Myocardial infarction | MI |
| Nodal positivity | NODE |
| Neighborhood SES | NSES |
| Population density | PDEN |
| Racial/ethnic group | RACE |
| Restaurant environment index | REI |
| Residency region | RES |
| Radiation therapy | RT |
| Smoking | SMOKE |
| Surgery type | SURG |
| Traffic density | TDEN |
| Tumor size | TSIZE |
| Prior tumor | TUMOR |
| Urban/rural categorization | URB |
The lower panel of Figure 1 shows the univariable and multivariable percent relative influence of individual variables in the model, providing more information about which variables were most influential in affecting racial/ethnic disparity in breast cancer-specific mortality. The variables that appeared to have the most influence are those related to disease characteristics and presentation (specifically AJCC stage, nodal involvement, tumor size, and grade, as well as surgical treatment which is in large part dictated by disease presentation), neighborhood socioeconomic status (NSES), and smoking status at diagnosis. From the top panel one sees that, as variables are added to the model, the largest changes occur with AJCC stage, NSES, grade, and smoking, with AJCC stage affecting HR for all three racial/ethnic groups, NSES and grade affecting mostly African Americans and Latinas, and smoking affecting mostly Latinas and Asian Americans.
The large disparity in breast cancer-specific mortality between African Americans and NL Whites was explained to a large extent, but not completely, by the variables in this model, with comparatively smaller influence of these variables on the Latinas vs NL Whites and Asian Americans vs NL Whites disparity. The measure of disparity (D) was 40% smaller in the full model compared to the racial/ethnic group only model (Table 2, column 2, bottom), and this reduction in disparity was significant (χ2(3) = 40, p < 0.0001). In order to examine whether this large disparity was due to the small number of cases with later-stage tumors (AJCC Stage III-IV), we repeated these analysis restricting only to the 10,789 cases with AJCC Stage I-II disease. Supplemental Table 3 and Supplemental Figure 1 summarize these results. Interestingly, while the initial racial/ethnic groups disparity was similar to the full cohort analysis, the decrease in D from adjusting for baseline model covariates was 30% rather than 40%, due primarily to a somewhat larger remaining HR for African Americans vs NL Whites (HR 1.28, 95% CI 1.05 - 1.55) in the full baseline model. HRs for Latinas and Asian Americans differed by a much smaller amount compared to the full cohort analysis. Clinical variables, NSES, and smoking once more had the largest influence on reducing overall disparity.
Influence of variables related to contextual factors, physical activity, body size, and comorbidity
The variables that were included for each of the four domains of interest were, for contextual factors, measures of total business count, housing crowding, urban/rural categorization, population density, commuting via public transportation, restaurant environment, traffic density, and hospital socioeconomic composition(31, 32); for physical activity, measures of activity between the ages of 10 and 19, between age 10 and diagnosis of breast cancer, and in the ten years prior to diagnosis of breast cancer(33); for body size, pre-diagnosis body mass index (BMI) (34); and for comorbidity, history of hypertension, diabetes, or myocardial infarction(35). Because not all of the CBCSC studies collected data relevant to the four domains of interest, the domain-specific analyses were restricted to sub-cohorts comprising cases from the studies with data relevant to these domains. These variables and their distribution among racial/ethnic groups within these sub-cohorts are described in Supplemental Table 2. Note that the sub-cohorts with data on contextual factors, body size, and comorbidity had similar although not identical racial/ethnic composition. The physical activity sub-cohort had nearly equal distributions in the racial/ethnic groups and differed from the other three sub-cohorts and the overall cohort because two of the three studies (CTS, LACE) not included had predominantly NL Whites. Also, this sub-cohort included only one study (AABCS) with Asian Americans, which prohibited estimating the HR for Asian Americans in this analysis as this category was confounded with the study stratification variable.
Table 4 shows the HR estimates for breast cancer-specific mortality for the four domains of interest (contextual, physical activity, body size, and comorbidity), both under the complete baseline model (left column in each section) and with the relevant domain-specific variables included (right column in each section). Note that the HR estimates in the baseline models were similar in magnitude and pattern, although not identical to, the HR estimates in the baseline model that included the full cohort (Table 2, columns 1). Hence we think it is reasonable to use these sub-cohort baseline models as a reference to investigate the influence of domain-specific variables on racial/ethnic groups disparity.
Table 4. Hazard ratio (HR) estimates and 95% confidence intervals from Cox regression analysis of breast cancer-specific mortality, for the full baseline model vs the baseline model + specific domain variables, for the subsets of cases for which domain data were available.
| Contextual factors subset3 (N = 9,635) | Physical activity subset (N = 4,608)4 | Body size subset (N = 11,021)5 | Comorbidity subset (N = 10,106)6 | |||||
|---|---|---|---|---|---|---|---|---|
| Racial/ethnic Group | Baseline model1 | Baseline + domain variables2 | Baseline model1 | Baseline + domain variables2 | Baseline model1 | Baseline + domain variables2 | Baseline model1 | Baseline + domain variables2 |
| Non Latina White | 1 (Ref) | 1 (Ref) | 1 (Ref) | 1 (Ref) | 1 (Ref) | 1 (Ref) | 1 (Ref) | 1 (Ref) |
| African American | 1.17 (0.98, 1.40) | 1.17 (0.98, 1.40) | 1.27 (1.03, 1.57) | 1.31 (1.06, 1.61) | 1.10 (0.93, 1.30) | 1.07 (0.90, 1.27) | 1.21 (1.01, 1.46) | 1.20 (1.00, 1.44) |
| Latina | 0.90 (0.74, 1.09) | 0.89 (0.73, 1.09) | 0.91 (0.72, 1.17) | 0.95 (0.74, 1.22) | 0.77 (0.63, 0.93) | 0.76 (0.62, 0.92) | 0.81 (0.65, 1.00) | 0.77 (0.62, 0.96) |
| Asian | 0.73 (0.43, 1.23) | 0.72 (0.43, 1.23) | (omitted) | (omitted) | 0.54 (0.32, 0.90) | 0.55 (0.32, 0.93) | 0.61 (0.30, 1.24) | 0.63 (0.31, 1.27) |
| Disparity (D) | 0.14 | 0.14 | 0.12 | 0.12 | 0.23 | 0.22 | 0.20 | 0.19 |
| % Change in D | < ± 1% | < ± 1% | -3.70% | -2.30% | ||||
| Overall χ2(df)7 | 31.8 (27) | 8.96 (7) | 3.22 (2) | 20.2 (6) | ||||
| P-Value7 | 0.24 | 0.25 | 0.20 | 0.003 | ||||
| Disparity χ2(df)8 | 0.0 (3) | 0.12 (†) | 0.07 (3) | 0.16 (3) | ||||
| P-Value8 | >0.95 | † | >0.95 | >0.95 | ||||
Model including racial/ethnic group and all other variables in Table 1, stratified by study and adjusted for age at diagnosis. Analysis excludes cases from studies that did not collect variables relevant to the specific domain. Additionally some cases with missing data relevant to the domain are also excluded.
Includes all variables in the baseline model plus domain-specific variables.
LACE excluded;
Physical Activity – CTS, LACE, MEC excluded;
Body Size – None excluded;
Comorbidity – MEC excluded.
Cox partial likelihood ratio χ2 comparing left model to right model in each section. df = degrees of freedom.
Portion of the likelihood ratio χ2 attributable to change in disparity measure (see methods)
Could not be computed because of parameter aliasing
The right column of each of the four sections of Table 4 shows the HR estimates when the domain-specific variables are added to the corresponding baseline model. Adding these variables had minimal further influence on the disparity in breast cancer-specific mortality across the four racial/ethnic groups. Contextual factors (those aside from NSES) and physical activity factors had a negligible effect (percent change in disparity was <±1%, both overall p > 0.20). The effects were larger when body size (percent change in disparity = -3.70%, overall p = 0.20, disparity p > 0.95) and comorbidity (percent change in disparity = -2.30%, overall p = 0.003, disparity p > 0.95) factors were added to the baseline models. Figure 2 shows the HR changes as variables are added sequentially to the full baseline model. This figure visually reinforces the observation that accounting for these variables has minimal influence on the residual disparity in breast cancer-specific mortality across racial/ethnic groups, even though, as in the case of the comorbidity variables, they may be significantly associated with breast cancer-specific mortality. The parallel analysis restricted to cases with stage I-II disease showed similar results (Supplemental Table 4).
Figure 2.
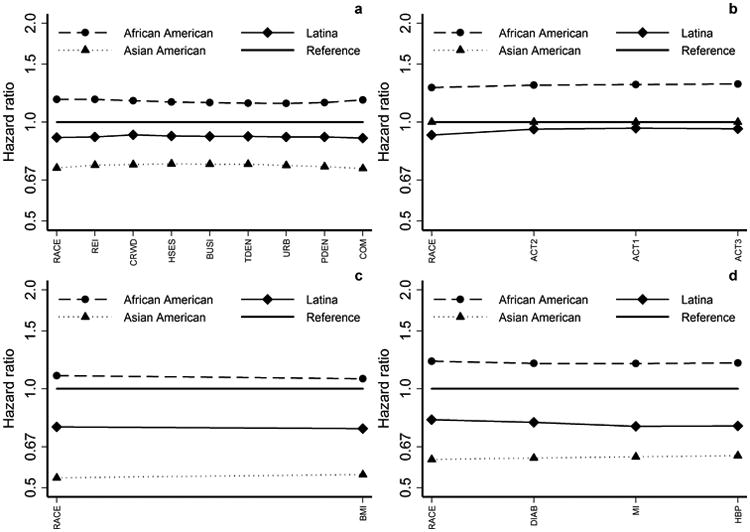
Racial/ethnic group HRs for sequence of Cox regression models similar to Figure 1, except reference is full baseline model fit to the project-specific subsamples. (a) Contextual factors; (b) Physical activity; (c) Body size; (d) Comorbidity
Discussion
We show in this analysis of over 12,000 breast cancer cases that individual-level patient and disease characteristics and NSES explain part (but not all) of the apparent disparity in breast cancer-specific mortality across different racial/ethnic groups, with disease characteristics and presentation, NSES, and smoking the most influential in explaining this disparity. Moreover, these factors have the most influence on the disparity between African Americans and NL Whites and comparatively little influence on disparities between Latinas and Asian Americans and NL Whites. In addition, we show that other contextual factors, physical activity, body size, and comorbidities apparently play a negligible role in explaining the observed racial/ethnic disparity in breast cancer-specific mortality.
Our results are in agreement with those of Curtis and colleagues(4), who used Surveillance, Epidemiology, and End Results (SEER) Medicare data on 41,020 women over 68 years of age with incident breast cancer to examine the influence of mammographic screening, tumor characteristics, tumor biology, treatment, comorbidities, and community income level on breast cancer-specific mortality between Whites, African Americans, Hispanics, and Asian and Pacific Islanders (API). The HR estimates for cancer-specific mortality from their baseline model, adjusted only for age and SEER site, for African Americans, Hispanics, and API (1.63, 1.24, and 0.59 respectively) and from their fully adjusted model (1.08, 0.88, and 0.61, respectively) are similar to the estimates from our baseline and fully adjusted models, respectively. We considered additional factors, including smoking and other life style and contextual factors that were not available in their study. The association between smoking and breast cancer outcome has been reported(37, 38), and our observation that adjusting for smoking reduced the disparity between both Latinas and Asian Americans compared to NL Whites is consistent with the smaller fraction of Latinas and Asian Americans in our cohort who were smokers. The findings from both Curtis and colleagues(4) and our study suggest that the most important determinants of mortality disparity are tumor and patient characteristics and NSES, that these factors mostly affect the African Americans vs. NL Whites disparity, and that comorbidities and other contextual factors, while possibly related to mortality, play a small role in explaining mortality disparity. To our knowledge, our current analysis is the first large population-based study to examine four domains of risk factors, including contextual factors, modifiable lifestyle factors (body size, physical activity), and comorbidities that appear to affect breast cancer outcome in NL Whites but that have not been studied in large numbers of women from other racial/ethnic groups.
An important strength of our analysis is that we have investigated the role of contextual factors, physical activity, body size, and comorbidity on racial/ethnic disparity in a harmonized cohort of breast cancer cases and within the context of a single multivariable baseline model. The contextual factors we studied included many additional parameters such as variables of crowding, urbanicity, street connectivity, number of businesses, restaurants and parks(29, 32). Our study also had the limitations that the domain-specific variables were not all available in all six studies in the CBCSC. In addition, these variables were limited to exposures that occurred before diagnosis, and they may not capture complete exposure (e.g., not all possible comorbidities are included, physical activity measures did not include occupational or housework related activity).
There are other variables that could contribute to the racial/ethnic disparity in breast cancer-specific mortality that we were not able to consider. While we had some data on treatment, data on the appropriateness of chemotherapy, radiation therapy, or surgical treatments administered, or patient compliance with prescribed treatments and clinical follow-up, were not available. Relevant to this, within an equal-access health system with standardized practice guidelines, racial/ethnic-specific differences in the initiation of adjuvant hormonal therapy(39) and in the use of chemotherapy(11) have been reported. Results on compliance from single institution studies are less clear. Sharma and colleagues(40) evaluated compliance with radiation therapy in a large institutional series of White and African-American patients who had undergone breast conservation surgery and found no difference in the rate of compliance. In a much smaller series, Bhatta and colleagues(41) found no difference in compliance to adjuvant hormone therapy between White and Black patients with estrogen receptor positive breast cancer. Our inclusion of factors related to NSES, which may indirectly reflect access to care, possibly captured part of any therapy compliance effect.
Genetic differences between racial/ethnic groups also have been considered. Bach and colleagues(17) synthesized a very large cohort of White and Black breast cancer patients and concluded from a meta-analysis that in comparably and appropriately treated patients there was little difference in cancer-specific mortality between races. They concluded therefore that differences in cancer biology are unlikely to explain any disparity in outcome between Blacks and Whites. In contrast, Albain et al(42) analyzed outcome in African Americans vs other races in over 19,000 patients treated on Southwest Oncology Group clinical trials and concluded that, for sex-specific cancers, African Americans had worse outcome despite uniform staging, treatment, and follow-up. Genetic differences potentially can explain other disparities, such as the better outcome in Asian Americans. For example, Shimizu and colleagues(43) have reported a much lower frequency in Asians than in Caucasians of genetic polymorphisms in CYP2D6 associated with poor drug metabolism, and these have been associated with lower endoxifen levels(44) and with poorer outcome(45) in breast cancer patients treated with Tamoxifen.
Dietary factors may also contribute to the observed racial/ethnic disparity in outcome. For example, Nechuta and colleagues(46) have shown that soy intake was inversely associated with breast cancer recurrence in both US and Chinese women.
Bias in assessing breast cancer-specific mortality also may be a factor. For example, Gomez et al (Gomez SL, McLaughlin R, Keegan TH, Pinheiro P, Yang J, Winders K, personal communication) investigated completeness of follow-up (alive and more than 2 years from the reference date 12/31/2012) in over 500,000 cases in the CCR during the years 2000 – 2009. They found higher rates of incomplete follow-up in Asian Americans (9%) and Hispanics (6%) compared to non-Hispanic Whites (2%), This admits the possibility that the observed better outcome in these patient groups could in part be due to bias resulting from informative censoring. In our cohort, using the same definition with our cutoff date of 12/31/2009, incomplete follow-up rates in non-Hispanic whites, Latinas, Asians, and African Americans were 2%, 4%, 5.2%, and 4.3%, respectively. Hence, the overall rate of incomplete follow-up is small in our cohort, as is the difference in these rates between racial/ethnic categories. While this does not eliminate the theoretical possibility that differences in informative censoring may be causing bias in our results, these generally low rates of incomplete follow-up suggest that whatever bias would be very small or negligible.
In conclusion, in our analysis, the racial/ethnic disparity in breast cancer-specific mortality remains after accounting for clinical, patient, contextual, and modifiable lifestyle factors. While some of these factors may have prevalence that is different across racial/ethnic groups, and may also be associated with breast cancer-specific mortality, this association is not strong enough to explain all of the observed racial/ethnic disparity in outcome. Other unmeasured factors, such as as yet unknown underlying genetic differences, unappreciated biases in measuring racial/ethnic differences in outcome, remain to be investigated to fully explain the observed mortality differences between NL Whites, African Americans Latinas and Asian Americans.
Supplementary Material
Acknowledgments
The authors gratefully acknowledge Dr. Brian Henderson's contribution to this research.
The collection of cancer incidence data used in this study was supported by the California Department of Public Health as part of the statewide cancer reporting program mandated by California Health and Safety Code Section 103885; the National Cancer Institute's Surveillance, Epidemiology and End Results Program under contract HHSN261201000140C awarded to the Cancer Prevention Institute of California, contract HHSN261201000035C awarded to the University of Southern California, and contract HHSN261201000034C awarded to the Public Health Institute; and the Centers for Disease Control and Prevention's National Program of Cancer Registries, under agreement U58DP003862-01 awarded to the California Department of Public Health. The ideas and opinions expressed herein are those of the author(s) and endorsement by the State of California, Department of Public Health the National Cancer Institute, and the Centers for Disease Control and Prevention or their Contractors and Subcontractors is not intended nor should be inferred.
Grant Support: This work was supported by grants 16ZB-8001 (A.H. Wu, R. Sposto, C. Vigen), 16ZB-8002 (S.L. Gomez, E.M. John, T.H.M. Keegan, A.W. Kurian, S. Shariff-Marco), 16ZB-8003 (L. Bernstein, Y. Lu), 16ZB-8004 (M.L. Kwan, B.J. Caan), and 16ZB-8005 (K. Monroe) from the California Breast Cancer Research Program. The AABCS was supported by the California Breast Research Program (CBCRP) grants 1RB-0287, 3PB-0120, and 5PB-0018 (A.H. Wu). The SFBCS was supported by National Cancer Institute grants R01 CA63446 and R01 CA77305, by the U.S. Department of Defense (DOD) grant DAMD17-96-1-6071, and by the CBCRP grants 4JB- 1106 and 7PB-0068 (E.M. John). The Women's CARE Study was funded by the National Institute of Child Health and Human Development (NICHD), through a contract with USC (N01-HD-3-3175), and the CTS was funded by the California Breast Cancer Act of 1993; National Cancer Institute grants (R01 CA77398 and K05 CA136967, L. Bernstein); and the California Breast Cancer Research Fund (contract 97-10500; L. Bernstein, Y. Lu). The Multiethnic Cohort Study was supported by National Cancer Institute grants R01 CA54281, R37CA54281, and UM1 CA164973. The LACE Study is supported by National Cancer Institute grant R01 CA129059 (B.J. Caan, M.L. Kwan).The collection of cancer incidence data used in this study was supported by the California Department of Health Services as part of the statewide cancer reporting program mandated by California Health and Safety Code Section 103885; the National Cancer Institute's Surveillance, Epidemiology, and End Results Program under contract HHSN261201000140C awarded to the Cancer Prevention Institute of California, contract HHSN261201000035C awarded to the University of Southern California, and contract HHSN261201000034C awarded to the Public Health Institute; and the Centers for Disease Control and Prevention's National Program of Cancer Registries, under agreement #1U58 DP000807-01 awarded to the Public Health Institute.
References
- 1.Jatoi I, Anderson WF, Rao SR, Devesa SS. Breast cancer trends among black and white women in the United States. J Clin Oncol. 2005;23:7836–41. doi: 10.1200/JCO.2004.01.0421. [DOI] [PubMed] [Google Scholar]
- 2.Jatoi I, Becher H, Leake CR. Widening disparity in survival between white and African-American patients with breast carcinoma treated in the U. S. Department of Defense Healthcare system. Cancer. 2003;98:894–9. doi: 10.1002/cncr.11604. [DOI] [PubMed] [Google Scholar]
- 3.Menashe I, Anderson WF, Jatoi I, Rosenberg PS. Underlying causes of the black-white racial disparity in breast cancer mortality: a population-based analysis. J Natl Cancer Inst. 2009;101:993–1000. doi: 10.1093/jnci/djp176. [DOI] [PMC free article] [PubMed] [Google Scholar]
- 4.Curtis E, Quale C, Haggstrom D, Smith-Bindman R. Racial and ethnic differences in breast cancer survival: how much is explained by screening, tumor severity, biology, treatment, comorbidities, and demographics? Cancer. 2008;112:171–80. doi: 10.1002/cncr.23131. [DOI] [PMC free article] [PubMed] [Google Scholar]
- 5.McKenzie F, Jeffreys M. Do lifestyle or social factors explain ethnic/racial inequalities in breast cancer survival? Epidemiol Rev. 2009;31:52–66. doi: 10.1093/epirev/mxp007. [DOI] [PubMed] [Google Scholar]
- 6.Nietert PJ, Sutherland SE, Keil JE, Bachman DL. Demographic and biologic influences on survival in whites and blacks: 40 years of follow-up in the Charleston Heart Study. Int J Equity Health. 2006;5:8. doi: 10.1186/1475-9276-5-8. [DOI] [PMC free article] [PubMed] [Google Scholar]
- 7.Keegan TH, Kurian AW, Gali K, Tao L, Lichtensztajn DY, Hershman DL, et al. Racial/ethnic and socioeconomic differences in short-term breast cancer survival among women in an integrated health system. Am J Public Health. 2015;105:938–46. doi: 10.2105/AJPH.2014.302406. [DOI] [PMC free article] [PubMed] [Google Scholar]
- 8.Griggs JJ, Sorbero ME, Stark AT, Heininger SE, Dick AW. Racial disparity in the dose and dose intensity of breast cancer adjuvant chemotherapy. Breast Cancer Res Treat. 2003;81:21–31. doi: 10.1023/A:1025481505537. [DOI] [PubMed] [Google Scholar]
- 9.Li CI, Malone KE, Daling JR. DIfferences in breast cancer stage, treatment, and survival by race and ethnicity. Arch Intern Med. 2003;163:49–56. doi: 10.1001/archinte.163.1.49. [DOI] [PubMed] [Google Scholar]
- 10.Wright JL, Reis IM, Zhao W, Panoff JE, Takita C, Sujoy V, et al. Racial disparity in estrogen receptor positive breast cancer patients receiving trimodality therapy. Breast. 2012;21:276–83. doi: 10.1016/j.breast.2011.11.003. [DOI] [PubMed] [Google Scholar]
- 11.Kurian AW, Lichtensztajn DY, Keegan TH, Leung RW, Shema SJ, Hershman DL, et al. Patterns and predictors of breast cancer chemotherapy use in Kaiser Permanente Northern California, 2004-2007. Breast Cancer Res Treat. 2013;137:247–60. doi: 10.1007/s10549-012-2329-5. [DOI] [PMC free article] [PubMed] [Google Scholar]
- 12.Adams SA, Butler WM, Fulton J, Heiney SP, Williams EM, Delage AF, et al. Racial disparities in breast cancer mortality in a multiethnic cohort in the Southeast. Cancer. 2012;118:2693–9. doi: 10.1002/cncr.26570. [DOI] [PMC free article] [PubMed] [Google Scholar]
- 13.Smith ER, Adams SA, Das IP, Bottai M, Fulton J, Hebert JR. Breast cancer survival among economically disadvantaged women: the influences of delayed diagnosis and treatment on mortality. Biomarkers and Prevention. 2008;17:2882–90. doi: 10.1158/1055-9965.EPI-08-0221. [DOI] [PMC free article] [PubMed] [Google Scholar]
- 14.Braithwaite D, Tammemagi CM, Moore DH, Ozanne EM, Hiatt RA, Belkora J, et al. Hypertension is an independent predictor of survival disparity between African-American and white breast cancer patients. Int J Cancer. 2009;124:1213–9. doi: 10.1002/ijc.24054. [DOI] [PubMed] [Google Scholar]
- 15.Tammemagi CM, Nerenz D, Neslund-Dudas C, Feldkamp C, Nathanson D. Comorbidity and survival disparities among black and white patients with breast cancer. JAMA. 2005;294:1765–72. doi: 10.1001/jama.294.14.1765. [DOI] [PubMed] [Google Scholar]
- 16.Akinyemiju TF, Soliman AS, Johnson NJ, Altekruse SF, Welch K, Banerjee M, et al. Individual and neighborhood socioeconomic status and healthcare resources in relation to black-white breast cancer survival disparities. J Cancer Epidemiol. 2013;2013:490472. doi: 10.1155/2013/490472. [DOI] [PMC free article] [PubMed] [Google Scholar]
- 17.Bach PB, Schrag D, Brawley OW, Galaznik A, Yakren S, Begg CB. Survival of blacks and whites after a cancer diagnosis. JAMA. 2002;287:2106–13. doi: 10.1001/jama.287.16.2106. [DOI] [PubMed] [Google Scholar]
- 18.Shiao YH, Chen VW, Scheer WD, Wu XC, Correa P. Racial disparity in the association of p53 gene alterations with breast cancer survival. Cancer Res. 1995;55:1485–90. [PubMed] [Google Scholar]
- 19.Wang C, Civan J, Lai Y, Cristofanilli M, Hyslop T, Palazzo JP, et al. Racial disparity in breast cancer survival: the impact of pre-treatment hematologic variables. Cancer Causes Control. 2015;26:45–56. doi: 10.1007/s10552-014-0481-4. [DOI] [PubMed] [Google Scholar]
- 20.Patterson RE, Flatt SW, Saquib N, Rock CL, Caan BJ, Parker BA, et al. Medical comorbidities predict mortality in women with a history of early stage breast cancer. Breast Cancer Res Treat. 2010;122:859–65. doi: 10.1007/s10549-010-0732-3. [DOI] [PMC free article] [PubMed] [Google Scholar]
- 21.Yancik R, Wesley MN, Ries LA, Havlik RJ, Edwards BK, Yates JW. Effect of age and comorbidity in postmenopausal breast cancer patients aged 55 years and older. JAMA. 2001;285:885–92. doi: 10.1001/jama.285.7.885. [DOI] [PubMed] [Google Scholar]
- 22.Abrahamson PE, Gammon MD, Lund MJ, Flagg EW, Porter PL, Stevens J, et al. General and abdominal obesity and survival among young women with breast cancer. Biomarkers and Prevention. 2006;15:1871–7. doi: 10.1158/1055-9965.EPI-06-0356. [DOI] [PubMed] [Google Scholar]
- 23.Cleveland RJ, Eng SM, Abrahamson PE, Britton JA, Teitelbaum SL, Neugut AI, et al. Weight gain prior to diagnosis and survival from breast cancer. Biomarkers and Prevention. 2007;16:1803–11. doi: 10.1158/1055-9965.EPI-06-0889. [DOI] [PubMed] [Google Scholar]
- 24.Goodwin PJ, Boyd NF. Body size and breast cancer prognosis: a critical review of the evidence. Breast Cancer Res Treat. 1990;16:205–14. doi: 10.1007/BF01806329. [DOI] [PubMed] [Google Scholar]
- 25.Keegan TH, Milne RL, Andrulis IL, Chang ET, Sangaramoorthy M, Phillips KA, et al. Past recreational physical activity, body size, and all-cause mortality following breast cancer diagnosis: results from the Breast Cancer Family Registry. Breast Cancer Res Treat. 2010;123:531–42. doi: 10.1007/s10549-010-0774-6. [DOI] [PMC free article] [PubMed] [Google Scholar]
- 26.Rock CL, Demark-Wahnefried W. Nutrition and survival after the diagnosis of breast cancer: a review of the evidence. J Clin Oncol. 2002;20:3302–16. doi: 10.1200/JCO.2002.03.008. [DOI] [PMC free article] [PubMed] [Google Scholar]
- 27.West-Wright CN, Henderson KD, Sullivan-Halley J, Ursin G, Deapen D, Neuhausen S, et al. Long-term and recent recreational physical activity and survival after breast cancer: the California Teachers Study. Biomarkers and Prevention. 2009;18:2851–9. doi: 10.1158/1055-9965.EPI-09-0538. [DOI] [PMC free article] [PubMed] [Google Scholar]
- 28.Sternfeld B, Weltzien E, Quesenberry CP, Jr, Castillo AL, Kwan M, Slattery ML, et al. Physical activity and risk of recurrence and mortality in breast cancer survivors: findings from the LACE study. Biomarkers and Prevention. 2009;18:87–95. doi: 10.1158/1055-9965.EPI-08-0595. [DOI] [PMC free article] [PubMed] [Google Scholar]
- 29.Gomez SL, Glaser SL, McClure LA, Shema SJ, Kealey M, Keegan TH, et al. The California Neighborhoods Data System: a new resource for examining the impact of neighborhood characteristics on cancer incidence and outcomes in populations. Cancer Causes Control. 2011;22:631–47. doi: 10.1007/s10552-011-9736-5. [DOI] [PMC free article] [PubMed] [Google Scholar]
- 30.Brownson RC, Hoehner CM, Day K, Forsyth A, Sallis JF. Measuring the built environment for physical activity: state of the science. Am J Prev Med. 2009;36:S99–123 e12. doi: 10.1016/j.amepre.2009.01.005. [DOI] [PMC free article] [PubMed] [Google Scholar]
- 31.Cheng I, Shariff-Marco S, Koo J, Monroe KR, Yang J, John EM, et al. Contribution of the Neighborhood Environment and Obesity to Breast Cancer Survival: The California Breast Cancer Survivorship Consortium. Biomarkers and Prevention. 2015 doi: 10.1158/1055-9965.EPI-15-0055. [DOI] [PMC free article] [PubMed] [Google Scholar]
- 32.Shariff-Marco S, Yang J, John EM, Kurian AW, Cheng I, Leung R, et al. Intersection of Race/Ethnicity and Socioeconomic Status in Mortality After Breast Cancer. J Community Health. 2015 doi: 10.1007/s10900-015-0052-y. [DOI] [PMC free article] [PubMed] [Google Scholar]
- 33.Lu Y, John EM, Sullivan-Halley J, Vigen C, Gomez SL, Kwan ML, et al. History of Recreational Physical Activity and Survival After Breast Cancer: The California Breast Cancer Survivorship Consortium. Am J Epidemiol. 2015;181:944–55. doi: 10.1093/aje/kwu466. [DOI] [PMC free article] [PubMed] [Google Scholar]
- 34.Kwan ML, John EM, Caan BJ, Lee VS, Bernstein L, Cheng I, et al. Obesity and mortality after breast cancer by race/ethnicity: The California Breast Cancer Survivorship Consortium. Am J Epidemiol. 2014;179:95–111. doi: 10.1093/aje/kwt233. [DOI] [PMC free article] [PubMed] [Google Scholar]
- 35.Wu AH, Kurian AW, Kwan ML, John EM, Lu Y, Keegan TH, et al. Diabetes and other comorbidities in breast cancer survival by race/ethnicity: the California Breast Cancer Survivorship Consortium (CBCSC) Biomarkers and Prevention. 2015;24:361–8. doi: 10.1158/1055-9965.EPI-14-1140. [DOI] [PMC free article] [PubMed] [Google Scholar]
- 36.Wu AH, Gomez SL, Vigen C, Kwan ML, Keegan TH, Lu Y, et al. The California Breast Cancer Survivorship Consortium (CBCSC): prognostic factors associated with racial/ethnic differences in breast cancer survival. Cancer Causes Control. 2013;24:1821–36. doi: 10.1007/s10552-013-0260-7. [DOI] [PMC free article] [PubMed] [Google Scholar]
- 37.Braithwaite D, Izano M, Moore DH, Kwan ML, Tammemagi MC, Hiatt RA, et al. Smoking and survival after breast cancer diagnosis: a prospective observational study and systematic review. Breast Cancer Res Treat. 2012;136:521–33. doi: 10.1007/s10549-012-2276-1. [DOI] [PMC free article] [PubMed] [Google Scholar]
- 38.Pierce JP, Patterson RE, Senger CM, Flatt SW, Caan BJ, Natarajan L, et al. Lifetime cigarette smoking and breast cancer prognosis in the After Breast Cancer Pooling Project. J Natl Cancer Inst. 2014;106:djt359. doi: 10.1093/jnci/djt359. [DOI] [PMC free article] [PubMed] [Google Scholar]
- 39.Livaudais JC, Hershman DL, Habel L, Kushi L, Gomez SL, Li CI, et al. Racial/ethnic differences in initiation of adjuvant hormonal therapy among women with hormone receptor-positive breast cancer. Breast Cancer Res Treat. 2012;131:607–17. doi: 10.1007/s10549-011-1762-1. [DOI] [PMC free article] [PubMed] [Google Scholar]
- 40.Sharma C, Harris L, Haffty BG, Yang Q, Moran MS. Does compliance with radiation therapy differ in African-American patients with early-stage breast cancer? Breast J. 2010;16:193–6. doi: 10.1111/j.1524-4741.2009.00874.x. [DOI] [PubMed] [Google Scholar]
- 41.Bhatta SS, Hou N, Moton ZN, Polite BN, Fleming GF, Olopade OI, et al. Factors associated with compliance to adjuvant hormone therapy in Black and White women with breast cancer. Springerplus. 2013;2:356. doi: 10.1186/2193-1801-2-356. [DOI] [PMC free article] [PubMed] [Google Scholar]
- 42.Albain KS, Unger JM, Crowley JJ, Coltman CA, Jr, Hershman DL. Racial disparities in cancer survival among randomized clinical trials patients of the Southwest Oncology Group. J Natl Cancer Inst. 2009;101:984–92. doi: 10.1093/jnci/djp175. [DOI] [PMC free article] [PubMed] [Google Scholar]
- 43.Shimizu T, Ochiai H, Asell F, Shimizu H, Saitoh R, Hama Y, et al. Bioinformatics research on inter-racial difference in drug metabolism I. Analysis on frequencies of mutant alleles and poor metabolizers on CYP2D6 and CYP2C19. Drug Metab Pharmacokinet. 2003;18:48–70. doi: 10.2133/dmpk.18.48. [DOI] [PubMed] [Google Scholar]
- 44.Lim JS, Chen XA, Singh O, Yap YS, Ng RC, Wong NS, et al. Impact of CYP2D6, CYP3A5, CYP2C9 and CYP2C19 polymorphisms on tamoxifen pharmacokinetics in Asian breast cancer patients. Br J Clin Pharmacol. 2011;71:737–50. doi: 10.1111/j.1365-2125.2011.03905.x. [DOI] [PMC free article] [PubMed] [Google Scholar]
- 45.Zeng Z, Liu Y, Liu Z, You J, Chen Z, Wang J, et al. CYP2D6 polymorphisms influence tamoxifen treatment outcomes in breast cancer patients: a meta-analysis. Cancer Chemother Pharmacol. 2013;72:287–303. doi: 10.1007/s00280-013-2195-9. [DOI] [PubMed] [Google Scholar]
- 46.Nechuta SJ, Caan BJ, Chen WY, Lu W, Chen Z, Kwan ML, et al. Soy food intake after diagnosis of breast cancer and survival: an in-depth analysis of combined evidence from cohort studies of US and Chinese women. Am J Clin Nutr. 2012;96:123–32. doi: 10.3945/ajcn.112.035972. [DOI] [PMC free article] [PubMed] [Google Scholar]
Associated Data
This section collects any data citations, data availability statements, or supplementary materials included in this article.