Abstract
Objective
To examine the impact of validation and temporal resolution on estimation of hCG increase as patients’ hCG values are not obtained at precise daily increments, or always in the same laboratory
Design
This study was a retrospective cohort study of women presenting with non-diagnosed, symptomatic first trimester pregnancies who had serial hCG levels over time.
Setting
Not applicable
Patients
171 women presenting between September 2007 and February 2010 with first trimester pregnancy pain and/or bleeding for whom a normal intrauterine pregnancy was ultimately confirmed.
Interventions
None
Main Outcome Measure(s)
Serial hCG values, time period between hCG measurements, hCG rise
Results
After data verification, 118 subjects contributing 327 values met inclusion criteria and passed data verification for analysis with improved temporal precision. The more precise data showed a steeper hCG rise, and the predicted 2 day hCG increase at the 1st percentile was slightly faster (1.68 vs. 1.56) than the “raw” clinical data and previous models.
Conclusions
Data verification and improved temporal precision suggested a faster hCG increase in early intrauterine gestation than previously demonstrated. As laboratory variation and temporal imprecision are common, these data demonstrate that current modeling of the expected rise of hCG in a normal gestation is valid and appropriately conservative in the determination of a non-viable gestation. No change in the minimal threshold for potential viability is recommended.
Keywords: early gestation viability, human chorionic gonadotropin, hourly precision
INTRODUCTION
Serial measures of serum human chorionic gonadotropin (hCG) are routinely used to evaluate the viability of a symptomatic early pregnancy, thereby guiding practitioners on the proper course of management. Of essential importance is characterizing the natural trend of the hCG rise in the first trimester. Several studies have characterized the rise of hCG in both normal and abnormal pregnancies before the age at which ultrasound may be used for definitive diagnosis of a viable intrauterine pregnancy (1–7). These studies established a threshold “minimal rise” above which pregnancies can be expectantly managed and below which pregnancies may be deemed “abnormal” and either surgically or medically treated.
The slowest, minimal rise for a normal viable intrauterine pregnancy was a 53% rise over 2 days (using a 1st percentile cut-off) (4, 5). However, others studies have shown that using a minimal rise as low as 35% in 2 days may lead to the misclassification of a number of normal pregnancies as nonviable (8). For these studies, the precise timing of the serum hCG collection was not known, and for modeling purposes, the time between serial assessments was rounded to day (24 hour) increments. Given the clinical importance of accurate calculation of the relative rise in serum hCG, we aimed to establish that the current method of quantifying follow-up time was valid and did not introduce systematic bias. This study examined the impact of using more precise follow-up times (hours rather than days) on the characterization of normal serial hCG curves in patients displaying pelvic or abdominal pain and/or vaginal bleeding with early viable gestations. The purpose of this study was to provide insight as to whether clinical management needs to be amended if patients do not get hCG values precisely 48 hours apart, or if hCG values are evaluated at different laboratories.
MATERIAL AND METHODS
In this study we generated a model of hCG increase using similar techniques to our initial publication (4), but in a new population sample. We assessed how the model differed when the data in the clinical database were validated with medical records, with and without inclusion of values from outside laboratories, and when the time period between hCG measurements used actual hours rather than measurement times rounded to whole days. This study was approved by the Institutional Review Board of the University of Pennsylvania and every study patient gave informed consent.
The Hospital of the University of Pennsylvania maintains a clinical database which tracks all patients presenting to the emergency department with a symptomatic first-trimester pregnancy, at risk for miscarriage or ectopic pregnancy, who are not diagnosed at their initial visit. Data were extracted from this database for women who presented between September 2007 and February 2010 with pelvic or abdominal pain and/or vaginal bleeding. A non-diagnostic initial evaluation was defined by a history of a positive serum hCG and an ultrasound with no evidence of an intrauterine or extrauterine gestational sac (9).
Women were included in the review if they had at least two hCG values between one and seven days apart with the first value being greater than 5 mIU/mL, a known final definitive diagnosis of intrauterine pregnancy (including a gestational sac with either a yolk sac or fetal pole documented by ultrasound), and all of their care received at the University of Pennsylvania. HCG values were only included if they had a corresponding date of laboratory draw and were less than or equal to 10,000 mIU/mL. Serum hCG concentrations were determined using the Abbot Axsym total beta immunoassay (Abbot Laboratories, Abbot Park, IL, USA), and results are expressed as mIU/mL, using the third International Reference Preparation. Serial hCG values were excluded from review if the date of draw occurred after the date of definitive diagnosis. Women whose hCG values recorded in the clinical database met the inclusion/exclusion criteria were identified by birthdate and medical record number. The full list of laboratory values for each patient was queried in the electronic medical records (EMR) system (Medview, HealthSlide, Knoxville, TN) for the University of Pennsylvania that contains laboratory data for each of its three hospitals. Serum hCG values as recorded in the clinical database were searched for and identified in the electronic medical record (EMR). After assessment of accuracy of the value as recorded in the computerized database, the time of the hCG serum collection as reported in the EMR was recorded.
For each woman, an hCG profile was constructed for hCG values drawn between the date of initial presentation and the date of definitive diagnosis as reported in the clinical database and the EMR. For all analyses, time was measured as days from the date of initial hCG value to the date and time of a given laboratory draw as reported in the clinical database or EMR. For modeling, hCG values were transformed to a natural log scale, ln(hCG), in order to better approximate a normal distribution while reducing the influence of large values. Longitudinal analyses were conducted using linear random effects techniques. These methods estimate a population average curve by aggregating estimated hCG profiles from each individual subject. Application of these models accounts for the correlation in repeated measures of hCG contributed by each subject and allows for variation in the number and timing of observations (10). Both linear and quadratic effects for time were considered as well as random linear and quadratic slopes. Model fit was assessed using Akaike information criteria (11). The most parsimonious model included a fixed effect for linear time and a random intercept.
An essential component of the internal validation process was to assess the accuracy of the data reported in the clinical database used to model the hCG curves. Internal validation was achieved by comparing both the date of draw and the hCG quantity. If a discrepancy in either the date of collection or the hCG quantity existed between the clinical database and the EMR, the study data record was adjusted to reflect the EMR data and the data value was annotated in the record as such. Data values that appeared in the EMR and occurred between the date of initial visit and the date of definitive diagnosis but were not originally entered into the clinical database by the practitioner were annotated and included in the analysis. Furthermore, hCG values for patient records that could not be found in the EMR could not be validated and therefore were annotated and analyzed separately.
Population average estimates of slope, standard errors, and upper and lower 95% confidence bounds for the rate of increase in ln(hCG) were estimated from the multivariate linear regression model that assumes a normal distribution for ln(hCG). Primary data management and analyses, including regression modeling were conducted using STATA version 11.2 (StataCorp LP, College Station, TX, USA). The relative rise in serum hCG concentration for a 1 day change in hCG was calculated as the exp{slope}, a 2 day relative rise as exp{2*slope}. Confidence bounds for the relative rise were derived by exponentiation of corresponding bounds for the slope. We present 1 day, 2 day, 4 day, and 7 day slope and relative rise along with 1st, 5th, 10th, and 50th percentile estimates of viable intrauterine pregnancies. These estimates along with 95% confidence intervals for the relative rises were estimated by a boot strap resampling of the original cohort size 1000 times.
In order to characterize the independent impact of improved temporal precision, slopes and predicted rise were compared between validated data analyzed with day-precision to validated data analyzed with hour-precision, and histograms displaying the frequency of time-variable adjustment from conversion to hour-precision were generated. In order to characterize the independent impact of data validation, slopes and predicted rise were compared between non-validated and validated data, both analyzed by day-precision. Measures of the types of discrepancy between the EMR and the clinical database were tabulated, and paired t-tests comparing slopes after adjusting for error types were performed. Furthermore, the date and time adjustments that occurred through the EMR validation process were characterized by compiling frequency histograms for the day-of-the-week of laboratory draw as well as the quantified hour-correction (by subtracting the non-validated integer number of follow-up days from the validated follow-up time in fractional days and multiplying by 24 hours) for each laboratory draw in 6-hour buckets.
RESULTS
A total of 1702 patients from the clinical database were screened for eligibility. After applying the inclusion criteria, 171 women with a median of 3 (range 2 to 8) hCG values remained. This set of patients was characterized by a mean (SD) age of 27.1 (6.8) years, median gravida 2 (range 0–8), and median parity 1 (range 0–5). There were 43 Caucasians, 106 African Americans, 22 unknown race, and no Hispanics. The geometric mean of the initial hCG value was 403 mIU/mL. The subset of 120 patients (70.2%) who were certain of the date of their last menstrual period presented at a mean (SD) of 35.3 (11.0) days gestation.
After data validation, a median of 3 (range 2 to 6) hCG values from 118 patients were available for analysis. Of the 481 original hCG values, 168 (34.9% of hCG values affecting 34.5% of patients) were unverifiable (assays performed at an outside laboratory) and therefore excluded from the EMR analyses. An additional 20 values (4.2% of hCG values affecting 11.7% of patients) were corrected for either the date or the hCG level, and an additional 35 measurements (affecting 11.1% of patients) which met inclusion criteria were added to the EMR analyses. The laboratory values validated in the electronic medical record were all processed by a single in-hospital laboratory, with a consistent and known reference standard.
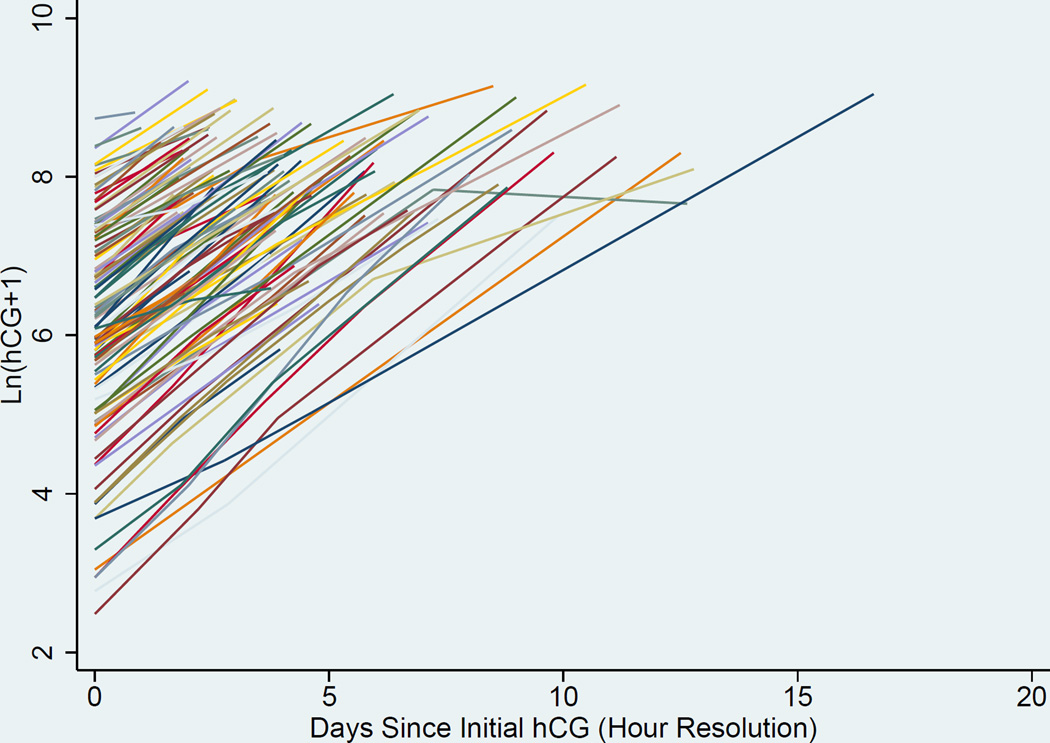
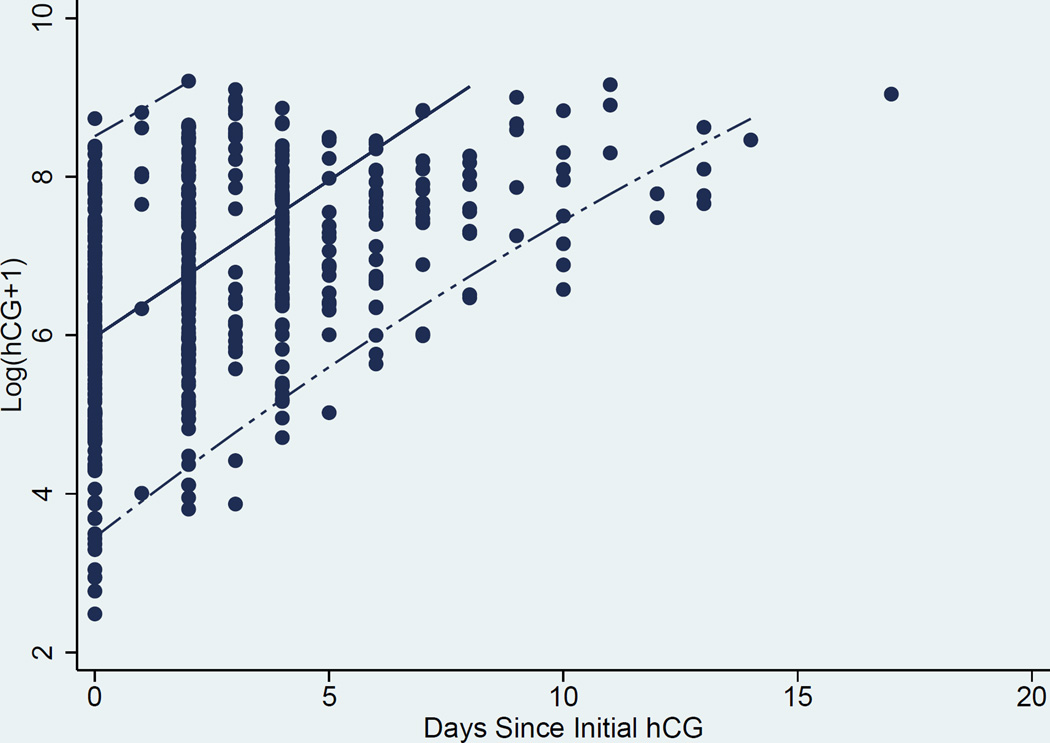
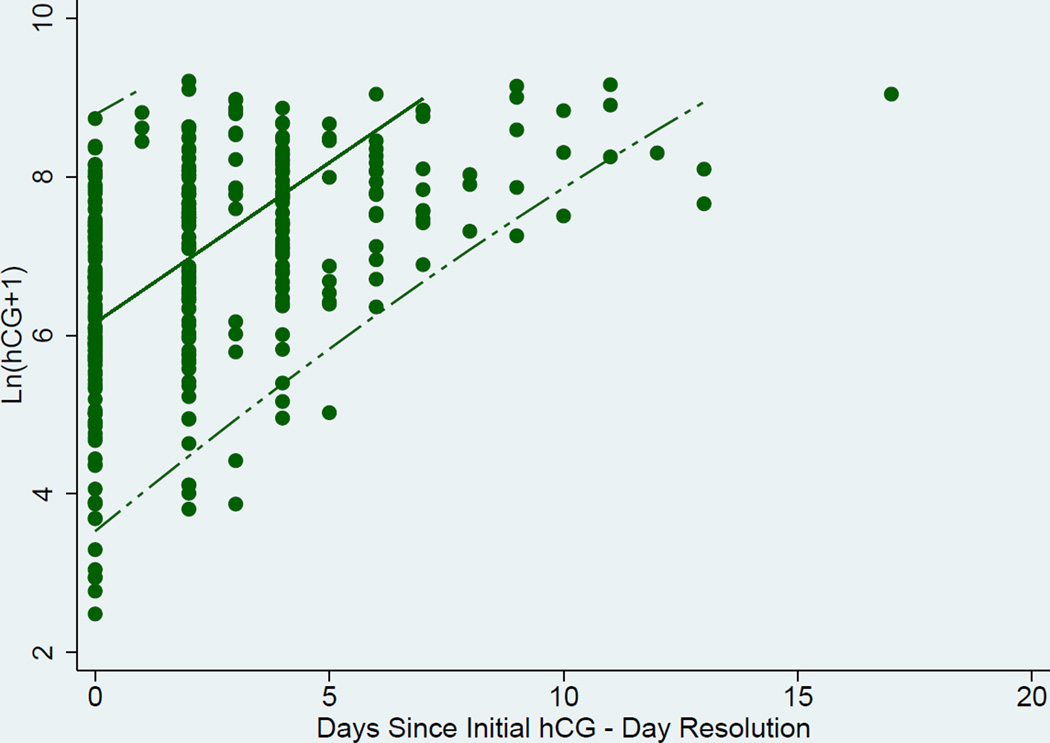
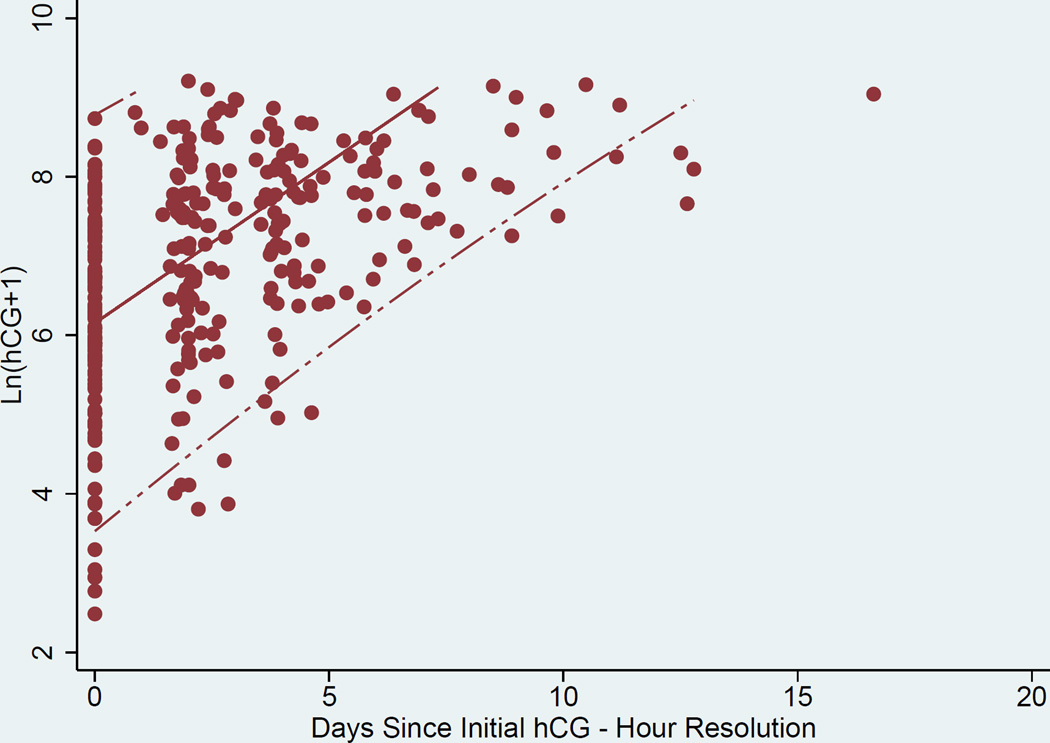
Curves to estimate the rate of change in hCG over time were generated. A representation of the individual curves based on clinical data is presented in Figure 1. Linear random effects regression models with best fit line and 95% CI, were calculated in three ways where the time variable was either A) an integer number of days since initial presentation in the “raw” clinical data, B) days after validation by the EMR, and C) resolution to the hour (for the data validated with the EMR) (Figures 2a, 2b, and 2c respectively). The estimated slope (average hCG increase per 1 day or 24 hours) and 95% CI for the A) raw clinical data, B) validated EMR data, and C) validated EMR data with resolution to the hour demonstrated a faster rise of hCG as the data were validated and temporal resolution increased: A) 0.394 (0.377–0.412), B) 0.404 (0.385–0.424), and C) 0.406 (0.387–0.424) mIU/mL/day respectively. Comparison of these slopes showed them to not be significantly different from each other (p-values = (A vs B) 0.07, (A vs C) 0.05, and (B vs C) 0.41).
Figure 1.
Individual trendlines of hCG rise over time: (temporal resolution by hour)
Figure 2.
a. Scatter Plot, best linear fit (solid line) and 95% confidence interval (dashed lines) of ln hCG rise derived from “raw” data from clinical database (day resolution).
b. Scatter Plot, best linear fit (solid line) and 95% confidence interval (dashed lines) of ln hCG rise derived from validated data from EMR (temporal resolution by day).
c. Scatter Plot, best linear fit (solid line) and 95% confidence interval (dashed lines) of ln hCG rise derived from validated data from EMR (temporal resolution by hour).
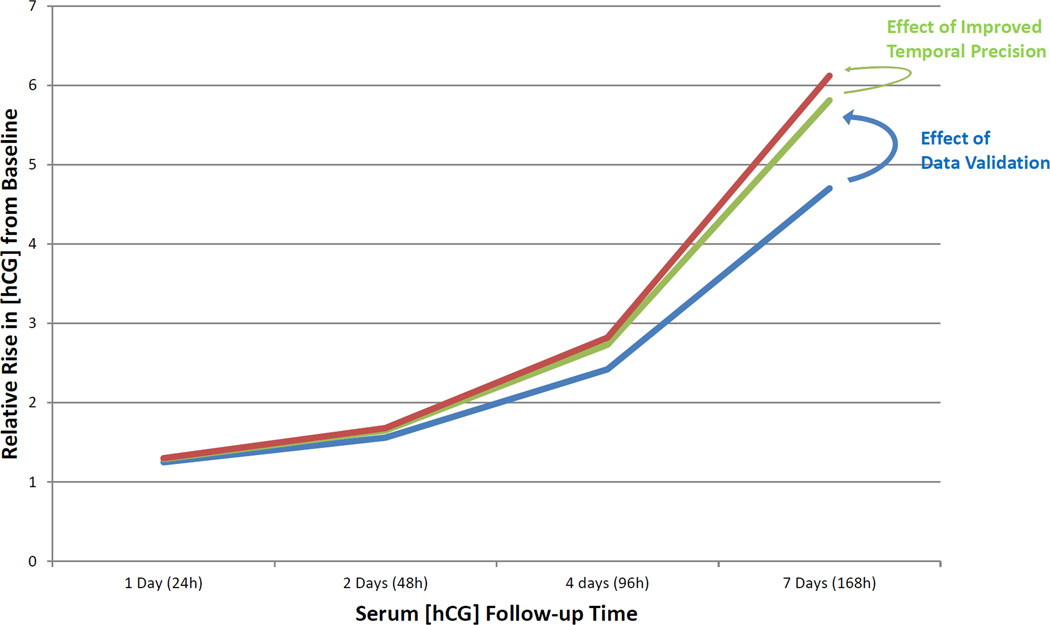
The predicted relative increases in serum hCG concentration from baseline at the 1st, 5th, 10th, and 50th percentiles over one to seven days are shown in Table 1. The 50th percentile at 2 days or 48 hours reflects the median anticipated relative rise in serum hCG concentration and was 2.23, 2.25, and 2.22 for raw clinical data, validated EMR data, and validated EMR data with improved temporal resolution respectively. The 1st percentile, of which all but two patients exceeded in this study, reflects the slowest anticipated relative rise in serum hCG concentration for a normal intrauterine pregnancy; this value, at 2 days or 48 hours, was 1.48, 1.51, and 1.53 for the analyses above, respectively. In aggregate, there is a strong trend to a faster expected rise of hCG over time as the data were validated and temporal resolution increased. The relative rise in serum hCG for the 1st percentile generated by these three analyses are plotted simultaneously in Figure 3.
Table 1.
Predicted relative increase in hCG from baseline with varied data conditions and 95% Confidence Intervals
| Percentile | Condition | 1 day | 2 Day | 4 Day | 7 Day |
|---|---|---|---|---|---|
| 1 | Raw data | 1.22 (1.18,1.26) |
1.48 (1.40,1.59) |
2.20 (1.95,2.53) |
3.98 (3.22,5.09) |
| Validated data | 1.23 (1.17,1.28) |
1.51 (1.38,1.65) |
2.30 (1.90,2.72) |
4.30 (3.06,5.75) |
|
| Resolution by hour | 1.24 (1.18,1.29) |
1.53 (1.39,1.66) |
2.36 (1.93,2.75) |
4.51 (3.15,5.88) |
|
| 5 | Raw data | 1.29 (1.25,1.34) |
1.67 (1.56,1.79) |
2.80 (2.42,3.21) |
6.06 (4.71,7.70) |
| Validated data | 1.30 (1.26,1.35) |
1.69 (1.58,1.81) |
2.88 (2.51,3.29) |
6.36 (5.00,8.05) |
|
| Resolution by hour | 1.30 (1.26,1.35) |
1.70 (1.59,1.82) |
2.89 (2.53,3.32) |
6.43 (5.09,8.18) |
|
| 10 | Raw data | 1.35 (1.31,1.39) |
1.83 (1.72,1.93) |
3.34 (2.96,3.73) |
8.27 (6.67,10.01) |
| Validated data | 1.35 (1.31,1.39) |
1.83 (1.72,1.94) |
3.36 (2.95,3.76) |
8.35 (6.63,10.15) |
|
| Resolution by hour | 1.36 (1.31,1.40) |
1.85 (1.73,1.95) |
3.42 (2.99,3.80) |
8.59 (6.79,10.34) |
|
| 50 | Raw data | 1.49 (1.47,1.52) |
2.23 (2.15,2.30) |
4.97 (4.62,5.29) |
16.54 (14.58,18.47) |
| Validated data | 1.50 (1.48,1.52) |
2.25 (2.18,2.31) |
5.07 (4.75,5.31) |
17.12 (15.28,18.60) |
|
| Resolution by hour | 1.49 (1.47,1.51) |
2.22 (2.17,2.28) |
4.94 (4.73,5.19) |
16.29 (15.17,17.86) |
Raw data: Data taken directly from clinical database. Validated data: data validated with EMR. Resolution by hour: Validated data with temporal resolution to the hour (instead of by day). 50th percentile represents the predicted median increase for an intrauterine pregnancy. 1st percentile represents the slowest predicted increase for women with a normal intrauterine pregnancy.
Figure 3.
Relative rise in serum hCG for the 1st percentile of patients (the slowest predicted increase for women with a normal intrauterine pregnancy). Blue line is hCG rise with raw data, green line is hCG rise with data validation and red line is hCG rise with data validation and improved temporal precision.
The change in frequency of laboratory draws by day-of-the-week in going from non-validated to validated data, respectively, was as follows: Sunday 12.7% to 13.8%, Monday 18.5% to 19.0%, Tuesday 14.4% to 14.1%, Wednesday 15.4% to 15.6%, Thursday 14.4% to 14.4%, Friday 15.8% to 14.0%, Saturday 8.9% to 9.2%. In quantifying the adjustment in the conversion to hourly precision, it is seen that 73.7% of un-refined follow-up times fell within 6 hours of the refined follow-up time (i.e. nearly 74% of follow-up times labeled as ‘2-days’ in previous analyses actually fell within 6 hours of ‘48 hours’), and 93.3% fell within 12 hours. There was no apparent bias, such that time was not consistently overestimated or underestimated, when data were resolved from day to hour.
DISSCUSSION
The studies that have established a threshold “minimal rise” for growing intrauterine pregnancies were derived more than a decade ago from changes in hCG concentration in 287 women ultimately found to have an visualized intrauterine pregnancy using ultrasound (4). These data were used to calculate percentiles of expected hCG increments at 1 to 7 days from baseline. The use of these data to aid the diagnosis of women at risk for early pregnancy loss has been validated twice (4, 8), however, in both cases, diagnosis based on hCG curves was neither 100% sensitive nor 100% specific. It is unclear whether the uncertainty in diagnosis stems partly from variation in hCG patterns due to artifacts of clinical practice, e.g. time resolved to the day rather than to the hour, or due to hCG being assayed at different laboratories. In other words, is the evaluation of the normal rise of hCG in an intrauterine pregnancy affected by the variation introduced by normal limitations of clinical care, and should it be modified?
The present study suggested that both validating the serum hCG data examined in previous studies of symptomatic early pregnancies and improving the resolution of follow-up time (to hour rather than day precision) both have an impact on the serum hCG trends. Specifically, this study demonstrates that the natural rise in serum hCG in normal pregnancies may be faster than previously reported (4). The hCG curve originally modeled may have “underestimated” the rate at which hCG grows over time. This is likely due to the variability introduced by rounding of time points, human error in transcription of data, or use of outside laboratories. This “bias towards the null” is well documented for linear models with covariate measurement error (12). However, it is desirable in clinical practice to have conservative estimates of the normal limits of hCG increase so as not to interrupt a potential growing pregnancy. Therefore, based on the data presented in this manuscript, the curves generated in 2004 (4) are valid as a clinical aid, and no change in clinical care is recommended.
The study cohort evaluated here was similar to that examined in our previous study (4) of early hCG trends, with the exception of being slightly older (mean 27.1 versus 23.6 years), of younger average gestational age (35.3 vs. 38 days since LMP), and with a smaller proportion of African Americans (62% vs. 87%). The younger gestational age observed here placed the hCG data more comfortably within the range of 39 days gestational age in which the linear model provides the best fit (13).
Data validation in the current study had three components. A small proportion of the observed hCG values needed the date or value revised after validation against the EMR and another small group of patients had additional data contained in the electronic medical record that was not included in the clinical database used to follow women at risk for an ectopic pregnancy. The original clinical database included data from multiple laboratories using variable reference standards that were not controlled for in previous models of hCG trends in early pregnancy(14). Though the validated data offers less external generalizability, since in clinical practice pregnant women often visit multiple laboratories for their serum collections, removing the one-third of un-validated hCG values reduced the amount of random error inherent in the data set (attributable to the use of a single laboratory with a consistent reference standard). Precision was then further increased by assessing hCG curves in the validated data using the actual time of the serum hCG value instead of rounding the item to the day of phlebotomy. As validation and precision increased, the slope of hCG change was noted to be steeper and the 1st percentile of hCG change (i.e. the minimal expected normal rise) was noted to be higher.
Importantly, the differences in hCG patterns over time in these data compared to our previous work were small and likely not clinically significant. It is often helpful for practitioners to know the slowest possible rise in serum hCG in viable early gestations, so as to have a minimum threshold for being concerned about an abnormal pregnancy (8, 15). The validation of the 1st percentile, or slowest, predicted hCG rise observed here suggested the possibility that a more aggressive threshold could be adopted (i.e. a faster rise should be considered the limit of “normal”). However, no large population studies have been performed yet to characterize the raw number of patients who fall under this threshold and go on to have normal intrauterine pregnancies. Clinicians are cautioned against using more aggressive (“faster”) thresholds until more rigorous population studies can be performed, as the risk of intervening on normal, healthy pregnancies too soon is too great. It is clinically prudent to be conservative in the determination of a non-viable gestation when patients are not always evaluated at the same laboratory, or at exact 24 or 48 hour intervals.
Acknowledgments
The authors acknowledge contributions by Michelle Mergenthal, Lynne Taylor, Katie Dillon, and Chris Morse to data collection and by Paul Whittaker to editorial revisions. All are employed by and work at the University of Pennsylvania.
Funding Sources: K24HD060687 (KB), R01-HD076279 (KB) and a FOCUS medical student fellowship in Women’s Health supported by a Bertha Dagan Berman Award at the Center for Clinical Epidemiology and Biostatistics, University of Pennsylvania. The Sponsor had no role in data collection, analysis, interpretation, report writing or decision to publish.
Footnotes
Publisher's Disclaimer: This is a PDF file of an unedited manuscript that has been accepted for publication. As a service to our customers we are providing this early version of the manuscript. The manuscript will undergo copyediting, typesetting, and review of the resulting proof before it is published in its final citable form. Please note that during the production process errors may be discovered which could affect the content, and all legal disclaimers that apply to the journal pertain.
The authors report no conflict of interest.
References
- 1.Stewart BK, Nazar-Stewart V, Toivola B. Biochemical discrimination of pathologic pregnancy from early, normal intrauterine gestation in symptomatic patients. Am J Clin Pathol. 1995;103:386–390. doi: 10.1093/ajcp/103.4.386. [DOI] [PubMed] [Google Scholar]
- 2.Barnhart K, Mennuti MT, Benjamin I, Jacobson S, Goodman D, Coutifaris C. Prompt diagnosis of ectopic pregnancy in an emergency department setting. Obstet Gynecol. 1994;84:1010–1015. [PubMed] [Google Scholar]
- 3.Barnhart KT, Simhan H, Kamelle SA. Diagnostic accuracy of ultrasound above and below the beta-hCG discriminatory zone. Obstet Gynecol. 1999;94:583–587. doi: 10.1016/s0029-7844(99)00347-6. [DOI] [PubMed] [Google Scholar]
- 4.Barnhart KT, Sammel MD, Rinaudo PF, Zhou L, Hummel AC, Guo W. Symptomatic patients with an early viable intrauterine pregnancy: HCG curves redefined. Obstet Gynecol. 2004;104:50–55. doi: 10.1097/01.AOG.0000128174.48843.12. [DOI] [PubMed] [Google Scholar]
- 5.Seeber BE, Sammel MD, Guo W, Zhou L, Hummel A, Barnhart KT. Application of redefined human chorionic gonadotropin curves for the diagnosis of women at risk for ectopic pregnancy. Fertil Steril. 2006;86:454–459. doi: 10.1016/j.fertnstert.2005.12.056. [DOI] [PubMed] [Google Scholar]
- 6.Seeber BE, Barnhart KT. Suspected ectopic pregnancy. Obstet Gynecol. 2006;107:399–413. doi: 10.1097/01.AOG.0000198632.15229.be. [DOI] [PubMed] [Google Scholar]
- 7.Connolly A, Ryan DH, Stuebe AM, Wolfe HM. Reevaluation of Discriminatory and Threshold Levels for Serum b-hCG in Early Pregnancy. Obstet Gynecol. 2013;121:65–70. doi: 10.1097/aog.0b013e318278f421. [DOI] [PubMed] [Google Scholar]
- 8.Morse CB, Sammel MD, Shaunik A, Allen-Taylor L, Oberfoell NL, Takacs P, et al. Performance of human chorionic gonadotropin curves in women at risk for ectopic pregnancy: exceptions to the rules. Fertil Steril. 2012;97:101–106. doi: 10.1016/j.fertnstert.2011.10.037. [DOI] [PMC free article] [PubMed] [Google Scholar]
- 9.Doubilet PM, Benson CB, Bourne T, Blaivas M. Diagnostic criteria for nonviable pregnancy early in the first trimester. N Engl J Med. 2013;369:1443–1451. doi: 10.1056/NEJMra1302417. [DOI] [PubMed] [Google Scholar]
- 10.Laird NM, Ware JH. Random-effects models for longitudinal data. Biometrics. 1982;38:963–974. [PubMed] [Google Scholar]
- 11.Burnham KP, Anderson DR. Model Selection and Multimodel Inference: A Practical Information-Theoretic Approach. 2nd. New York (NY): Springer-Verlag; 2002. [Google Scholar]
- 12.Tosteson TD, Buonaccorsi JP, Demidenko E. Covariate measurement error and the estimation of random effect parameters in a mixed model for longitudinal data. Statistics in Medicine. 1998;17:1959–1971. doi: 10.1002/(sici)1097-0258(19980915)17:17<1959::aid-sim886>3.0.co;2-f. [DOI] [PubMed] [Google Scholar]
- 13.Chung K, Sammel MD, Coutifaris C, Chalian R, Lin K, Castelbaum AJ, et al. Defining the rise in serum HCG in viable pregnancies achieved through use of IVF. Hum Reprod. 2006;21:823–828. doi: 10.1093/humrep/dei389. [DOI] [PubMed] [Google Scholar]
- 14.Davies S, Bryn F, Cole LA. Human chorionic gonadotropin testing for early pregnancy viability and complications. Clin Lab Med. 2003;23:257–264. doi: 10.1016/s0272-2712(03)00026-x. [DOI] [PubMed] [Google Scholar]
- 15.Barnhart KT. Early pregnancy failure: beware of the pitfalls of modern management. Fertil Steril. 2012;98:1061–1065. doi: 10.1016/j.fertnstert.2012.09.018. [DOI] [PMC free article] [PubMed] [Google Scholar]


