

Abstract
Herpesvirus saimiri, an oncogenic herpesvirus, during latency produces seven small nuclear RNAs, called the Herpesvirus saimiri U RNAs (HSUR1–7). HSUR1 mediates degradation of the host microRNA, miR-27, via a process that requires imperfect base-pairing. The decreased levels of miR-27 lead to prolonged T-cell activation and likely contribute to oncogenesis. To gain insight into HSUR1-mediated degradation of miR-27, we probed the in vivo secondary structure of HSUR1 and coupled this with bioinformatic structural analyses. The results suggest that HSUR1 adopts a conformation different than previously believed and that the region complementary to miR-27 lacks stable structure. To determine whether HSUR1 structural flexibility is important for its ability to mediate miR-27 degradation, we performed structurally informative mutagenic analyses of HSUR1. HSUR1 mutants in which the miR-27 binding site sequence is preserved, but sequestered in predicted helices, lose their ability to decrease miR-27 levels. These results indicate that the HSUR1 miR27-binding region must be available in a conformationally flexible segment for noncoding RNA function.
Keywords: HSUR1, miRNA degradation element, in vivo chemical mapping
INTRODUCTION
Herpesvirus saimiri (HVS) in its natural host, the squirrel monkey (Saimiri sciureus), causes asymptomatic infection; however, when infecting New World primates, HVS enters latency and induces aggressive T-cell lymphomas (Ensser and Fleckenstein 2005). HVS is also capable of transforming human T cells (Biesinger et al. 1992) and was recently linked to idiopathic pulmonary fibrosis in humans (Folcik et al. 2014). During latency, the most abundant HVS transcripts are the seven Herpesvirus saimiri U RNAs (HSUR1–7) (Murthy et al. 1986; Lee et al. 1988; Wassarman et al. 1989; Albrecht and Fleckenstein 1992). The HSURs resemble Sm-class small nuclear RNAs (snRNAs): They each possess a 5′ cap that is hypermethylated and contain a binding site for Sm proteins (Fig. 1; Lee et al. 1988; Lee and Steitz 1990).
FIGURE 1.

DMS mapping of in vitro transcribed HSUR1. (A) The previous model of HSUR1. (B) The unconstrained minimum free energy (MFE) model. (A,B) Predicted interactions of HSUR1 with miR-27a are depicted. The seed sequence of miR-27a is shown in bold. Watson–Crick base pairs are represented by solid lines and wobble base pairs by dotted lines. Known interaction sites for HuR and Sm proteins are indicated on the structure models. The DMS reactivity from in vitro probing averaged from four independent experiments (example gel shown in C is represented by the intensity of red color at each base. The green arrows indicate nucleotides predicted to be in Watson–Crick pairs flanked by Watson–Crick pairs that have strong DMS reactivity. (C) In vitro DMS probing of HSUR1 structure. Primer extension analysis of HSUR1 performed on in vitro transcribed RNA, treated or not with DMS. M, marker; A, C, G, and U correspond to sequencing lanes containing, respectively, ddTTP, ddGTP, ddCTP, and ddATP. Green stars depict strong DMS reactivity (>4× average) obtained from the average of four independent experiments.
A sequence in the central hairpin of HSUR1 (nts 42–59) is partially complementary to host microRNAs of the miR-27 family, comprising miR-27a and miR-27b, which differ by only one nucleotide (nt) at position 19. The complementarity to the miR-27 seed region (nts 54–59) together with the additional complementarity to the 3′ end of miR-27 (nts 42–51) allows HSUR1–miR-27 base-pairing, which induces degradation of these miRNAs by an as-yet-unknown mechanism (Cazalla et al. 2010). Interestingly, other herpesviruses have also evolved mechanisms to counteract miR-27 function: Alcelaphine herpesvirus 1 and Ovine herpesvirus 2 produce protein homologs of miR-27 target genes (Guo et al. 2014), while murine cytomegalovirus (MCMV) expresses a transcript that, similarly to HSUR1, selectively binds and mediates degradation of miR-27 (Buck et al. 2010; Libri et al. 2012; Marcinowski et al. 2012). It has been recently suggested that the MCMV transcript to induce miR-27 degradation recruits the nontemplate terminal uridyl transferase TUT1 to mark miRNA for degradation, which is followed by digestion by the 3′-5′ exonuclease DIS3L2 (Haas et al. 2016). In T cells, decreased levels of miR-27 result in prolonged T-cell activation and likely contribute to maintaining oncogenic transformation (Guo et al. 2014). Importantly, the proteins targeted by miR-27 are found to be elevated in various cancers (Garcia-Areas et al. 2014; Pomerleau et al. 2014), suggesting that deregulation of immune signaling can contribute to oncogenesis.
Since the discovery of HSUR1 in 1988 (Lee et al. 1988), its secondary structure has been represented by the model shown in Figure 1A. This model was based on the accessibility of the 5′ region for RNase H-directed cleavage promoted by an antisense oligonucleotide, as well as the need for the assembly site of Sm proteins to be single-stranded (Lee et al. 1988). In the current study, we used the structure mapping reagent dimethyl sulfate (DMS; a reagent that preferentially methylates adenosines and cytidines in single-stranded regions [Peattie and Gilbert 1980; Moazed et al. 1986; Ehresmann et al. 1987]) and bioinformatics to define the in vivo structure of HSUR1. Surprisingly, we found that HSUR1 adopts a much more open conformation than previously believed and that its structure is likely thermodynamically unstable. We provide evidence that structural flexibility is required for HSUR1 to mediate miR-27 degradation.
RESULTS AND DISCUSSION
HSUR1 adopts a different conformation than previously predicted
To analyze the secondary structure of HSUR1, we used RNAstructure, a commonly used RNA secondary structure prediction program (Reuter and Mathews 2010). This program, in the absence of experimental constraints, does not predict the previously proposed HSUR1 structure (Fig. 1A; Lee et al. 1988), but a minimum free energy (MFE) model (Fig. 1B) that has a predicted folding free energy of −25.2 kcal/mol, which is 9.1 kcal/mol more stable than the previous model (−16.1 kcal/mol). This MFE fold, however, sequesters the HuR and Sm binding sites in structured regions (Lee et al. 1988; Myer et al. 1992); additionally, it does not contain the 3′ terminal hairpin shared by other HSURs that is a structural mimic of host snRNA 3′ hairpins (Murthy et al. 1986; Lee et al. 1988; Wassarman et al. 1989; Albrecht and Fleckenstein 1992; Golembe et al. 2005b). SnRNA 3′ terminal hairpins are necessary for the assembly of Sm proteins (Golembe et al. 2005a,b) and may also be important for cleavage by the Integrator complex, which is responsible for the 3′-end processing of snRNAs (Baillat et al. 2005; Ezzeddine et al. 2011; Xie et al. 2015). Thus, this energetically stable, but biologically unrealistic model, seemed unlikely to represent the native in vivo fold of HSUR1.
We attempted to gain insight into HSUR1 structure by performing chemical mapping of an in vitro transcribed HSUR1 RNA. The obtained in vitro DMS data (Fig. 1C) conflict with the previous HSUR1 model: 3 nt predicted to be in Watson–Crick pairs that are flanked by Watson–Crick pairs have strong DMS reactivity (A33, A74, and A116; indicated with green arrows in Fig. 1A). The strong DMS reactivity is defined as having DMS reactivity 4× higher than average. In addition, it is unlikely that in vitro transcribed and folded HSUR1 adopts the unconstrained MFE fold predicted by RNAstructure, as 4 nt predicted to be in Watson–Crick pairs flanked by Watson–Crick pairs have strong DMS reactivity (A33, A50, A51, and A52; indicated with green arrows in Fig. 1B). Using the in vitro DMS data to constrain RNAstructure calculations also did not result in an alternative model that would fulfill the biological requirements: contain accessible protein binding sites and a 3′ terminal hairpin. In summary, the in silico calculations combined with the in vitro chemical mapping contradict the previous HSUR1 structure, but do not yield a biologically relevant alternative structure.
HSUR1 is loosely structured
To acquire HSUR1 secondary structure data that are more biologically relevant, we performed in vivo DMS probing. HVS-transformed marmoset T cells were briefly incubated with DMS (Wells et al. 2000) and primer extension was performed on isolated total RNA (Fig. 2A). Unlike the in vitro experiments (Fig. 1), there was no DMS reactivity detected in the Sm binding site, suggesting that the majority HSUR1 particles are assembled into snRNPs. There was also less reactivity observed in the HuR binding region (Fig. 2E,F), suggesting that this region may not be fully protected by protein binding. When compared to the previous HSUR1 model, 2 nt (also reactive in vitro) predicted to be in Watson–Crick pairs flanked by Watson–Crick pairs have strong in vivo DMS reactivity (A33 and A74; indicated with green arrows in Fig. 2B), suggesting that this fold does not exist in vivo. Additionally, when strong DMS data were used to constrain RNAstructure calculations, the previous model was not generated, indicating that the central hairpin of the previous model does not represent the in vivo structure of HSUR1. The in vivo DMS data also contradict the unconstrained MFE fold generated by RNAstructure: There are 6 nt predicted to be in Watson–Crick pairs flanked by Watson–Crick pairs that have strong DMS reactivity (A33, A40, A45, A50, A51, and A52; indicated with green arrows in Fig. 2C). When the in vivo DMS data are included in the folding calculation as constraints, the unconstrained MFE model is no longer predicted.
FIGURE 2.

In vivo DMS mapping reveals a flexible structure for HSUR1. (A) Primer extension analysis of HSUR1 performed on total RNA isolated from HVS-transformed marmoset T cells treated or untreated with DMS. M, marker; A, C, G, and U correspond to sequencing lanes containing, respectively, ddTTP, ddGTP, ddCTP, and ddATP. Green stars depict strong DMS reactivity (>4× average) averaged from three independent experiments. (B,C) In vivo DMS data plotted on the previous model of HSUR1 (B), and the unconstrained MFE model (C). The green arrows indicate nucleotides predicted to be in Watson–Crick pairs flanked by Watson–Crick pairs that have strong DMS reactivity. (D) The HSUR1 MFE model predicted using hard constraints from in vivo DMS probing. (E) The MFE model predicted using soft constraints from in vivo DMS probing. The DMS reactivity averaged from three independent experiments on the structure models obtained with primer A in B–E is represented by the intensity of red color at each base. (F) The partial MFE model (omitting the 3′ terminal hairpin) depicting DMS reactivity averaged from three independent experiments obtained with primer B. Watson–Crick base pairs are represented by solid lines and wobble base pairs by dotted lines. Predicted interactions of HSUR1 with miR-27a are depicted in B–F. The seed sequence of miR-27a is shown in bold. Known interaction sites for HuR and Sm proteins are indicated on the structure models.
A novel MFE fold (Fig. 2D), which contains the HuR and Sm binding sites in accessible single-stranded regions, is predicted when in vivo DMS data are included in the calculation as “hard constraints” (see Materials and Methods). The DMS-constrained model also predicts the conserved 3′ terminal hairpin structure. Interestingly, this new model adds two base pairs to the structure (between G123–U133 and U124–A132). Although DMS data were not collected for the 3′ terminal hairpin, forbidding spurious base-pairing between the highly reactive nucleotides upstream with the nucleotides in the hairpin allowed the software to predict this fold. These base pairs and additional “noncanonical” interactions (e.g., between G121–A135) may further “zip-up” the structure to increase stability. The predicted free energy of the DMS-constrained model is only 2 kcal/mol more stable than the previous model (−18.1 versus −16.1 kcal/mol) and that is because of the additional pairs in the 3′ terminal hairpin. The central hairpin in both the previous and the new model is marginally stable—contributing only −4.2 and −4.1 kcal/mol, respectively, to the overall predicted folding energy. For the new model, base pairs between C54–G75 and U55–A74, although predicted by the software, may be unstable. Thus, although the revised model is better supported by the in vivo data, the overall picture for HSUR1 suggests that the central hairpin is conformationally flexible. Indeed, when all DMS data are included as pseudoenergies, where higher DMS reactivity destabilizes pairs (here called “soft constraints”) (Cordero et al. 2012), the central stem loop does not form and the only predicted base pairs in HSUR1 are those in the 3′ terminal hairpin (Fig. 2E).
The in vivo DMS probing revealed some reactivity in the miR-27 binding site, which may be explained by the stoichiometry of the HSUR1–miR-27a interaction: It is estimated that one HVS-transformed marmoset T cell expresses ∼20,000 copies of HSUR1 (Lee et al. 1988) and ∼370 copies of miR-27a (Cazalla et al. 2010); so, the number of HSUR1 molecules exceeds that of miR-27a by ∼50-fold. The number of miR-27a particles reflects the steady-state level of miR-27a that has not been degraded.
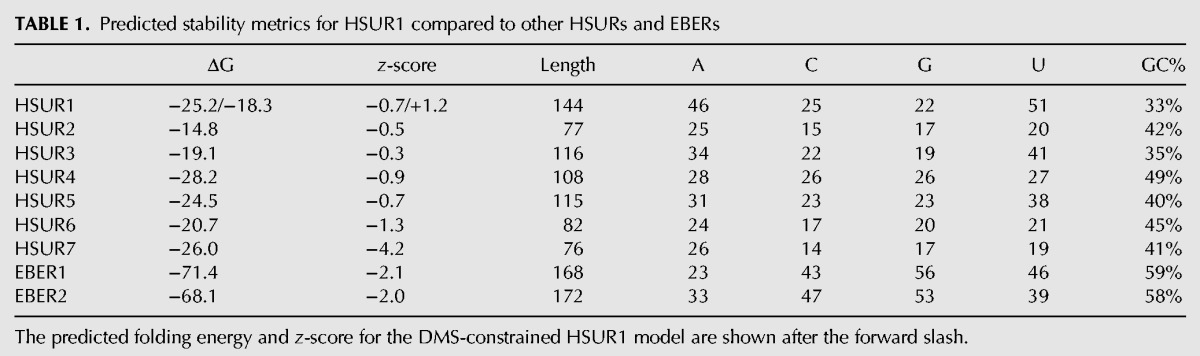
Further evidence for the loosely structured or flexible structure of HSUR1 comes from calculation of its thermodynamic z-score. The z-score measures the stability of an RNA sequence versus matched randomized sequences; negative z-scores suggest that base-pairing is an evolved property of the sequence—disruption of native pairs in randomized sequences leads to less favorable (less negative) predicted energies and a more negative z-score (Clote et al. 2005). For example, the Epstein-Barr virus encoded RNAs (EBERs [Lerner et al. 1981])—two highly structured small noncoding RNAs that are in the size range of HSUR1—both have significantly negative z-scores, −2 or below (Table 1), indicating that their sequences are more than two standard deviations more stable than random. HSUR1 has a z-score of −0.7: The native sequence is not significantly more stable than random, indicating that it is less likely to possess global structure. Compared to the other HSURs, whose z-scores range from −0.3 to −4.2, HSUR1 is predicted to be the third least-structured HSUR (Table 1). In addition, if the predicted energy of the DMS-constrained HSUR1 model is used in the z-score calculation, the z-score is predicted to be positive, suggestive of HSUR1's tendency to be unstructured.
TABLE 1.
Predicted stability metrics for HSUR1 compared to other HSURs and EBERs
In summary, based on in vivo DMS probing and in silico structural analysis, HSUR1 appears to be loosely structured, and the central hairpin may be partially unfolded or dynamic in vivo. Interestingly, it has been reported that intrinsic dynamism of snRNA hairpin loops facilitates protein binding (Rau et al. 2012). Thus, it seems likely that structural flexibility occurring within the central hairpin region of HSUR1 may also facilitate interaction with Argonaute-loaded miR-27.
The unstructured nature of HSUR1 is necessary for efficient down-regulation of miR-27a levels
To determine whether HSUR1 structural flexibility is important for mediating miR-27 degradation, we performed mutagenic analyses of HSUR1 aimed at involving the miR-27 binding region in alternative RNA secondary structures. The mutants were stably expressed in a B cell line and the resulting miR-27a levels were assayed (Fig. 3). As controls, we used the previously described HSUR1 mutant BS, in which the miR-27 binding site is disrupted (Cazalla et al. 2010), and the SD mutant, in which only the miR-27 seed binding site is disrupted (see Fig. 3A). The modeled base-pairing between C54–G75 and U55–A74 is likely an artifact of the prediction or a transient interaction that is not relevant for HSUR1 function. We constructed the S1 mutant that disrupts these interactions, but this mutation has almost no effect on HSUR1 predicted thermodynamic stability. We also generated HSUR1 mutants, in which the miR-27 binding site is predicted to be sequestered in strong secondary structures. For the mutant S2, we introduced an internal complementarity to the full miR-27 binding site. For the mutants S3 and S4, only the HSUR1 region complementary to the 3′ end of miR-27 is predicted to be sequestered in secondary structures (see Fig. 3A). Mutants S2–S4 are predicted to enhance RNA thermodynamic stability.
FIGURE 3.

Unstructured HSUR1 down-regulates miR-27a levels most effectively. (A) Partial structure models for HSUR1 and its mutants. The colored residues on WT HSUR1 indicate the location of the mutated residues in the mutants. Watson–Crick base pairs are represented by solid lines and wobble base pairs by dotted lines. Predicted base-pairing interactions with miR-27a and the folding energies of predicted hairpins are indicated (units are kcal/mol [k/m]). (B) Northern blot comparing the levels of HSUR1 and miR-27a in marmoset (marm.) T cells transformed with HVS (either WT or HSUR1-deleted [Δ2A]), and in BJAB cells transduced with either WT HSUR1 or BS HSUR1, in which the miR-27 binding site is disrupted. Each lane contained 10 µg total RNA. For quantification, in vitro transcribed HSUR1 and synthetic miR-27a were used in the amounts indicated at the top of the blot (fmol). (C) Northern blot detecting the levels of three miRNAs, HSUR1 and U6 in BJAB cells stably expressing various HSUR1 mutants (at the same levels as shown in B). EV, empty vector. (D) Levels of miR-27a in the BJAB cells expressing the HSUR1 mutants were normalized to the geometric means of miR-16 and miR-20a levels. Averages from four independent experiments with standard deviations are shown. P-values between WT HSUR1 and its mutants were calculated using a Student's t-test; (*), (**), and (***) indicate P-values <0.05, <0.01, and <0.001, respectively.
These six mutants, as well as wild-type (WT) HSUR1 and empty vector (EV) controls, were used to generate stable cell lines in the EBV-negative human B cell line BJAB. BJAB cells were used in this study because, compared to the Jurkat T cells used in previous studies (Cazalla et al. 2010; Guo et al. 2014), they produce higher levels of miR-27. The HSUR1 expression levels in BJAB cells (either WT or the BS mutant) are comparable to those in marmoset T cells transformed with WT HVS (13.7 ± 3.9 and 25.25 ± 10.04 versus 23 ± 7.9 fmol in 10 µg of RNA, n = 3) (Fig. 3B). In contrast, in BJAB cells transduced with the BS mutant, which is unable to induce miR-27 degradation, the miR-27a levels are lower than in marmoset T cells transformed with Δ2A HVS, which lacks the HSUR1 gene (0.38 ± 0.12 versus 0.78 ± 0.11 fmol in 10 µg of RNA, n = 5), whereas the amounts of miR-27a in BJAB and marmoset T cells expressing WT HSUR1s are similar (0.16 ± 0.012 versus 0.18 ± 0.039 fmol in 10 µg of RNA, n = 5). As BJAB cells and marmoset T cells differ in the miR-27 migration pattern, which likely stems from generation of various miRNA isoforms (isomiRs) in different cell types (Cloonan et al. 2011), only the mature miR-27a was quantified.
To assess the ability of HSUR1 mutants to trigger miR-27a degradation, the total RNA isolated from BJAB cells stably expressing these ncRNAs was probed for the levels of miR-27a and for two control miRNAs: miR-16 and miR-20a (Fig. 3C). As expected, in the presence of WT HSUR1, steady-state levels of miR-27a were lower (30 ± 15%) than in cells transduced with the empty vector (Fig. 3D). The BS and SD mutants predicted to be unable to bind miR-27a yielded unchanged miR-27a levels (106 ± 3.3% and 111 ± 7.5%, respectively). The S1 mutant, which bears a mutation that does not significantly alter the predicted structural stability of HSUR1 (Fig. 3A), was as effective in lowering the abundance of miR-27a as WT (30 ± 10%). This indicates that the modeled pairs (C55–G75 and U56–A74) in the WT sequence are either not present or only transiently formed in vivo and do not constrain the miR-27 site or inhibit HSUR1 potential to degrade the miRNA. Interestingly, the S2 mutant, in which miR-27 complementarity is preserved but sequestered in a predicted hairpin structure, did not alter normal miR-27a levels (122 ± 24%). In addition, the S3 and S4 mutants that sequester the region complementary to the 3′ end of miR-27 in predicted hairpins significantly lost the ability to lower miR-27a levels (78 ± 14% and 88 ± 8.4%, respectively). These results indicate that the entire miR27-binding region of HSUR1 must be available in a conformationally flexible segment to trigger degradation of miR-27a. Interestingly, other groups observed that the complementarity of the miRNA-degrading transcript to the miRNA 3′ end is necessary for efficient miRNA decay (Ameres et al. 2010; de la Mata et al. 2015; Haas et al. 2016). In this study, we additionally demonstrate that the region complementary to the miRNA 3′ end must be in an accessible conformation to mediate miRNA degradation.
In the above experiments, the presence of WT HSUR1 did not result in a complete degradation of miR-27a; ∼30% of miR-27a remained. Similarly, the previous report by Cazalla et al. (2010) showed that the levels of miR-27a, measured by quantitative RT-PCR, are fourfold lower in the cells transformed with WT HVS in comparison to the cells transformed with a virus lacking HSUR1 (Cazalla et al. 2010).
In our experiments, we observed significant variation in the expression levels of the different HSUR1 mutants (Fig. 3C). We do not attribute this to co-degradation of HSUR1 and miR-27, as HSUR1 levels exceed those of miR-27a by at least 50-fold in our experiments. Additionally, HSUR1 co-degradation was not observed in previous studies (Cazalla et al. 2010; Guo et al. 2014). For example, the SD mutant has a predicted folding energy and a measured steady-state level comparable to WT HSUR1, but is unable to lower miR-27a abundance (Fig. 3C,D); thus, if co-degradation with miR-27 were affecting HSUR1 levels, one would expect this mutant to have higher steady-state levels than WT. The HSUR1 mutants exhibiting increased expression levels, however, do have lower predicted folding energies than the WT sequence (Fig. 3A) and are likely to be more structured. This suggests that folding stability is responsible for the variable HSUR1 accumulation observed across our experiments. Indeed, the calculated z-scores for BS, S2, S3, and S4 are −1.8, −3.5, −1.3, and −1.1, respectively, suggesting that these mutant molecules are more structured than the WT, SD, and S1 sequences (z-scores of −0.7, −0.8, and −0.7, respectively).
HSUR1 stability mutants differentially bind miR-27a
To study whether the stabilization of internal structure HSUR1's region complementary to miR-27 affects miR-27a binding, we prepared cell extracts from BJAB cells stably expressing the HSUR1 mutants and immunoprecipitated the HSUR1 particles to determine the levels of coimmunoprecipitated miR-27a (Fig. 4). We used anti-Sm antibodies (Y12), which bind to Sm proteins and are able to pull down snRNAs, including viral HSURs (Lee et al. 1988). As expected, miR-27a was coimmunoprecipitated neither from cells transduced with the empty vector nor from cells expressing the HSUR1 mutants bearing mutations in miR-27a binding sequence, BS and SD (Fig. 4A,B). miR-27a was efficiently immunoprecipitated from cells expressing WT HSUR1, indicating an interaction between miR-27a and these HSUR1 molecules (Fig. 4A,B). The HSUR1-bound miR-27a observed in this pulldown (Fig. 4) and in the previous study (Cazalla et al. 2010) could represent an intermediate step in miRNA degradation, but could alternatively suggest that HSUR1 has an additional function: to act as a miRNA sponge (Bak and Mikkelsen 2014). The mutant S1—which should not affect miR-27a binding—as expected, also associated well with miR-27a (Fig. 4A,B). Interestingly, the S2 mutant, which preserves complementarity but sequesters that sequence in a predicted hairpin structure, was not able to pull down miR-27a efficiently, likely explaining why this mutant does not down-regulate miR-27a levels. However, miR-27a was coimmunoprecipitated with the mutants S3 and, to a larger extent, S4. Thus, occlusion of HSUR1's region complementary to the 3′ end of miR-27a, appears to counteract its ability to trigger miR-27a degradation despite allowing miR-27a to bind. It is possible that the intermolecular duplexes formed between miR-27a and these more highly structured HSUR1 mutants are not competent for miRNA degradation; e.g., when the HSUR1 structure is too stable to allow all 15 intermolecular base pairs (occurring in the WT complex) to form.
FIGURE 4.

Some HSUR1 mutants bind miR-27a without effectively triggering its degradation. (A) Coimmunoprecipitation of miR-27a from BJAB cells stably expressing either EV or various HSUR1 mutants (expressed at levels shown in Fig. 3B) with anti-Sm antibody (αSm). I, input, 1%; S, supernatant, 1%; P, pellet, 100%. Northern blots with probes for miRNAs, HSUR1 and U2 for the precipitation control. (B) Levels of HSUR1-bound miR-27a in BJAB cells expressing the HSUR1 mutants were normalized to the input. Averages from four independent experiments with standard deviations are shown. P-values between WT HSUR1 and its mutants were calculated using Student's t-test; (*) P-values <0.05.
Conclusions
We propose a revised model for the secondary structure of HSUR1, based on in vivo chemical probing data. This new model predicts that the central hairpin of HSUR1 remains conformationally flexible in order to bind miR-27 and down-regulate its level. We validated this hypothesis through HSUR1 mutational analyses and found that some thermodynamically stabilized HSUR1 mutants, although they accumulate to higher levels in the cell and bind miR-27a, do not lower miR-27a abundance as effectively as the WT. Our results indicate that the entire miR-27-targeting region of HSUR1 must be flexible to induce degradation of miR27a. This might suggest a common theme for miRNA-degradation elements—the miRNA binding region must not only be complementary to the 3′ end of miRNA, but also must be conformationally flexible to efficiently mediate miRNA decay.
MATERIALS AND METHODS
Cell culture
Marmoset (Callithrix jacchus) T cells transformed with either WT or Δ2A HVS (Desrosiers et al. 1986) were grown as described previously (Cook et al. 2004). HEK293T cells and BJAB cells were grown in DMEM and RPMI medium, respectively, containing 10% fetal bovine serum, 2 mM L-glutamine and antibiotics.
HSUR1 T7 transcription
HSUR1 sequence was PCR amplified using primers containing the T7 promoter followed by an additional “G” (Fwd: 5′-TATCTAATACGACTCACTATAGGACACTACATATTTATTTATTTATTTCTTAG, Rev: 5′-TGGTACCGGTCATCATATTTAC). The product was gel-purified and used for in vitro transcription at a final concentration ∼25 ng/µL. The reaction was carried out for 2 h at 37°C and contained 400 mM HEPES pH 7.5, 120 mM MgCl2, 200 mM DTT, 10 mM Spermidine, 4 mM of each rNTPs, 20 U RNase Inhibitor (Roche), and 5 U of laboratory-made T7 RNA polymerase. The product was purified by 8 M urea 6% polyacrylamide gel electrophoresis (PAGE), extracted in G-50 buffer (20 mM Tris pH 7.5, 0.3 M NaOAc, 2 mM EDTA, 0.1% SDS), and ethanol precipitated.
DMS modifications
In vitro: 5 µg RNA resuspended in 20 µL of water was heated for 2 min at 90°C and slow cooled to 37°C. 2.5 µL 10× RNA folding buffer (100 mM Tris pH 7, 1 M KCl, 100 mM MgCl2) was added and the solution was incubated for 20 min at 37°C. To 9 µL of folded RNA, 1µL of dimethyl sulfate (DMS, Sigma #D186309) diluted in ethanol was added to a final concentration of 0.5 or 2%, then incubated 20 min at room temperature (RT). The reaction was quenched with β-mercaptoethanol (BME) to 0.6 M. RNA was ethanol precipitated and resuspended in 20 µL water.
In vivo: 107 of HVS transformed marmoset T cells (∼ 20 mL of cell culture) were collected and resuspended in 1 mL of phosphate-buffered saline (PBS) and either left untreated or incubated with either 0.5% or 1% of DMS (diluted in ethanol) for 2 min at RT. The reaction was quenched with 0.6 M and rinsed in more quench solution and TRIzol (Invitrogen) isolated.
Primer extension
In vitro: 0.4 µg (4 µL) of DMS modified RNA was mixed with 200,000 counts per minute (cpm) radiolabeled primer A (the same as used for PCR amplification of HSUR1) and 1 µL 10× annealing buffer (100 mM Tris pH 8.0, 400 mM KCl) and water added to 10 µL. The primers were annealed by heating at 95° C for 1 min and then at 55° C for 15 min. The reaction was supplemented with 10 µL enzyme mix containing 4 µL of 5× First Strand buffer, 1 µL 10 mM dNTPs, 1 µL 1 M DTT, 1 µL 200 U/µL Superscript III reverse transcriptase (Life Technologies), and 3 µL water. For the dideoxy ladders, ddNTPs were added to the appropriate reactions to a final concentration 0.5 mM. Reactions were incubated for 30 min at 55°C. Then, the RNA was hydrolyzed by adding 1 µL of 4 M NaOH and heating for 5 min at 95°C, and the reaction was neutralized with 2 µL 2 M HCl. cDNA was ethanol precipitated and resuspended in 10 µL water. Two microliters of the reaction was resolved by 8% sequencing urea-PAGE. The gel was dried and exposed to phosphor screen overnight.
In vivo: Reactions were performed as above, except 10 µg of total RNA isolated from marmoset cells was used in a final reaction volume of 30 µL. Additional reactions were performed with the primer B (5′-CCAGTACCTACAAAAATTGGTCA).
DMS reactivity was determined by band densitometry (calculated using Quantity One). DMS reactivity for each nucleotide was determined as band intensity differences derived from treated (DMS concentration = 0.5%) versus untreated RNA preparations and were normalized to the average reactivity for all nucleotides.
Bioinformatics
Structure predictions and free energy calculations were performed with RNAstructure, version 5.8 (Reuter and Mathews 2010) using the Turner energy model (Mathews 2004; Turner and Mathews 2010) at 37°C. DMS probing data were incorporated either as hard constraints, where strongly reactive nucleotides are forbidden to occur in Watson–Crick pairs flanked by Watson–Crick pairs, or as soft constraints, where the folding energy of a paired nucleotide is penalized by its DMS reactivity. Soft constraints used all data, whereas the hard constraints were applied only to strongly reactive nucleotides, defined as having DMS reactivity 4× higher than the average signal for all bases. Thermodynamic z-scores were calculated by determining the average difference in folding free energy predicted for a native sequence versus 200 randomized “mutants” and normalizing that value by the standard deviation of the entire set.
HSUR1 mutagenesis and cell transduction
Mutations were introduced into HSUR1 expressed in the pAGM lentiviral backbone (Guo et al. 2014) by site-directed mutagenesis using Phusion polymerase (NEB) and the following primers:
SD Fwd: 5′-TCTTAGTAATGTTTACTGGAACTTAAATCACACTTAACCT
SD Rev: 5′-AGGTTAAGTGTGATTTAAGTTCCAGTAAACATTACTAAGA
S1 Fwd: 5′-AACGGGTTGTTTGAGAGTTTTAGTTTAGGTTATCACAGATTTAAGTTC
S1 Rev: 5′-GAACTTAAATCTGTGATAACCTAAACTAAAACTCTCAAA CAACCCGTT
S2 Fwd: 5′-GTGATAACCTAAACAGATTTAAGTCTCAAACAACCCGTTAC
S2 Rev: 5′-GTAACGGGTTGTTTGAGACTTAAATCTGTTTAGGTTATCAC
S3 Fwd: 5′-CAGCAAGTAACGGGTTGTTTGGAACTTTTAGTTTAGGTTATCACAGATTTA
S3 Rev: 5′-TAAATCTGTGATAACCTAAACTAAAAGTTCCAAACAACCCGTTACTTGCTG
S4 Fwd: 5′-AGGTTATCACAGATTTAAGTTCCAGTAACCCATTACTAAGAAATAAATAAATAAATATG
S4 Rev: 5′-CATATTTATTTATTTATTTCTTAGTAATGGGTTACTGGAACTTAAATCTGTGATAACCT
Mutations were confirmed by Sanger sequencing (Keck, Yale).
To produce viral vectors, 10-cm culture dishes of sub-confluent HEK293T cells were cotransfected using TransIT-293T (Mirus Bio) with 10 µg of the appropriate HSUR1-expressing pAGM, 10 µg psPAX, and 2 µg pMDG.2. The virus-containing supernatants were collected 2 d later and passed through 0.45-µm filters.
For stable transduction, BJAB cells were infected at a multiplicity of infection ∼10 (assessed on HEK293T cells) of the viruses described above. The cells were then GFP+ sorted using the same gates across the cell lines.
Northern blot analysis
Northern blot analysis was performed as described previously (Guo et al. 2014). Briefly, total RNAs from BJAB cells transduced with either the empty vector or a HSUR1 mutant were TRIzol isolated and separated by 15% urea-PAGE (10 or 20 µg per lane). The RNA was electrotransferred to Hybond-N+ membrane (Amersham) and UV crosslinked. miRNAs, HSUR1, and U6 were detected using radiolabeled probes (Guo et al. 2014).
For the anti-Sm IP, the RNA was transferred to Hybond-NX membrane (Amersham), which was then cut at the position of Xylene Cylenol (which comigrates with ∼40 nt-long dsDNA); the bottom was 1-ethyl-3-(3-dimethylaminopropyl) carbodiimide (EDC) crosslinked for higher miRNA sensitivity (Pall and Hamilton 2008), while the top was UV crosslinked. Densitometry was performed by using Quantity One. P-values were calculated using Graph Prism 6.
ACKNOWLEDGMENTS
We are grateful to Dr. Mingyi Xie, Dr. Kazimierz Tycowski, and other Steitz Laboratory members for helpful discussions and to Angela Miccinello for editorial assistance. This work was supported by National Institutes of Health grants CA16038 and CA193300-01. Paulina Pawlica is funded by a Brown-Coxe Fellowship. Walter N. Moss is funded by an NIH K99/R00 fellowship (1K99GM112877-01). Joan A. Steitz is an investigator of the Howard Hughes Medical Institute.
Footnotes
Article published online ahead of print. Article and publication date are at http://www.rnajournal.org/cgi/doi/10.1261/rna.054817.115.
REFERENCES
- Albrecht JC, Fleckenstein B. 1992. Nucleotide sequence of HSUR 6 and HSUR 7, two small RNAs of herpesvirus saimiri. Nucleic Acids Res 20: 1810. [DOI] [PMC free article] [PubMed] [Google Scholar]
- Ameres SL, Horwich MD, Hung JH, Xu J, Ghildiyal M, Weng Z, Zamore PD. 2010. Target RNA-directed trimming and tailing of small silencing RNAs. Science 328: 1534–1539. [DOI] [PMC free article] [PubMed] [Google Scholar]
- Baillat D, Hakimi MA, Naar AM, Shilatifard A, Cooch N, Shiekhattar R. 2005. Integrator, a multiprotein mediator of small nuclear RNA processing, associates with the C-terminal repeat of RNA polymerase II. Cell 123: 265–276. [DOI] [PubMed] [Google Scholar]
- Bak RO, Mikkelsen JG. 2014. miRNA sponges: soaking up miRNAs for regulation of gene expression. Wiley Interdiscip Rev RNA 5: 317–333. [DOI] [PubMed] [Google Scholar]
- Biesinger B, Muller-Fleckenstein I, Simmer B, Lang G, Wittmann S, Platzer E, Desrosiers RC, Fleckenstein B. 1992. Stable growth transformation of human T lymphocytes by herpesvirus saimiri. Proc Natl Acad Sci 89: 3116–3119. [DOI] [PMC free article] [PubMed] [Google Scholar]
- Buck AH, Perot J, Chisholm MA, Kumar DS, Tuddenham L, Cognat V, Marcinowski L, Dolken L, Pfeffer S. 2010. Post-transcriptional regulation of miR-27 in murine cytomegalovirus infection. RNA 16: 307–315. [DOI] [PMC free article] [PubMed] [Google Scholar]
- Cazalla D, Yario T, Steitz JA. 2010. Down-regulation of a host microRNA by a Herpesvirus saimiri noncoding RNA. Science 328: 1563–1566. [DOI] [PMC free article] [PubMed] [Google Scholar]
- Cloonan N, Wani S, Xu Q, Gu J, Lea K, Heater S, Barbacioru C, Steptoe AL, Martin HC, Nourbakhsh E, et al. 2011. MicroRNAs and their isomiRs function cooperatively to target common biological pathways. Genome Biol 12: R126. [DOI] [PMC free article] [PubMed] [Google Scholar]
- Clote P, Ferre F, Kranakis E, Krizanc D. 2005. Structural RNA has lower folding energy than random RNA of the same dinucleotide frequency. RNA 11: 578–591. [DOI] [PMC free article] [PubMed] [Google Scholar]
- Cook HL, Mischo HE, Steitz JA. 2004. The Herpesvirus saimiri small nuclear RNAs recruit AU-rich element-binding proteins but do not alter host AU-rich element-containing mRNA levels in virally transformed T cells. Mol Cell Biol 24: 4522–4533. [DOI] [PMC free article] [PubMed] [Google Scholar]
- Cordero P, Kladwang W, VanLang CC, Das R. 2012. Quantitative dimethyl sulfate mapping for automated RNA secondary structure inference. Biochemistry 51: 7037–7039. [DOI] [PMC free article] [PubMed] [Google Scholar]
- de la Mata M, Gaidatzis D, Vitanescu M, Stadler MB, Wentzel C, Scheiffele P, Filipowicz W, Grosshans H. 2015. Potent degradation of neuronal miRNAs induced by highly complementary targets. EMBO Rep 16: 500–511. [DOI] [PMC free article] [PubMed] [Google Scholar]
- Desrosiers RC, Silva DP, Waldron LM, Letvin NL. 1986. Nononcogenic deletion mutants of herpesvirus saimiri are defective for in vitro immortalization. J Virol 57: 701–705. [DOI] [PMC free article] [PubMed] [Google Scholar]
- Ehresmann C, Baudin F, Mougel M, Romby P, Ebel JP, Ehresmann B. 1987. Probing the structure of RNAs in solution. Nucleic Acids Res 15: 9109–9128. [DOI] [PMC free article] [PubMed] [Google Scholar]
- Ensser A, Fleckenstein B. 2005. T-cell transformation and oncogenesis by γ2-herpesviruses. Adv Cancer Res 93: 91–128. [DOI] [PubMed] [Google Scholar]
- Ezzeddine N, Chen J, Waltenspiel B, Burch B, Albrecht T, Zhuo M, Warren WD, Marzluff WF, Wagner EJ. 2011. A subset of Drosophila integrator proteins is essential for efficient U7 snRNA and spliceosomal snRNA 3′-end formation. Mol Cell Biol 31: 328–341. [DOI] [PMC free article] [PubMed] [Google Scholar]
- Folcik VA, Garofalo M, Coleman J, Donegan JJ, Rabbani E, Suster S, Nuovo A, Magro CM, Di Leva G, Nuovo GJ. 2014. Idiopathic pulmonary fibrosis is strongly associated with productive infection by herpesvirus saimiri. Mod Pathol 27: 851–862. [DOI] [PMC free article] [PubMed] [Google Scholar]
- Garcia-Areas R, Libreros S, Amat S, Keating P, Carrio R, Robinson P, Blieden C, Iragavarapu-Charyulu V. 2014. Semaphorin7A promotes tumor growth and exerts a pro-angiogenic effect in macrophages of mammary tumor-bearing mice. Front Physiol 5: 17. [DOI] [PMC free article] [PubMed] [Google Scholar]
- Golembe TJ, Yong J, Battle DJ, Feng W, Wan L, Dreyfuss G. 2005a. Lymphotropic Herpesvirus saimiri uses the SMN complex to assemble Sm cores on its small RNAs. Mol Cell Biol 25: 602–611. [DOI] [PMC free article] [PubMed] [Google Scholar]
- Golembe TJ, Yong J, Dreyfuss G. 2005b. Specific sequence features, recognized by the SMN complex, identify snRNAs and determine their fate as snRNPs. Mol Cell Biol 25: 10989–11004. [DOI] [PMC free article] [PubMed] [Google Scholar]
- Guo YE, Riley KJ, Iwasaki A, Steitz JA. 2014. Alternative capture of noncoding RNAs or protein-coding genes by herpesviruses to alter host T cell function. Mol Cell 54: 67–79. [DOI] [PMC free article] [PubMed] [Google Scholar]
- Haas G, Cetin S, Messmer M, Chane-Woon-Ming B, Terenzi O, Chicher J, Kuhn L, Hammann P, Pfeffer S. 2016. Identification of factors involved in target RNA-directed microRNA degradation. Nucleic Acids Res 44: 2873–2887. [DOI] [PMC free article] [PubMed] [Google Scholar]
- Lee SI, Steitz JA. 1990. Herpesvirus saimiri U RNAs are expressed and assembled into ribonucleoprotein particles in the absence of other viral genes. J Virol 64: 3905–3915. [DOI] [PMC free article] [PubMed] [Google Scholar]
- Lee SI, Murthy SC, Trimble JJ, Desrosiers RC, Steitz JA. 1988. Four novel U RNAs are encoded by a herpesvirus. Cell 54: 599–607. [DOI] [PubMed] [Google Scholar]
- Lerner MR, Andrews NC, Miller G, Steitz JA. 1981. Two small RNAs encoded by Epstein-Barr virus and complexed with protein are precipitated by antibodies from patients with systemic lupus erythematosus. Proc Natl Acad Sci 78: 805–809. [DOI] [PMC free article] [PubMed] [Google Scholar]
- Libri V, Helwak A, Miesen P, Santhakumar D, Borger JG, Kudla G, Grey F, Tollervey D, Buck AH. 2012. Murine cytomegalovirus encodes a miR-27 inhibitor disguised as a target. Proc Natl Acad Sci 109: 279–284. [DOI] [PMC free article] [PubMed] [Google Scholar]
- Marcinowski L, Tanguy M, Krmpotic A, Radle B, Lisnic VJ, Tuddenham L, Chane-Woon-Ming B, Ruzsics Z, Erhard F, Benkartek C, et al. 2012. Degradation of cellular mir-27 by a novel, highly abundant viral transcript is important for efficient virus replication in vivo. PLoS Pathog 8: e1002510. [DOI] [PMC free article] [PubMed] [Google Scholar]
- Mathews D. 2004. Predicting the secondary structure common to two RNA sequences with Dynalign. Curr Protoc Bioinformatics 8: 12.4.1–12.4.11. [DOI] [PubMed] [Google Scholar]
- Moazed D, Stern S, Noller HF. 1986. Rapid chemical probing of conformation in 16 S ribosomal RNA and 30 S ribosomal subunits using primer extension. J Mol Biol 187: 399–416. [DOI] [PubMed] [Google Scholar]
- Murthy S, Kamine J, Desrosiers RC. 1986. Viral-encoded small RNAs in herpes virus saimiri induced tumors. EMBO J 5: 1625–1632. [DOI] [PMC free article] [PubMed] [Google Scholar]
- Myer VE, Lee SI, Steitz JA. 1992. Viral small nuclear ribonucleoproteins bind a protein implicated in messenger RNA destabilization. Proc Natl Acad Sci 89: 1296–1300. [DOI] [PMC free article] [PubMed] [Google Scholar]
- Pall GS, Hamilton AJ. 2008. Improved northern blot method for enhanced detection of small RNA. Nat Protoc 3: 1077–1084. [DOI] [PubMed] [Google Scholar]
- Peattie DA, Gilbert W. 1980. Chemical probes for higher-order structure in RNA. Proc Natl Acad Sci 77: 4679–4682. [DOI] [PMC free article] [PubMed] [Google Scholar]
- Pomerleau V, Landry M, Bernier J, Vachon PH, Saucier C. 2014. Met receptor-induced Grb2 or Shc signals both promote transformation of intestinal epithelial cells, albeit they are required for distinct oncogenic functions. BMC Cancer 14: 240. [DOI] [PMC free article] [PubMed] [Google Scholar]
- Rau M, Stump WT, Hall KB. 2012. Intrinsic flexibility of snRNA hairpin loops facilitates protein binding. RNA 18: 1984–1995. [DOI] [PMC free article] [PubMed] [Google Scholar]
- Reuter JS, Mathews DH. 2010. RNAstructure: software for RNA secondary structure prediction and analysis. BMC Bioinformatics 11: 129. [DOI] [PMC free article] [PubMed] [Google Scholar]
- Turner DH, Mathews DH. 2010. NNDB: the nearest neighbor parameter database for predicting stability of nucleic acid secondary structure. Nucleic Acids Res 38: D280–D282. [DOI] [PMC free article] [PubMed] [Google Scholar]
- Wassarman DA, Lee SI, Steitz JA. 1989. Nucleotide sequence of HSUR 5 RNA from herpesvirus saimiri. Nucleic Acids Res 17: 1258. [DOI] [PMC free article] [PubMed] [Google Scholar]
- Wells SE, Hughes JM, Igel AH, Ares M Jr. 2000. Use of dimethyl sulfate to probe RNA structure in vivo. Methods Enzymol 318: 479–493. [DOI] [PubMed] [Google Scholar]
- Xie M, Zhang W, Shu MD, Xu A, Lenis DA, DiMaio D, Steitz JA. 2015. The host Integrator complex acts in transcription-independent maturation of herpesvirus microRNA 3′ ends. Genes Dev 29: 1552–1564. [DOI] [PMC free article] [PubMed] [Google Scholar]